
Figure 1
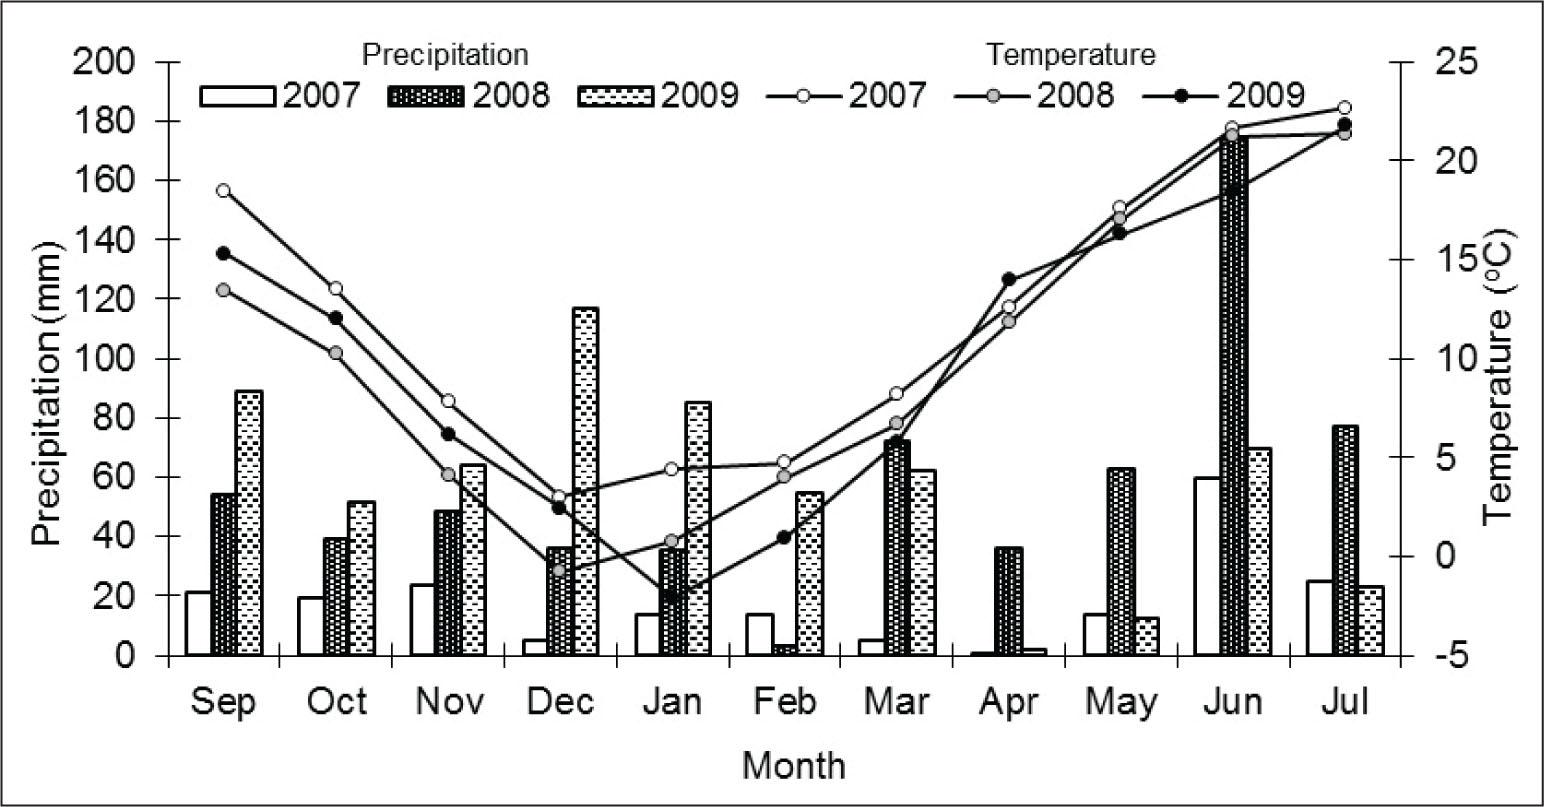
Figure 2
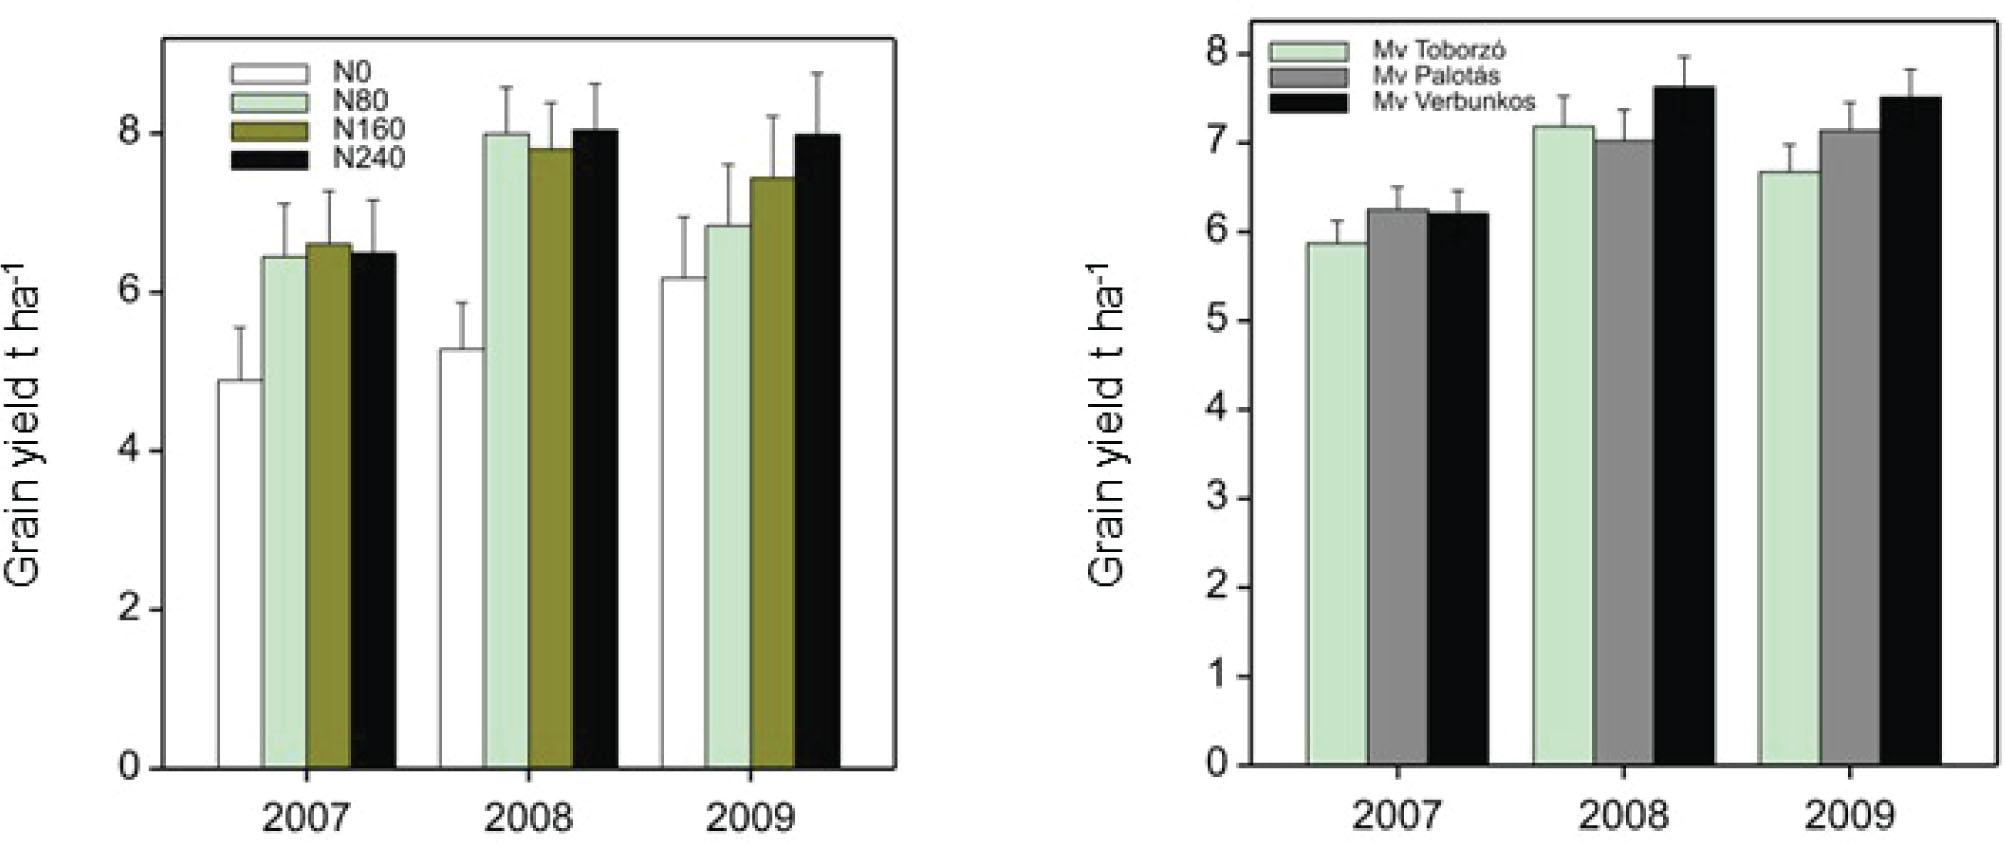
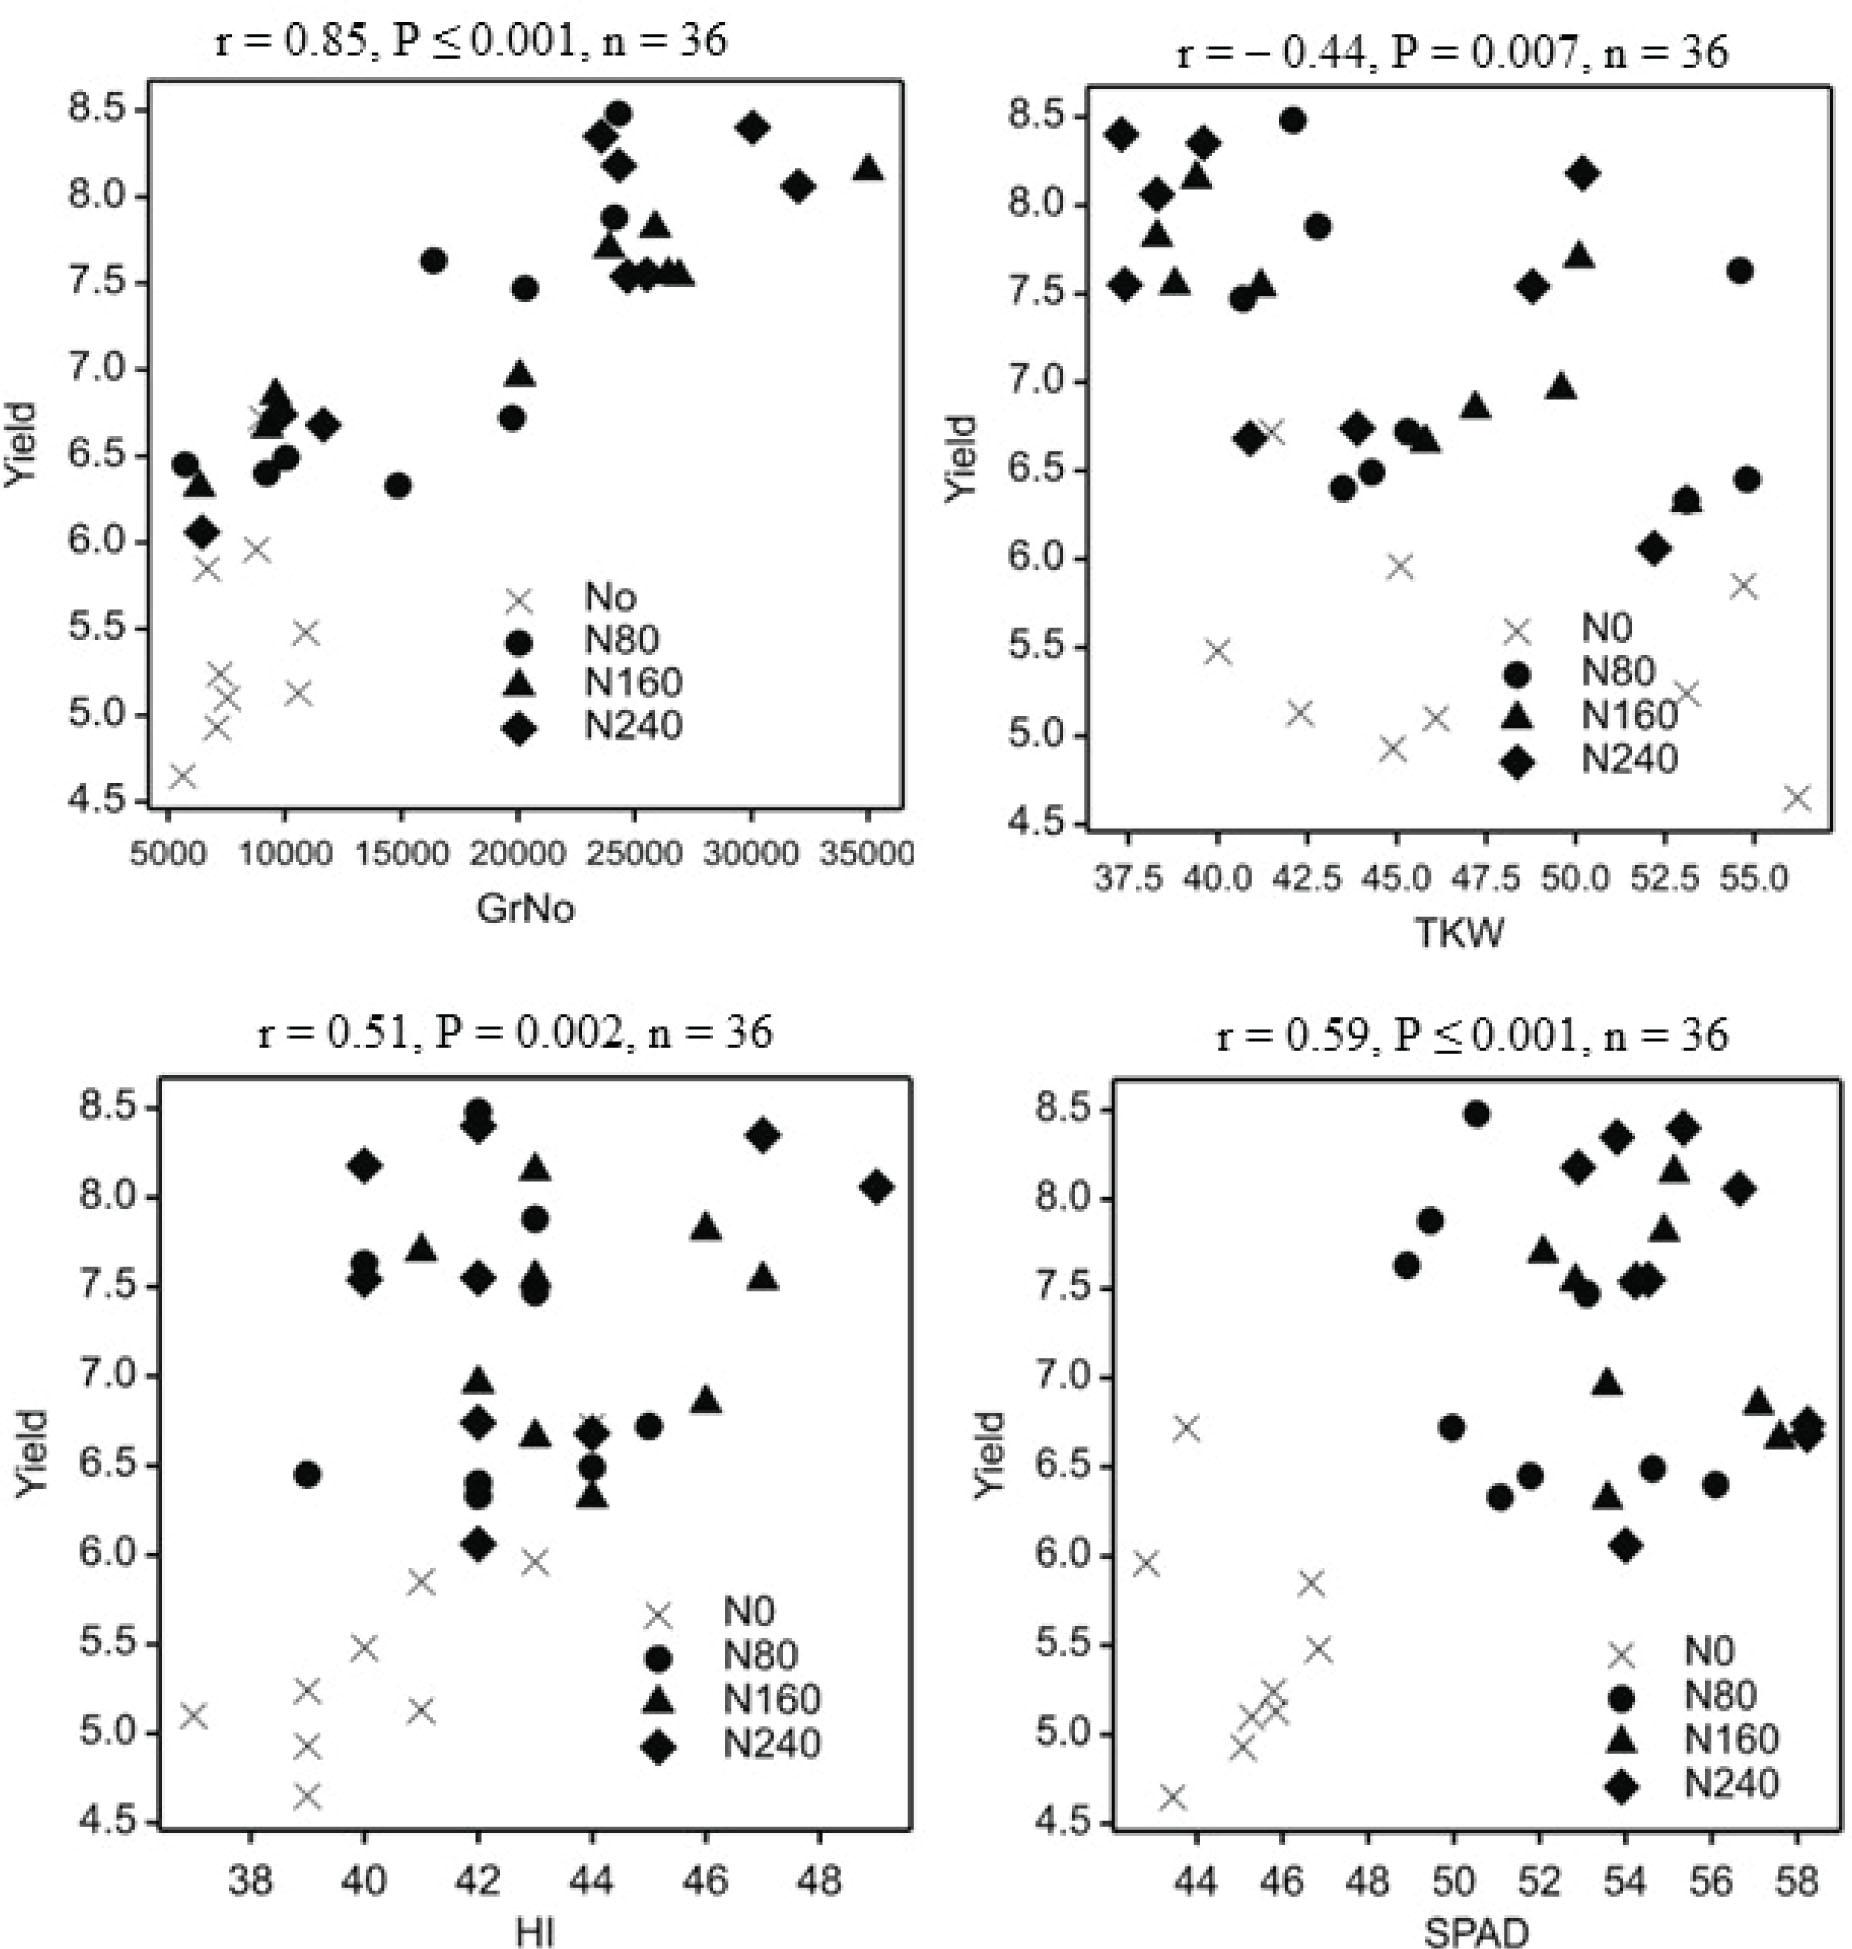
Figure 3
Effect of N fertilization on the yield components of wheat cultivars (2007–2009)Tabelle 3_ Einfluss der N-Düngung auf die Ertragskomponenten der Weizensorten (2007–2009)
| N dose | 2007 | 2008 | 2009 | ||||||
|---|---|---|---|---|---|---|---|---|---|
| Toborzó | Palotás | Verbunkos | Toborzó | Palotás | Verbunkos | Toborzó | Palotás | Verbunkos | |
| Spike number per square meter | |||||||||
| N0 | 655.8 | 620.8 | 639.0 | 493.8 | 512.8 | 487.5 | 469.0 | 415.2 | 425.5 |
| N80 | 685.0 | 674.5 | 644.0 | 583.2 | 614.2 | 527.0 | 521.0 | 535.2 | 543.8 |
| N160 | 745.0 | 703.8 | 693.2 | 689.0 | 570.8 | 715.8 | 610.2 | 697.2 | 560.0 |
| N240 | 823.8 | 699.2 | 726.5 | 753.2 | 612.2 | 593.2 | 643.2 | 624.8 | 680.8 |
| LSD values | |||||||||
| N | 77.59 P<0.05 | 62.12 P<0.001 | 38.16 P<0.001 | ||||||
| V | 46.13 P<0.05 | 31.62 P<0.01 | 40.10 = nonsignificant; V = variety | ||||||
| N×V | 102.66 = nonsignificant; V = variety | 76.67 P<0.001 | 73.14 P<0.05 | ||||||
| Grain number per spike | |||||||||
| N0 | 10.72 | 12.35 | 13.05 | 14.65 | 20.62 | 22.30 | 14.23 | 21.23 | 21.20 |
| N80 | 8.72 | 14.75 | 15.02 | 28.12 | 39.32 | 46.10 | 28.53 | 36.92 | 37.30 |
| N160 | 8.45 | 14.35 | 14.80 | 34.72 | 46.35 | 48.92 | 32.92 | 38.62 | 46.20 |
| N240 | 8.20 | 14.45 | 16.47 | 32.32 | 41.70 | 50.62 | 38.42 | 37.72 | 47.02 |
| LSD values | |||||||||
| N | 1.525 = nonsignificant; V = variety | 2.865 P<0.001 | 2.870 P<0.001 | ||||||
| V | 1.180 P<0.001 | 2.539 P<0.001 | 2.143 P<0.001 | ||||||
| N×V | 2.345 P<0.05 | 4.832 = nonsignificant; V = variety | 4.314 P<0.05 | ||||||
| Thousand kernel weight (g) | |||||||||
| N0 | 56.20 | 44.87 | 46.07 | 53.10 | 42.27 | 40.05 | 54.67 | 45.05 | 41.45 |
| N80 | 54.82 | 44.32 | 43.57 | 54.60 | 42.80 | 42.10 | 53.05 | 45.32 | 40.70 |
| N160 | 53.12 | 47.25 | 45.82 | 50.05 | 38.82 | 39.40 | 49.57 | 41.22 | 38.30 |
| N240 | 52.20 | 43.92 | 40.97 | 50.22 | 37.37 | 37.30 | 48.82 | 39.60 | 38.30 |
| LSD values | |||||||||
| N | 1.704 P<0.01 | 1.235 P<0.001 | 2.886 P<0.01 | ||||||
| V | 1.559 P<0.001 | 0.980 P<0.001 | 1.981 P<0.001 | ||||||
| N×V | 2.941 = nonsignificant; V = variety | 1.930 = nonsignificant; V = variety | 4.124 = nonsignificant; V = variety | ||||||
Analysis of variance for the two-factor, split-plot experimentTabelle 2_ Varianzanalyse für den zwei-faktoriellen Versuch mit Split-Plot-Design
| Factor | d.f. | 2007 | 2008 | 2009 | |||
|---|---|---|---|---|---|---|---|
| MS | F-value | MS | F-value | MS | F-value | ||
| Replication | 3 | 4.1269 | 7.90 | 0.4331 | 1.08 | 1.2185 | 1.74 |
| Fertilization | 3 | 7.9836 | 15.28 P<0.001 | 21.4013 | 53.59 P<0.001 | 7.2848 | 10.39 P<0.01 |
| Residual (a) | 9 | 0.5225 | 4.28 | 0.3993 | 1.82 | 0.7009 | 3.87 |
| Variety | 2 | 0.6941 | 5.68 P<0.01 | 1.5543 | 7.06 P<0.01 | 2.8560 | 15.78 P<0.001 |
| Fertilization × Variety | 6 | 0.1252 | 1.03 = nonsignificant | 0.1691 | 0.77 = nonsignificant | 0.2666 | 1.47 = nonsignificant |
| Residual (b) | 24 | 0.1221 | 0.2200 | 0.1810 | |||
| Total | 47 | 0.981 | 1.670 | 0.925 | |||
Effect of N treatments on the harvest index (HI %) of the wheat cultivars (2007–2009)Tabelle 4_ Einfluss der N-Düngung auf den Harvestindex (HI %) der Weizensorten (2007–2009)
| N dose | 2007 | 2008 | 2009 | ||||||
|---|---|---|---|---|---|---|---|---|---|
| Toborzó | Palotás | Verbunkos | Toborzó | Palotás | Verbunkos | Toborzó | Palotás | Verbunkos | |
| N0 | 38.50 | 38.75 | 36.75 | 38.50 | 41.25 | 40.00 | 40.75 | 43.25 | 44.00 |
| N80 | 39.25 | 43.50 | 42.00 | 40.00 | 43.00 | 42.00 | 41.50 | 44.75 | 42.75 |
| N160 | 44.25 | 46.00 | 43.00 | 40.75 | 42.75 | 42.75 | 41.50 | 47.00 | 45.75 |
| N240 | 42.00 | 41.50 | 44.00 | 40.25 | 41.50 | 41.50 | 40.25 | 46.50 | 49.25 |
| LSD values | |||||||||
| N | 2.112 P<0.001 | 1.160 P<0.05 | 1.560 P<0.01 | ||||||
| V | 1.727 = nonsignificant; V = variety | 1.627 P<0.05 | 1.392 P<0.001 | ||||||
| N×V | 3.369 = nonsignificant; V = variety | 2.829 = nonsignificant; V = variety | 2.644 P<0.05 | ||||||
Results of regression analysis for two independent variables (grain number per square meter, thousand kernel weight) on the yield of winter wheat for each N treatmentTabelle 6_ Ergebnisse der Regressionanalyse von zwei unabhängigen Variablen (Kornzahl pro m2, Tausendkorngewicht) auf dem Ertrag von Winterweizen für jede N-Stufe
| Parameter | N0 | N80 | N160 | N240 | ||||
|---|---|---|---|---|---|---|---|---|
| Estimate | t-value | Estimate | t-value | Estimate | t-value | Estimate | t-value | |
| Constant | 6.05 | 1.07 = nonsignificant; TKW = thousand kernel weight. | 5.21 | 2.49 P<0.05 | 6.67 | 6.69 P<0.001 | 5.81 | 4.00 P<0.01 |
| Grain number | 5.702 × 10⁻⁵ | 0.22 = nonsignificant; TKW = thousand kernel weight. | 9.86 × 10⁻⁵ | 3.04 P<0.05 | 5.45 × 10⁻⁵ | 5.20 P<0.01 | 8.26 × 10⁻⁵ | 4.62 P<0.01 |
| TKW | −0.023 | −0.29 = nonsignificant; TKW = thousand kernel weight. | 0.006 | 0.17 = nonsignificant; TKW = thousand kernel weight. | −0.011 | −0.60 = nonsignificant; TKW = thousand kernel weight. | −0.06 10–2 | −0.02 = nonsignificant; TKW = thousand kernel weight. |
| R2% = 15.8 | R20/0% = 54.9 | R20/0% = 88.6 | R20/0% = 76.9 | |||||
| F-value <1 | F-value = 5.87 P<0.05 | F-value = 32.08 P<0.001 | F-value = 14.32 P<0.01 | |||||
Effect of N treatment on the soil properties in the 0- to 20-cm layer at the end of the experimentTabelle 1_ Einfluss der N-Düngung auf die Bodeneigenschaften in der Tiefe von 0–20 cm am Ende des Versuches
| N fertilization | Humus content | pH value | Total N | AL-P2O5 Each plot was given 120 kg · ha–1 of each P2O5 and K2O fertilizer. | AL-K2O Each plot was given 120 kg · ha–1 of each P2O5 and K2O fertilizer. |
|---|---|---|---|---|---|
| kg · ha–1 | [%] | (KCl) | [mg · kg–1] | [mg · kg–1] | [mg · kg–1] |
| 0 | 2.74a | 6.86ab | 7.88b | 282.0a | 205.0a |
| 80 | 2.94a | 6.55b | 9.94ab | 236.3a | 221.5a |
| 160 | 2.81a | 7.02a | 11.18ab | 247.8a | 206.3a |
| 240 | 2.96a | 6.76ab | 13.32a | 259.5a | 233.3a |
Effect of N fertilization on the chlorophyll content (SPAD index) of the flag leaf in the individual wheat cultivars (2007–2009)Tabelle 5_ Einfluss der N-Düngung auf den Chlorophyllgehalt (SPAD Index) des Fahnenblattes der Weizensorten (2007–2009)
| N dose | 2007 | 2008 | 2009 | ||||||
|---|---|---|---|---|---|---|---|---|---|
| Toborzó | Palotás | Verbunkos | Toborzó | Palotás | Verbunkos | Toborzó | Palotás | Verbunkos | |
| N0 | 43.45 | 45.08 | 45.28 | 45.80 | 45.85 | 46.85 | 46.67 | 42.82 | 43.77 |
| N80 | 51.78 | 54.63 | 56.10 | 48.90 | 49.45 | 50.52 | 51.07 | 49.95 | 53.10 |
| N160 | 53.58 | 57.10 | 57.60 | 52.08 | 54.25 | 55.12 | 53.57 | 52.82 | 54.90 |
| N240 | 54.00 | 58.25 | 58.23 | 52.90 | 54.53 | 55.35 | 54.23 | 53.80 | 56.62 |
| LSD values | |||||||||
| N | 2.896 P<0.001 | 0.443 P<0.001 | 1.290 P<0.001 | ||||||
| V | 1.260 P<0.001 | 0.606 P<0.001 | 0.874 P<0.001 | ||||||
| N×V | 3.381 = nonsignificant; V = variety | 1.056 = nonsignificant; V = variety | 1.830 P<0.01 | ||||||