
Table 1.
Distribution of survey respondents (study programmes are categorised as follows: G – Thematic and General Geography programmes, T – Teacher Education programmes, and M – Environmental Management programmes.
| University | Study programmes | Type of study programmes | Gender | Number of respondents per study year | Economic status (average monthly income) | Total number of respondents | Percentage to all enrolled students in a given study programmes | |||||
|---|---|---|---|---|---|---|---|---|---|---|---|---|
| Male | Female | Other | 2nd | 3rd | 4th | 5th | ||||||
| AMU | General Geography | G | 10 | 9 | 1 | 8 | 4 | 4 | 4 | 444€ | 20 | 31% |
| Environmental management | M | 4 | 26 | 2 | 0 | 11 | 21 | 0 | 512€ | 32 | 32% | |
| Educational module | T | 8 | 15 | 1 | 10 | 6 | 5 | 3 | 272€ | 24 | 63% | |
| UO | Political Geography | G | 18 | 5 | 0 | 5 | 6 | 6 | 6 | 378€ | 23 | 37% |
| Geography teaching | T | 15 | 18 | 0 | 0 | 4 | 18 | 11 | 403€ | 33 | 42% | |
| Totally | 55 | 73 | 4 | 23 | 31 | 54 | 24 | 132 | ||||
Table 2.
Learning conditions and factors used in the research procedure are divided by education types.
| Education types | Learning conditions | Learning factors |
|---|---|---|
| Formal education | Content of study programmes | The study programme content is focused on career preparation |
| The study programme content is interdisciplinary | ||
| The study programme content is focused on sustainable development | ||
| Types of compulsory classes | Lectures and seminar meetings (consultations) | |
| Classes in training rooms, laboratories and computer labs | ||
| Fieldwork and visits to workplaces | ||
| Learning methods practised during studying | Exercises using modern technology, programmes and applications | |
| Problem-based teaching (problem-solving through hypothesis formulation, discussion, simulation games) | ||
| Project method (developing creative solutions in a group) | ||
| Personal attitude of teachers towards sustainable development | The teacher provides current (but pessimistic) facts about sustainable development | |
| The teacher encourages personal and responsible engagement in sustainable development | ||
| The teacher demonstrates a sustainable lifestyle through their personal attitude and example | ||
| Non-formal education | Types of optional activities outside the study programme | Participation in popular science events (e.g., festivals, meetings with experts, job and internship fairs, GISDay, Earth Day, Sustainable Development Week) |
| Activities for others (e.g., volunteering, charity collections, student council, trips abroad such as AID) | ||
| Activities for science (e.g., Student Science Club, projects/grants conducted in cooperation with scientists, ERASMUS) | ||
| Informal education | Sustainable and eco-friendly university infrastructure | The building infrastructure incorporates ecological solutions (light, water, and heating sensors; wall and window insulation; waste bins) |
| The surroundings include landscaped greenery (e.g., parks, gardens), with rainwater tanks, insect houses, and bird houses | ||
| The campus and accompanying infrastructure are consolidated in one place, minimising resource consumption (e.g., water, fuel, packaging, energy) | ||
| Non-academic environment | Activities in the family home and neighbourhood | |
| Activities in primary and secondary school, and workplaces | ||
| Activities in the virtual world |
Table 3.
Summary of descriptive statistics for student self-assessed influences of learning conditions influence on ESF competencies, including mean (M), median (Mdn), standard deviation (SD), skewness (Sk), kurtosis (Kurt), minimum (Min), and maximum (Max) values.
| Learning conditions | M | Mdn | SD | Sk | Kurt | Min | Max |
|---|---|---|---|---|---|---|---|
| Content of study programmes | 2.49 | 2.33 | 0.41 | −0.24 | −0.78 | 1.67 | 3.00 |
| Types of compulsory classes | 2.38 | 2.33 | 0.39 | 0.02 | −0.44 | 1.67 | 3.00 |
| Learning methods practised during studying | 2.56 | 2.67 | 0.47 | −0.58 | −1.08 | 1.67 | 3.00 |
| Personal attitude of teachers towards sustainable development | 2.50 | 2.50 | 0.46 | −0.37 | −1.02 | 1.67 | 3.00 |
| Types of optional activities outside the study programme | 2.37 | 2.33 | 0.43 | 0.16 | −0.43 | 1.67 | 3.00 |
| Sustainable and eco-friendly university infrastructure | 2.70 | 2.33 | 0.51 | −0.68 | 0.62 | 1.33 | 3.00 |
| Non-academic environment | 2.31 | 2.33 | 0.39 | 0.19 | −0.29 | 1.33 | 3.00 |
Table 4.
Comparison of ESF competence scores by sociodemographic factors, including gender, university, study programme type, study year and economic status.
| Sociodemografic factors | Variables | Envisioning sustainability futures scores | d Cohena | η2 | |
|---|---|---|---|---|---|
| Mean | Standard deviation | ||||
| Gender | Male (n = 55) | 3.59 | 0.82 | 0.41 | – |
| Female (n = 73) | 3.91 | 0.76 | |||
| University | Adam Mickiewicz University in Poznań (n = 76) | 4.05 | 0.79 | 0.82 | – |
| University of Ostrava (n = 56) | 3.44 | 0.67 | |||
| Study programme | M (n = 32) | 4.36 | 0.56 | – | 0.17 |
| T (n = 57) | 3.58 | 0.80 | |||
| G (n = 43) | 3.65 | 0.76 | |||
| Study year | 2nd (n = 23) | 3.57 | 0.63 | – | 0.06 |
| 3rd (n = 31) | 3.95 | 0.78 | |||
| 4th (n = 54) | 3.94 | 0.78 | |||
| 5th (n = 24) | 3.49 | 0.91 | |||
| Economic status | <200 EU (n = 30) | 3.56 | 0.78 | – | 0.05 |
| 200–400 EU (n = 45) | 3.91 | 0.79 | |||
| 400–600 EU (n = 33) | 3.69 | 0.77 | |||
| 600–800 (n = 13) | 4.10 | 0.90 | |||
| >800 EU (n = 11) | 3.91 | 0.78 | |||
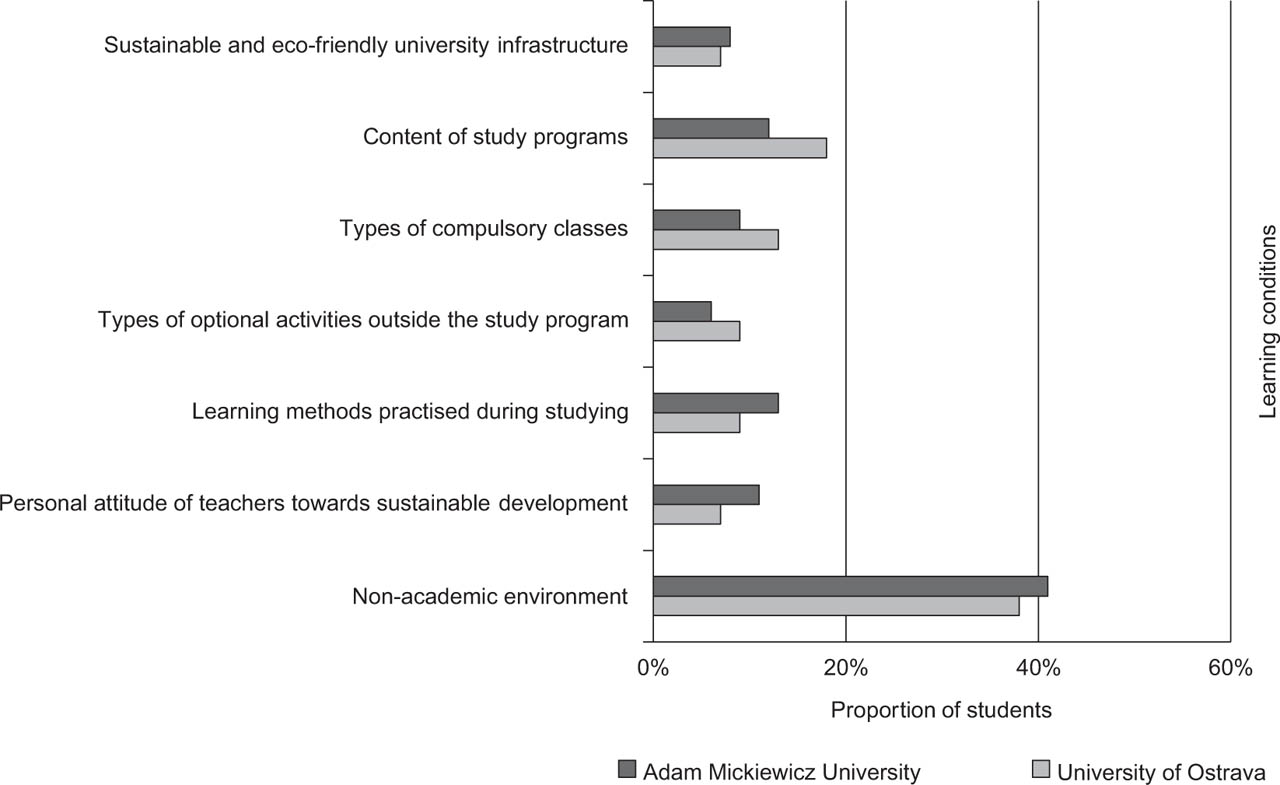
Fig. 1.
Importance of learning conditions for the development of envisioning sustainability futures (ESF) competencies, as perceived by students, categorised by university.
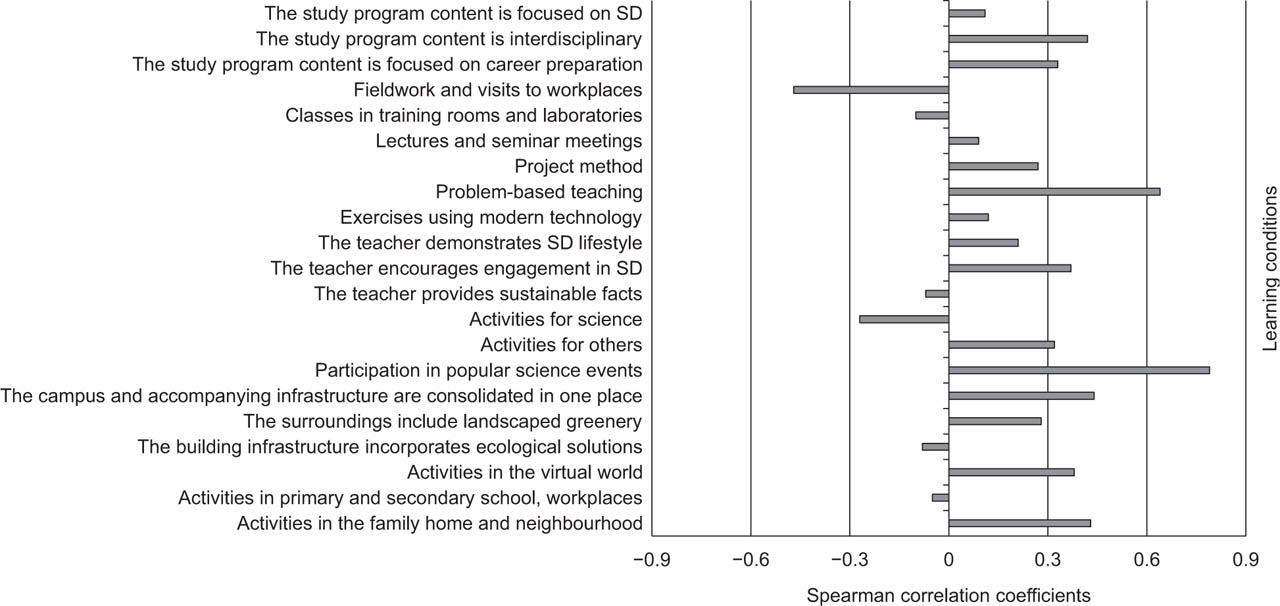
Fig. 2.
Spearman correlation coefficients between learning factors and ESF competence scores. Values between −0.3 and 0.3 indicate no correlation, while values between −0.6 and 0.6 indicate a moderate correlation between variables. As the sample was not randomly selected and participation was voluntary, results should be interpreted solely as illustrative findings within this dataset. The abbreviation SD shown here in the graph stands for sustainable development. A full description of the learning factors is provided in Table 2.
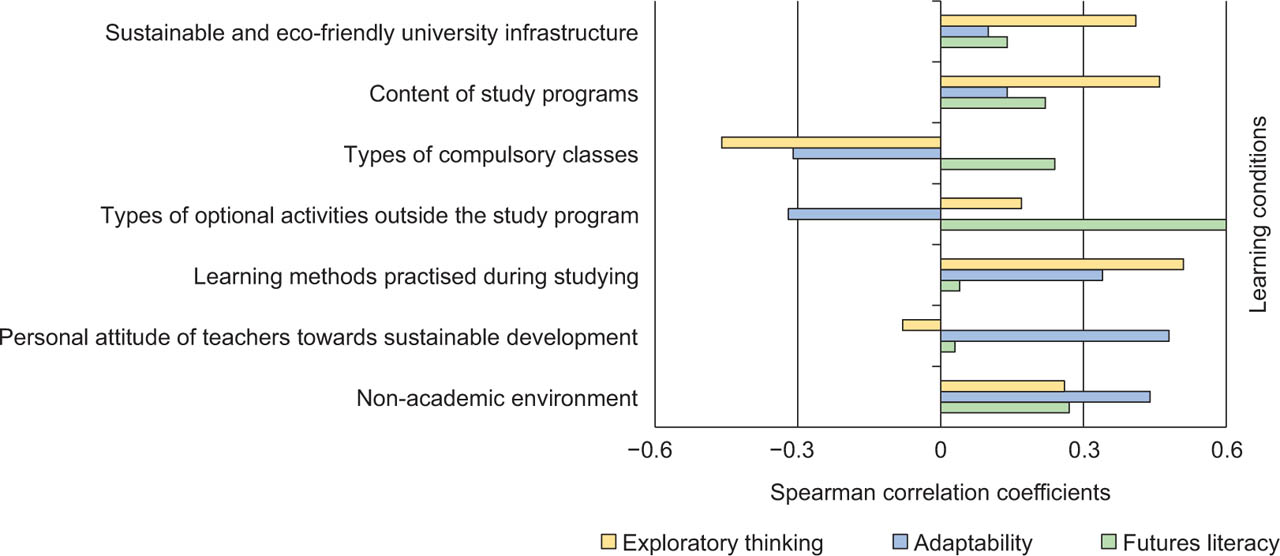
Fig. 3.
Spearman correlation coefficients between learning conditions and the scores of three ESF sub-competencies (exploratory thinking, adaptability and futures literacy) within the dataset. Values between −0.3 and 0.3 indicate no correlation, while values between −0.6 and 0.6 indicate a moderate correlation between variables. As the sample was not randomly selected and participation was voluntary, results should be interpreted solely as illustrative findings within this dataset.
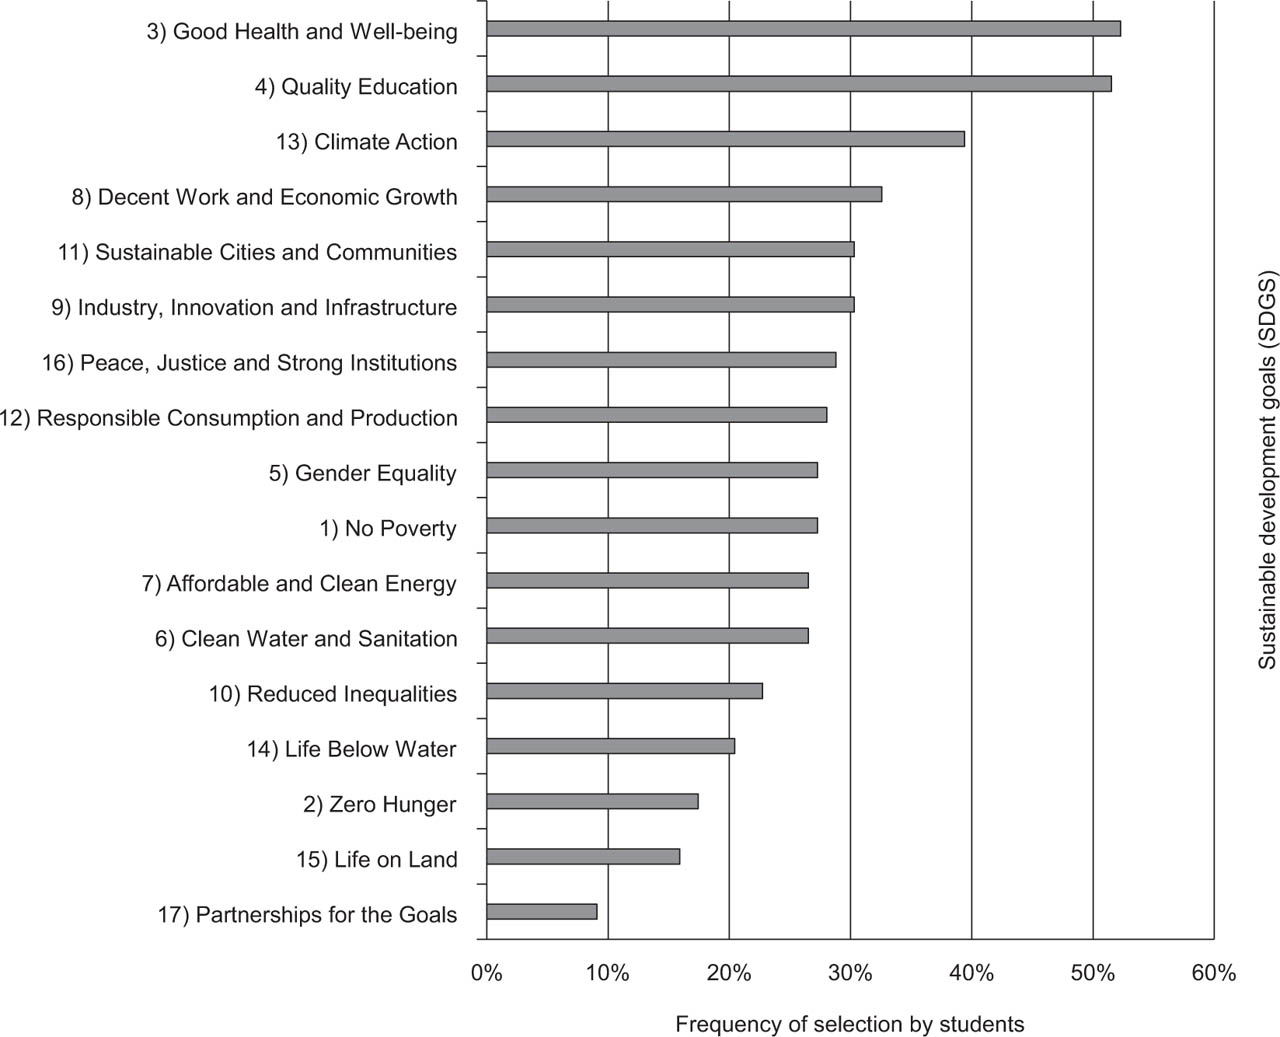
Fig. 4.
Frequency of SDGs selected by students as priorities for university promotion.
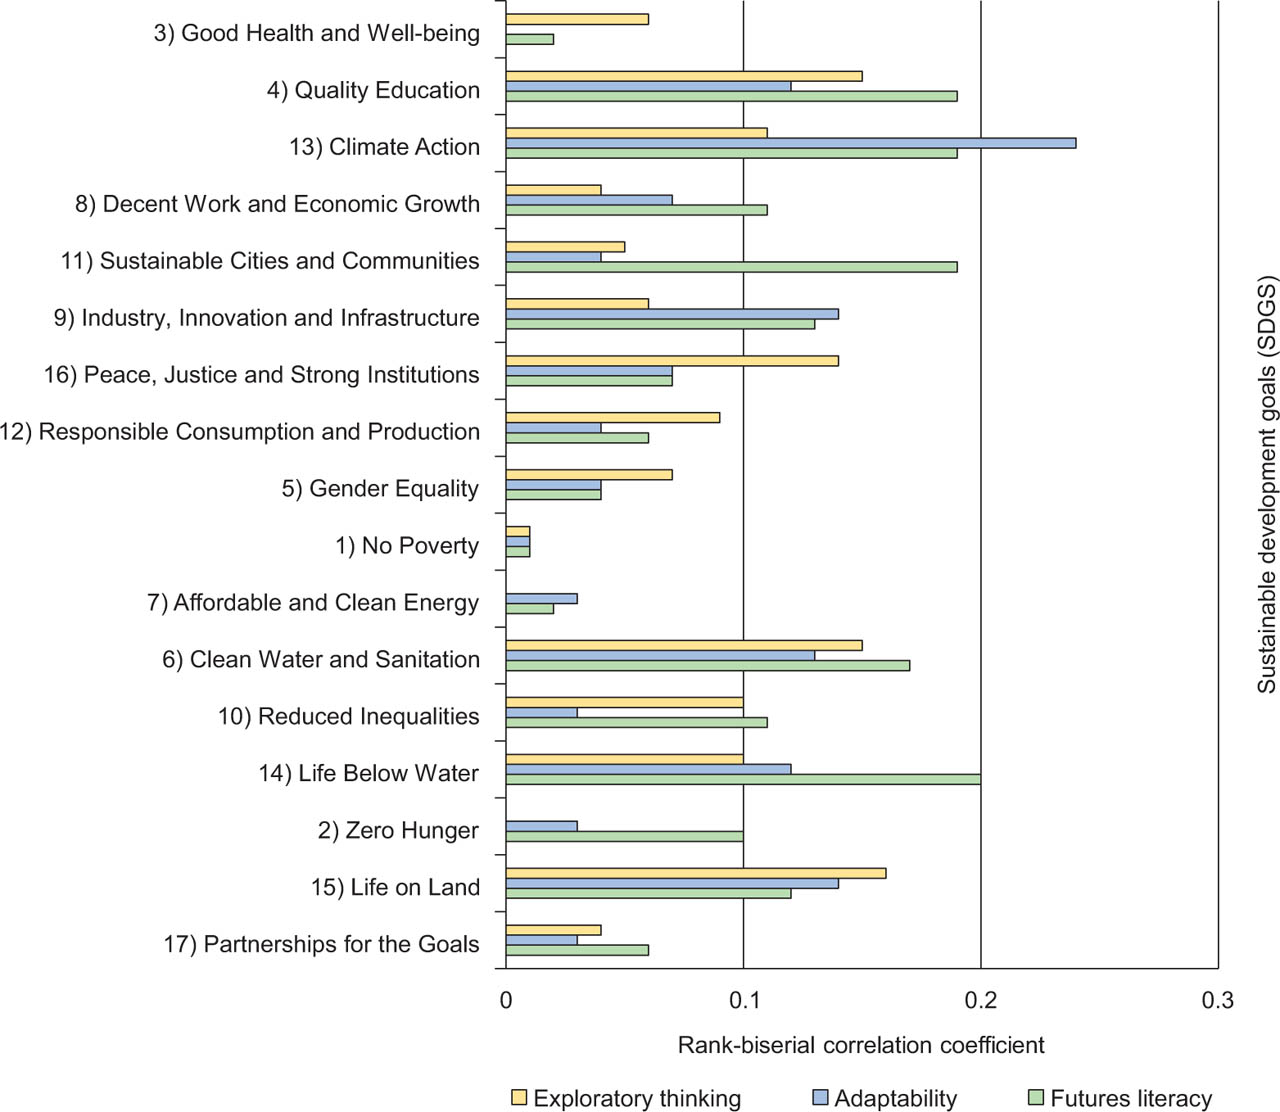
Fig. 5.
Rank-biserial correlation coefficients (rs) between the scores of three sub-competencies of envisioning sustainability futures and the selection of SDGs. As the sample was not randomly selected and participation was voluntary, results should be interpreted solely as illustrative findings within this dataset.