
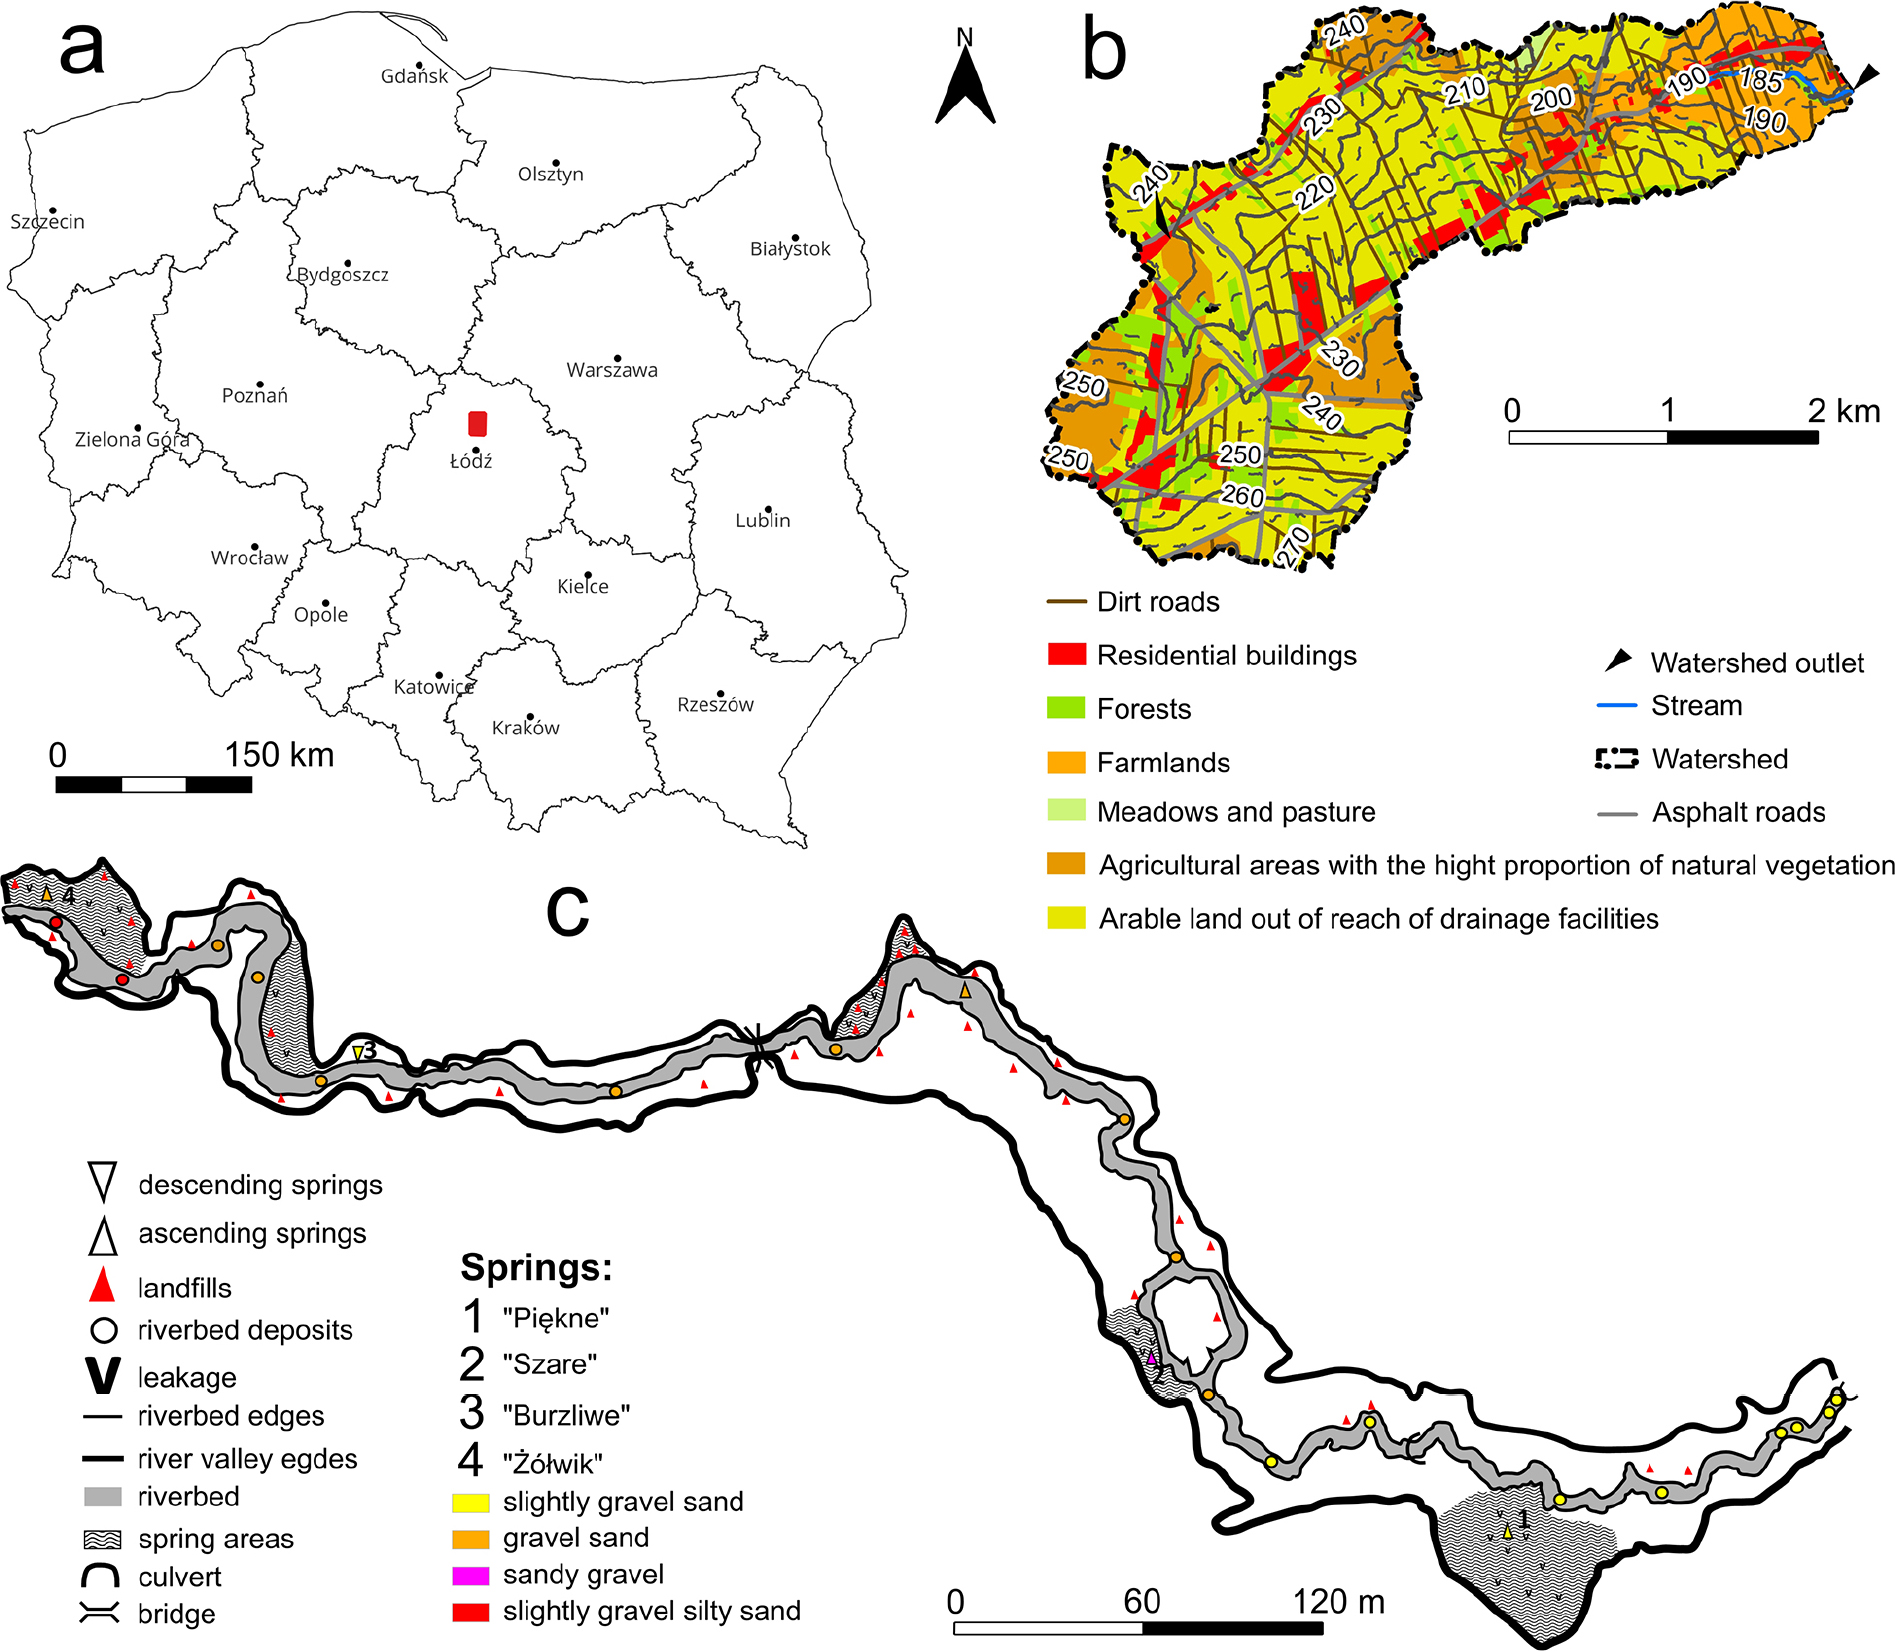
Fig. 1.
Land use map of the catchment area of the northern arm of the Struga Dobieszkowska watercourse: a – location of the catchment area in Poland; b – map of the entire catchment area; c – type of bottom sediments in the riverbed of the Struga Dobieszkowska.
Table 1.
Characteristics of the differential catchment area and the riverbed of the northern arm of the Struga Dobieszkowska stream.
| Drainage catchment | |||||||
|---|---|---|---|---|---|---|---|
| Feature | Circuit | Area | Slope | H max | H min | Length | Medium width |
| [km] | [km2] | [‰] | [m a.s.l.] | [km] | |||
| Value | 2.95 | 0.55 | 23.26 | 203.0 | 179.5 | 1.01 | 0.54 |
| Northern arm of the Struga Dobieszkowska | |||||||
| Feature | Lengtd | Slope | Riverbed widtd | Medium deptd | |||
| [km] | [‰] | [m] | [cm] | ||||
| Value | 0.86 | 5.35 | 1.5–4.0 | 14.5 | |||
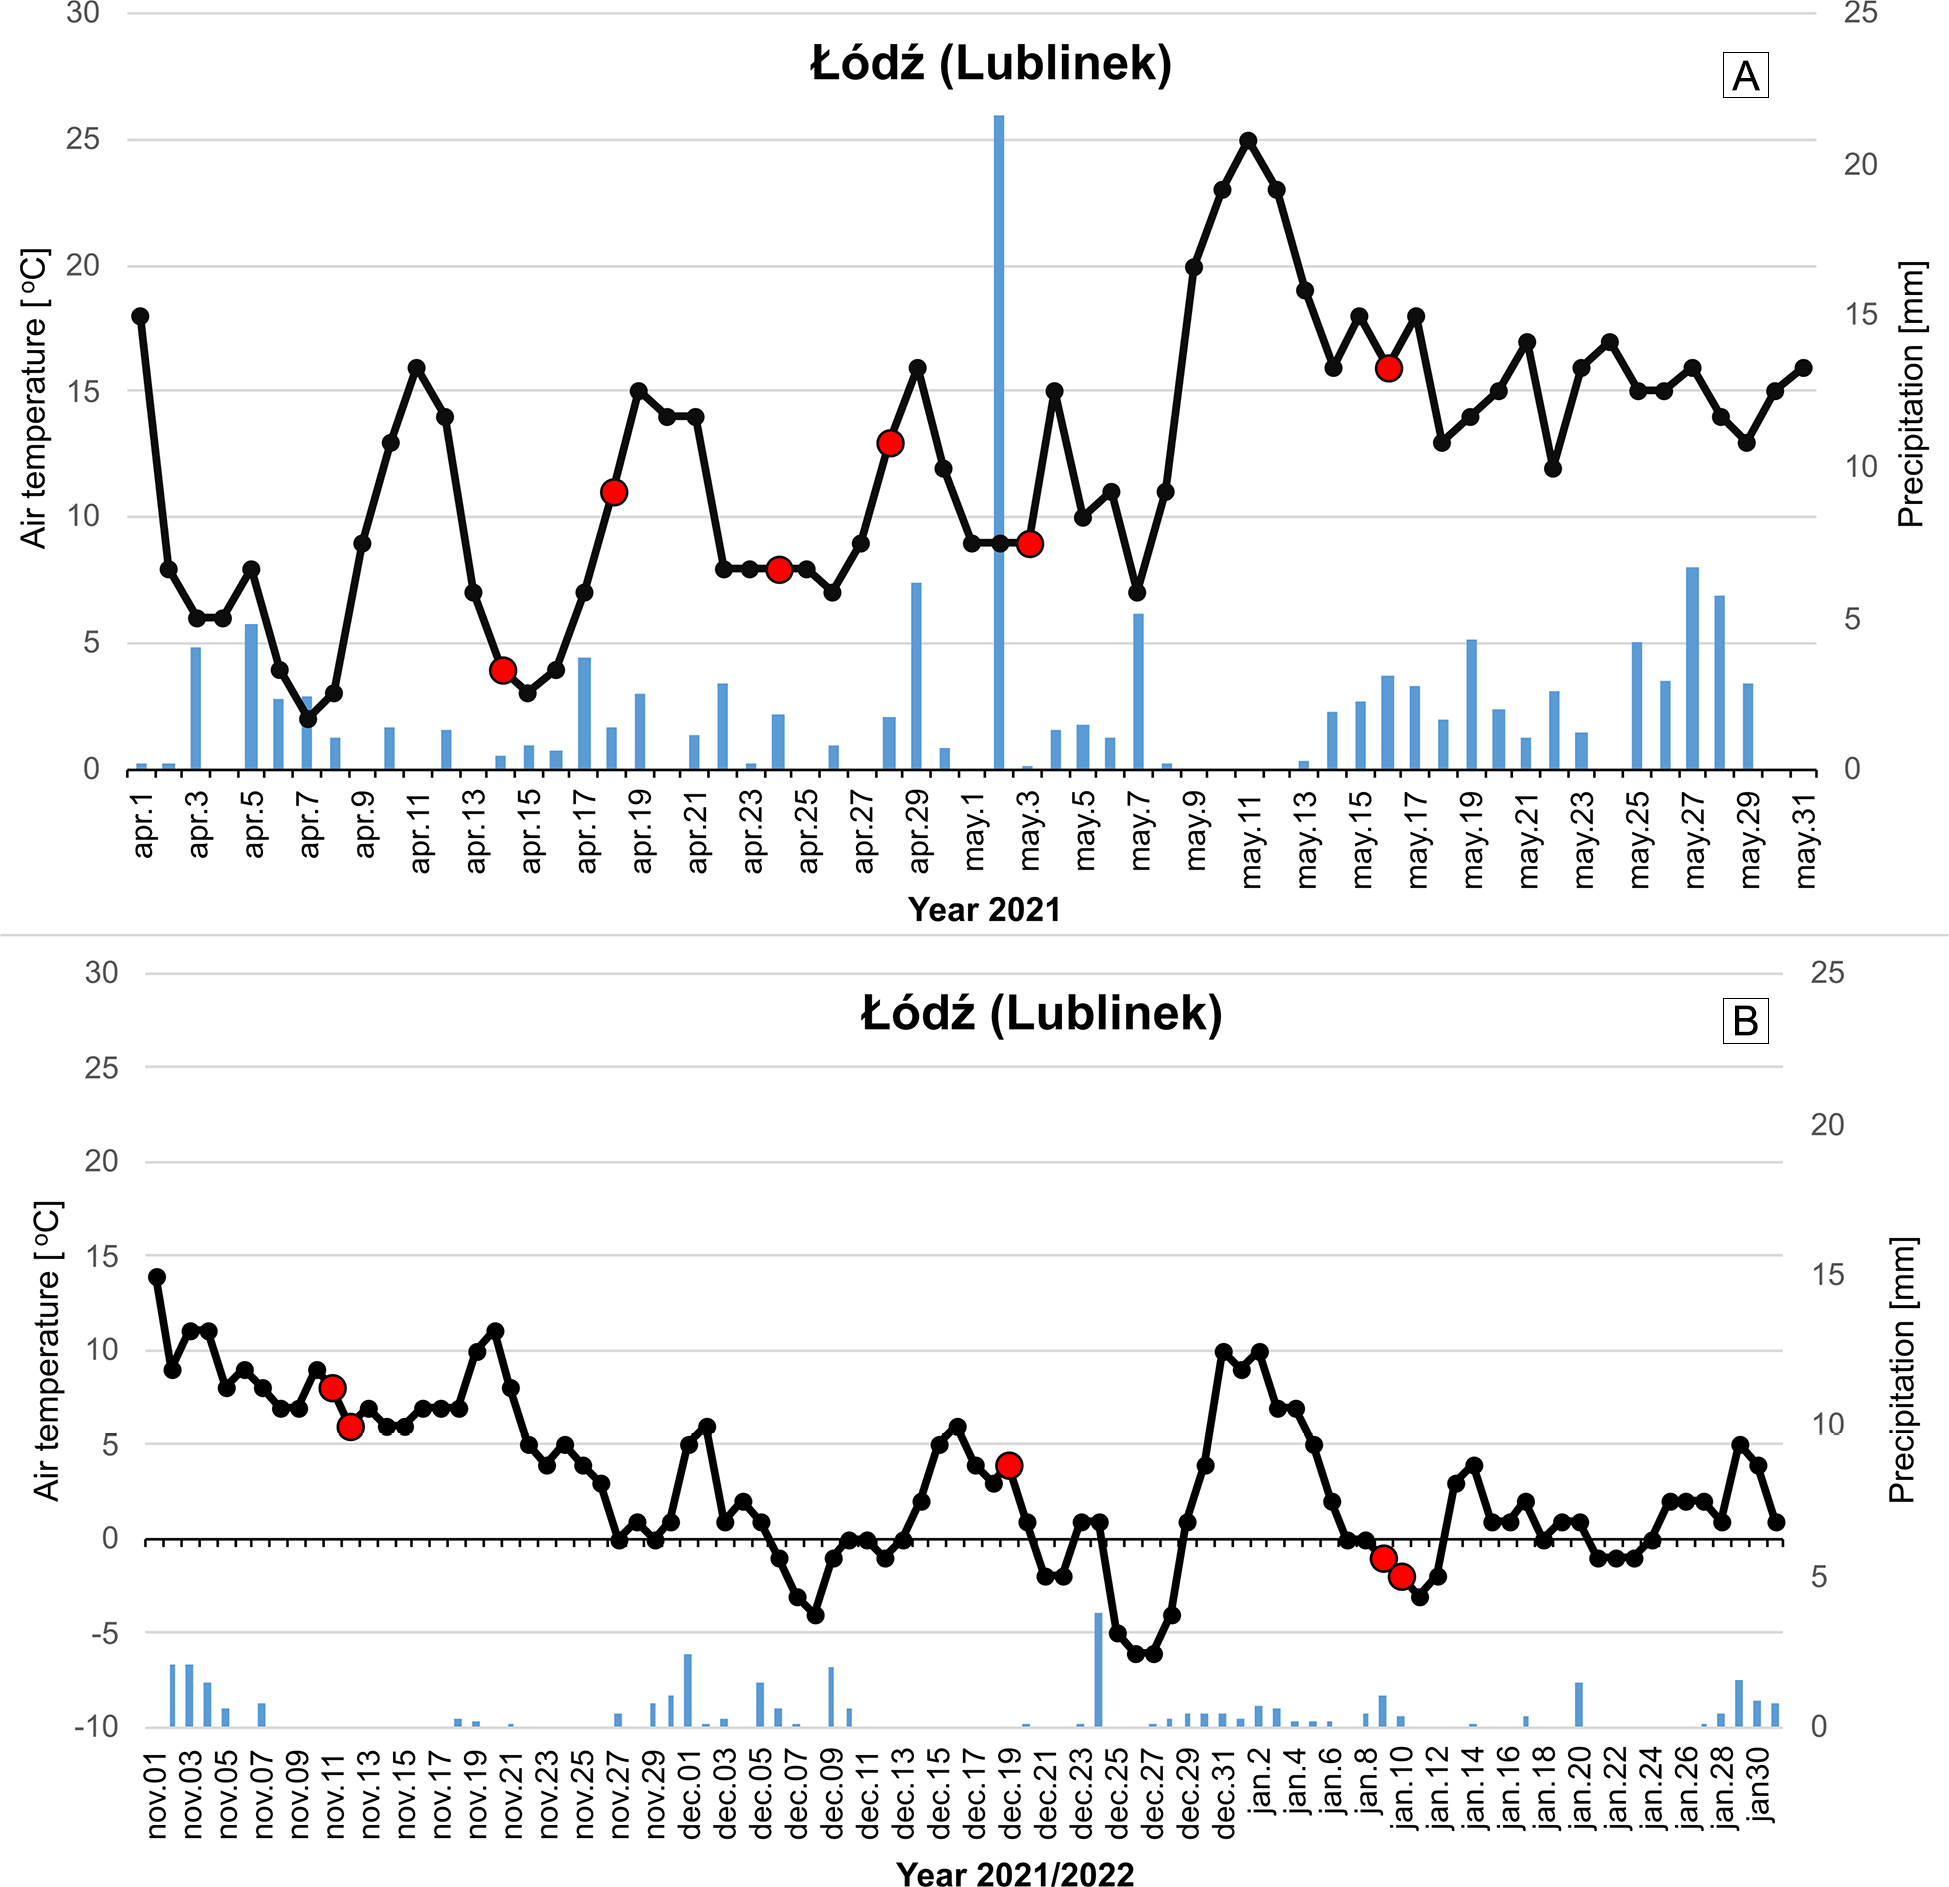
Fig. 2.
Air temperature and precipitation for the Łódź-Lublinek station during measurement cycles: A – spring cycle, B – autumn–winter cycle. Days of field measurements are marked with red dots.
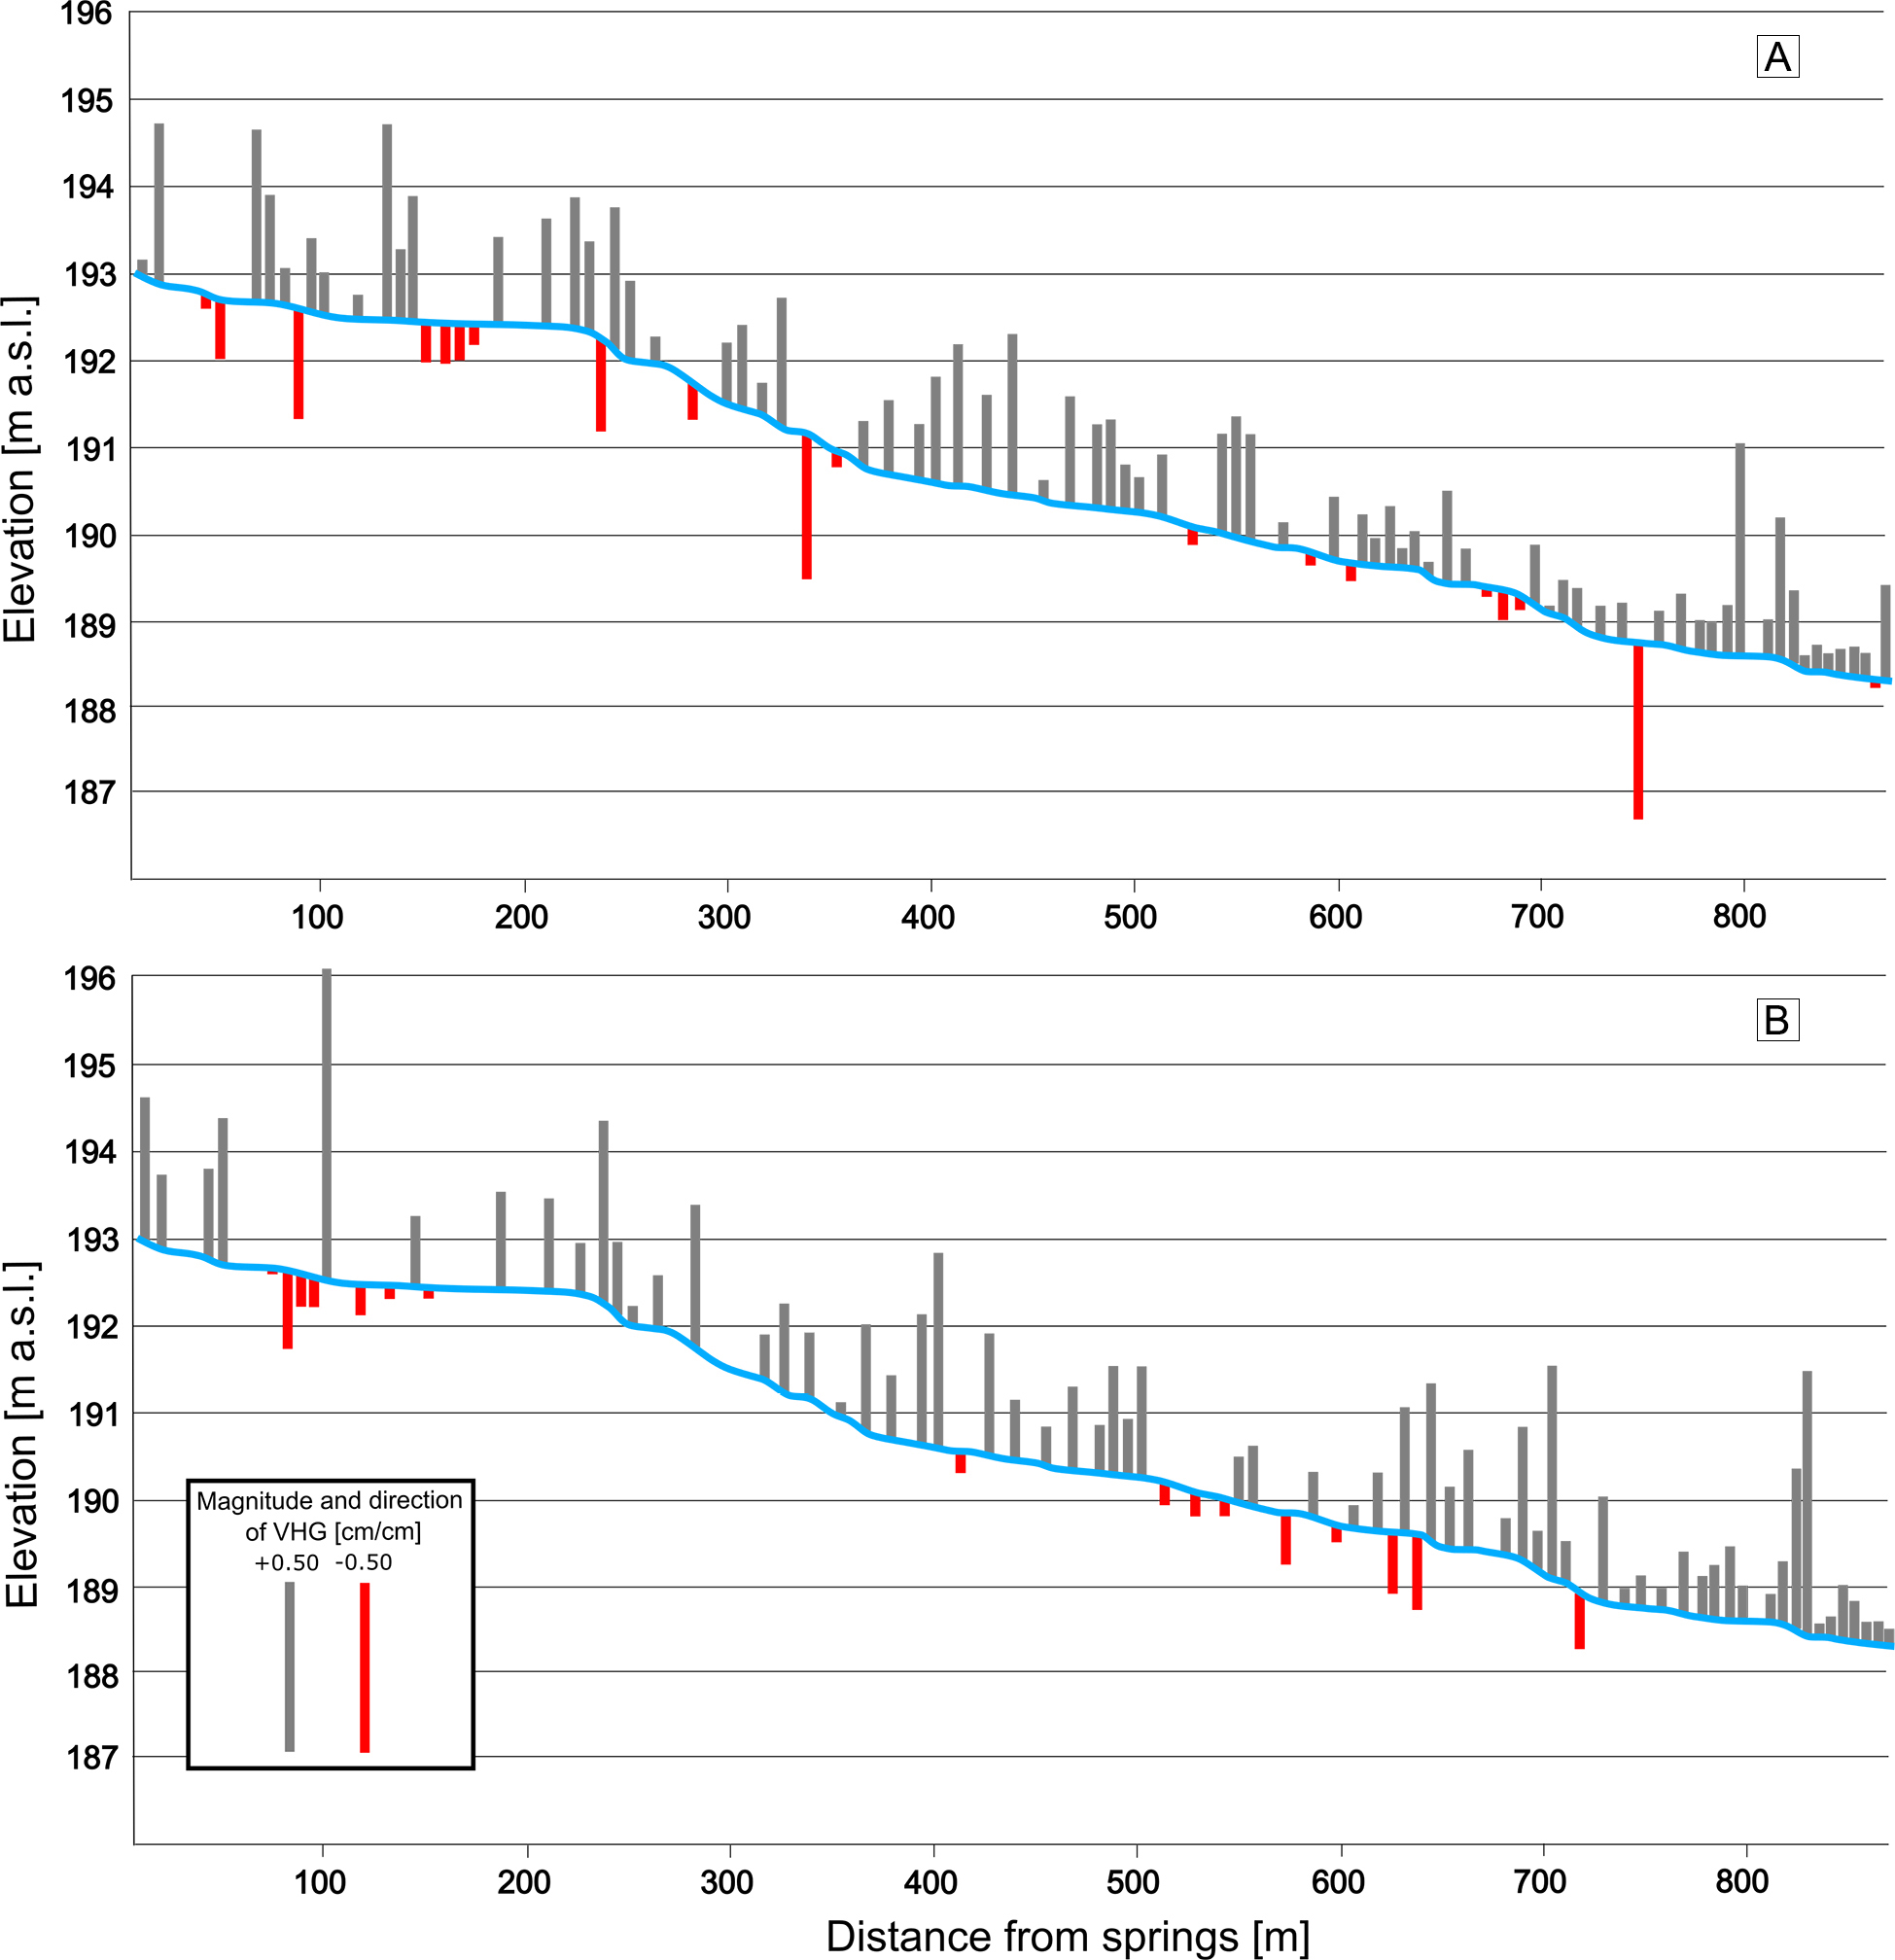
Fig. 3.
Magnitudes of hydraulic gradients in the riverbed of the northern arm of the Struga Dobieszkowska watercourse in the period: a – spring; b – autumn and winter.
Table 2.
Characteristics of the northern riverbed of Struga Dobieszkowska.
| Parameter | Spring | Autumn/winter | Average | |
|---|---|---|---|---|
| Discharge [dm3 · s−1] | 22.3 | 20.7 | 21.5 | |
| Reynolds number | Value | 7921 | 7761 | 7841 |
| flow type | turbulent | turbulent | turbulent | |
| HZ [%] | ||||
| Share of sections with HZ on the course of the riverbed at/n | 24.1/56 | 37.7/58 | 30.9 | |
| Share of river water in HZ zones at/n | 52.2/56 | 43.9/58 | 47.9 | |
| VHG [cm · cm−1] | ||||
| Minimum | –0.50 | –0.22 | –0.36 | |
| Maximum | +0.60 | +0.89 | +0.75 | |
| Average | +0.12 | +0.14 | +0.13 | |
| Frequency of phenomena [%] | ||||
| Share of points with downwelling | 20.9 | 17.6 | 19.3 | |
| Share of points with upwelling | 78.0 | 72.5 | 75.3 | |
| Share of points with pressure balance | 1.1 | 1.1 | 1.1 | |
| Share of inactive points | 0.0 | 8.8 | 4.4 | |
Table 3.
Characteristic values of physicochemical properties of river and hyporheic waters in measurement seasons.
| Spring season | |||||||
|---|---|---|---|---|---|---|---|
| Parameter | Unit | Hyporheic waters | River waters | ||||
| Average | Minimum | Maximum | Average | Minimum | Maximum | ||
| T | [°C] | 10.3 | 6.0 | 15.0 | 10.1 | 7.0 | 12.0 |
| pH* | [–] | 6.93 | 6.10 | 7.91 | 7.72 | 7.56 | 7.85 |
| SEC | [μS · cm−1] | 398 | 235 | 1108 | 416 | 396 | 462 |
| Eh | [mV] | +59 | –123 | +165 | – | – | – |
| Autumn/winter season | |||||||
| T | [°C] | 7.3 | 4.0 | 10.0 | 6.5 | 4.3 | 8.4 |
| pH* | [–] | 6.83 | 6.05 | 8.25 | 6.91 | 6.33 | 8.27 |
| SEC | [μS · cm−1] | 364 | 245 | 660 | 398 | 350 | 427 |
| Eh | [mV] | +42 | –222 | +178 | 94 | 57 | 153 |
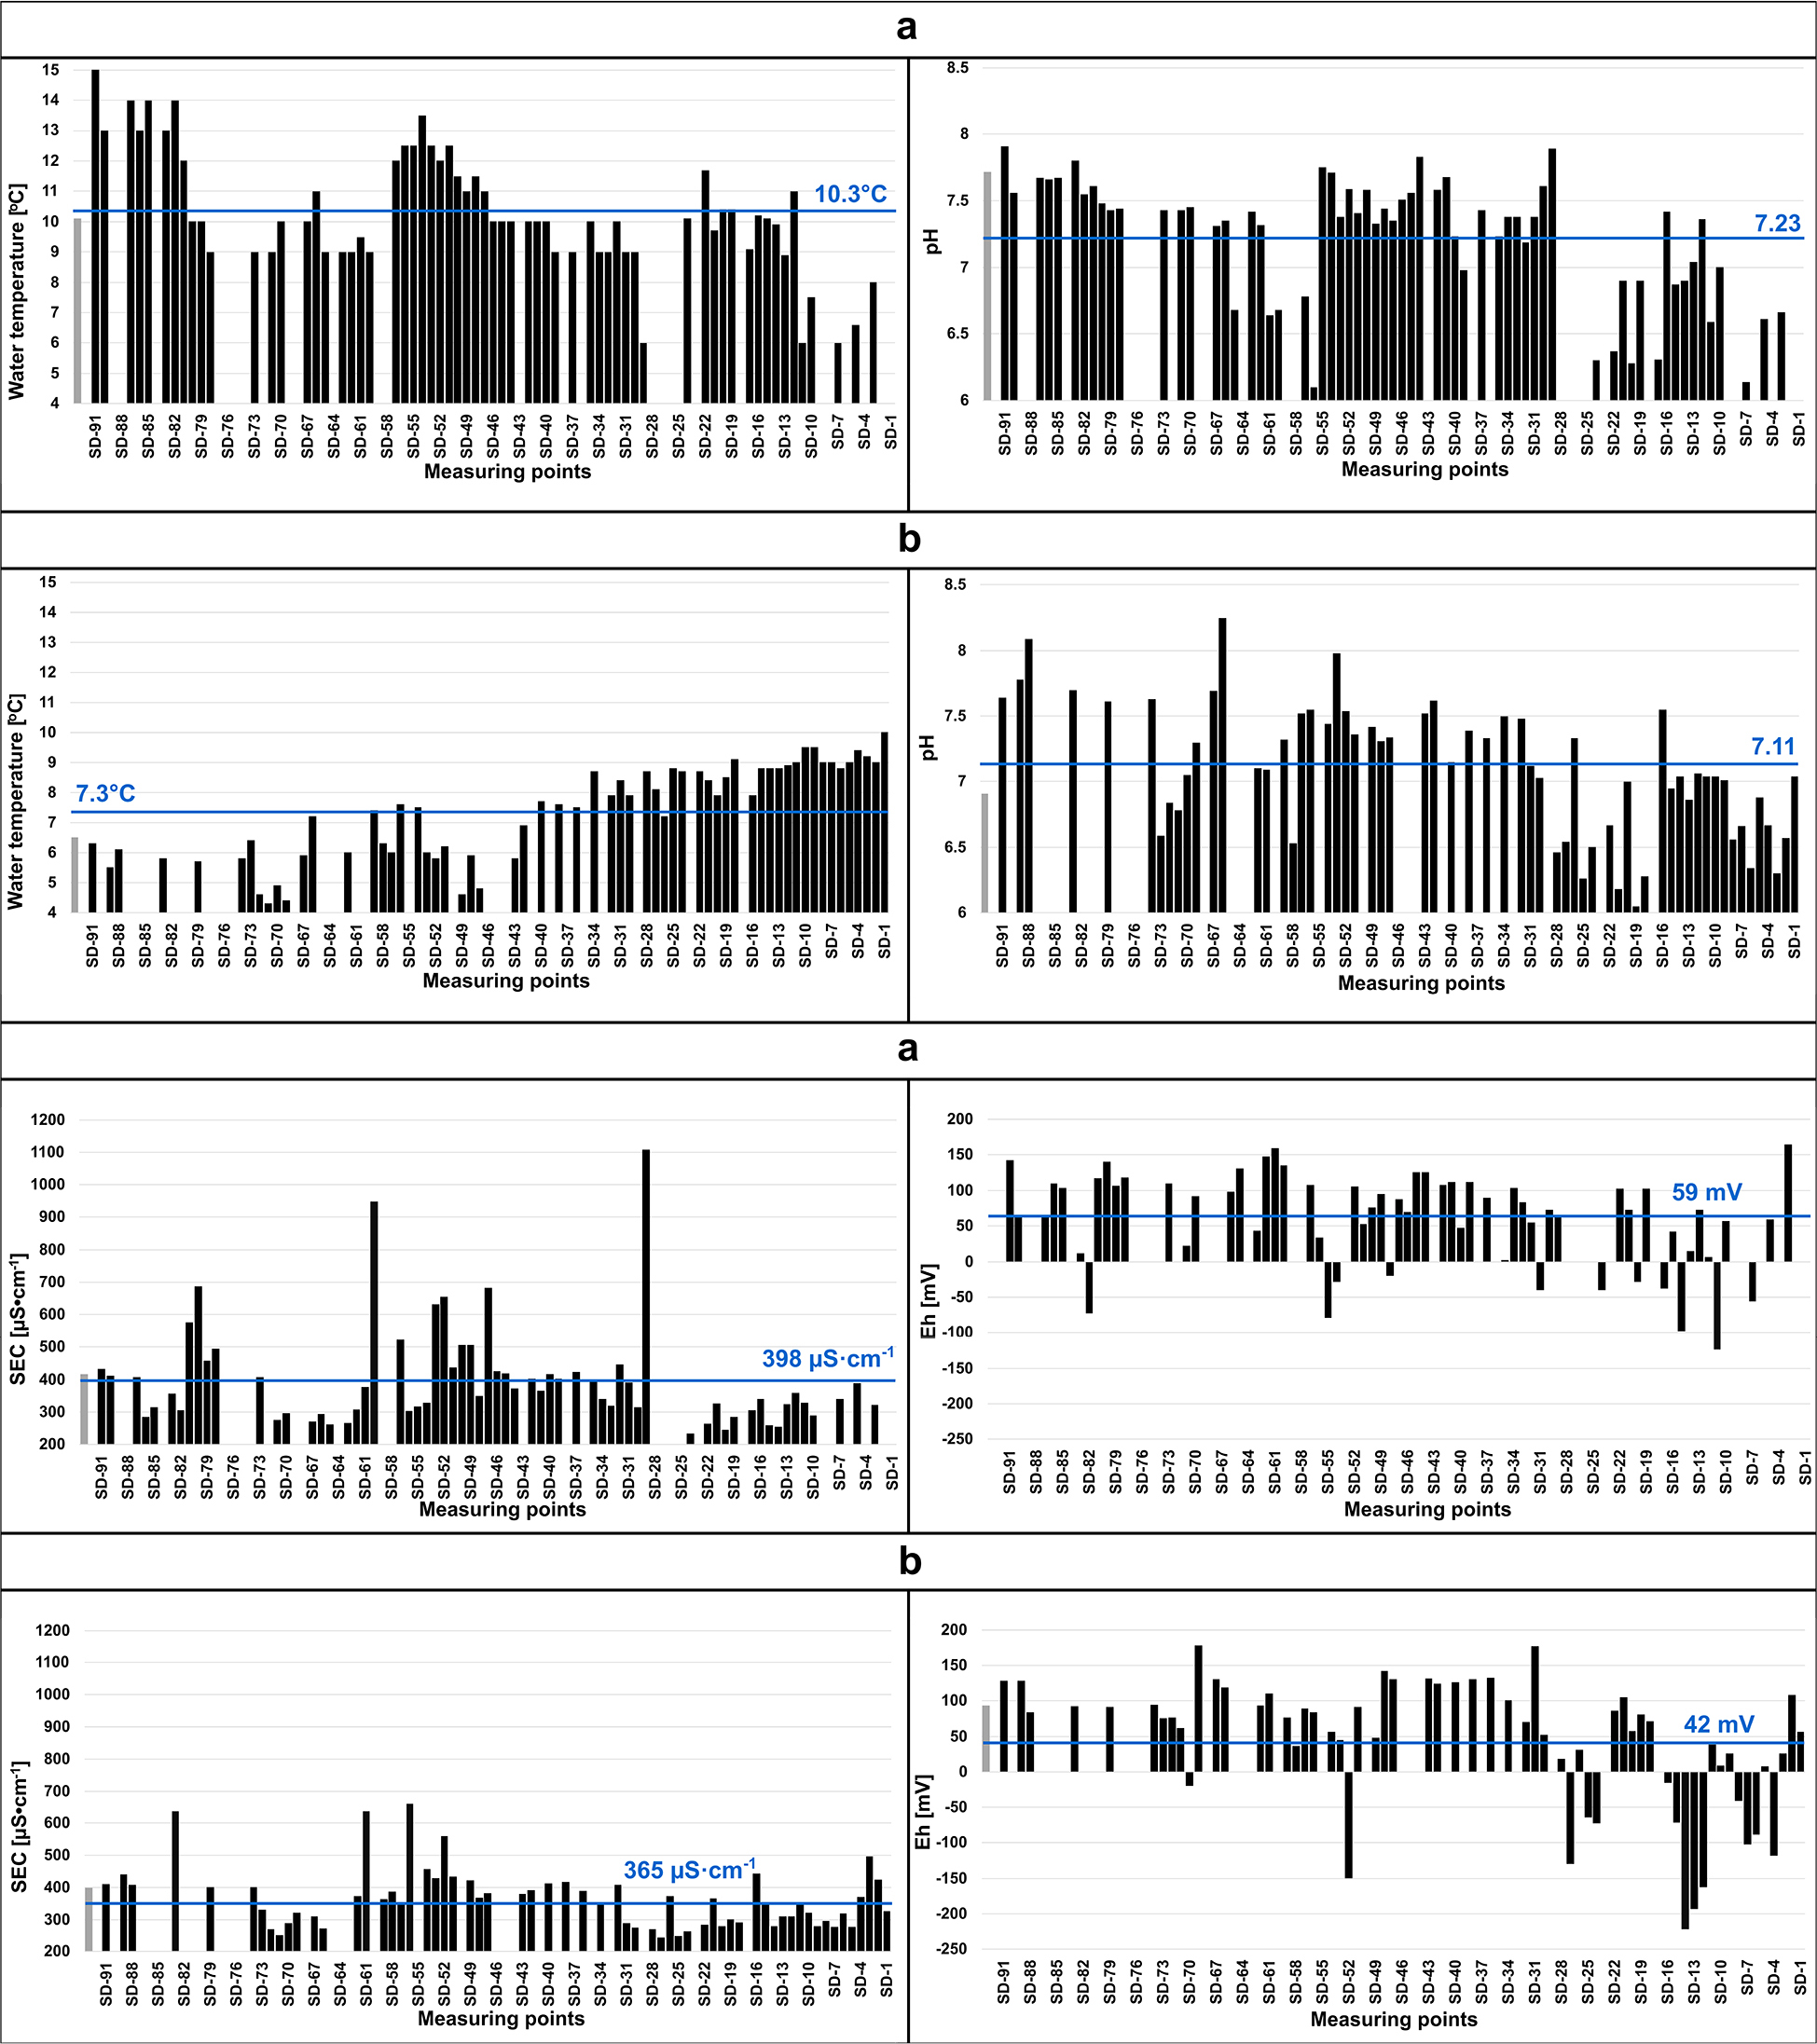
Fig. 4.
Changes in temperature, pH, SEC, and Eh of hyporheic waters along the riverbed: a – in the spring period; b – in the autumn–winter period. Black colour indicates results for hyporheic waters; gray colour – average for river waters; blue colour – average value of physico-chemical parameters for a given period in hyporheic waters.
Table 4.
Characteristic values of nutrient concentrations in the river and hyporheic waters.
| Spring season | |||||||
|---|---|---|---|---|---|---|---|
| Ion [mg · dm−3] | Hyporheic waters | River waters | |||||
| Average | Minimum | Maximum | No ion at measurement at/n | Average | Minimum | Maximum | |
| NH4+ | 0.056 | 0.000 | 1.720 | 40/56 | 0.050 | 0.000 | 0.193 |
| NO2– | 0.046 | 0.021 | 0.106 | 0/56 | 0.265 | 0.062 | 0.830 |
| NO3– | 14.713 | 0.000 | 72.100 | 11/56 | 28.850 | 23.800 | 34.300 |
| PO4−3 | 0.392 | 0.094 | 0.813 | 0/56 | 0.391 | 0.334 | 0.455 |
| Autumn/winter season | |||||||
| NH4+ | 0.086 | 0.000 | 1.090 | 18/56 | 0.032 | 0.000 | 0.080 |
| NO2– | 0.060 | 0.007 | 0.278 | 0/56 | 0.095 | 0.070 | 0.120 |
| NO3– | 16.976 | 0.000 | 68.200 | 5/56 | 30.425 | 26.100 | 35.000 |
| PO4−3 | 0.279 | 0.045 | 0.630 | 0/56 | 0.357 | 0.296 | 0.391 |
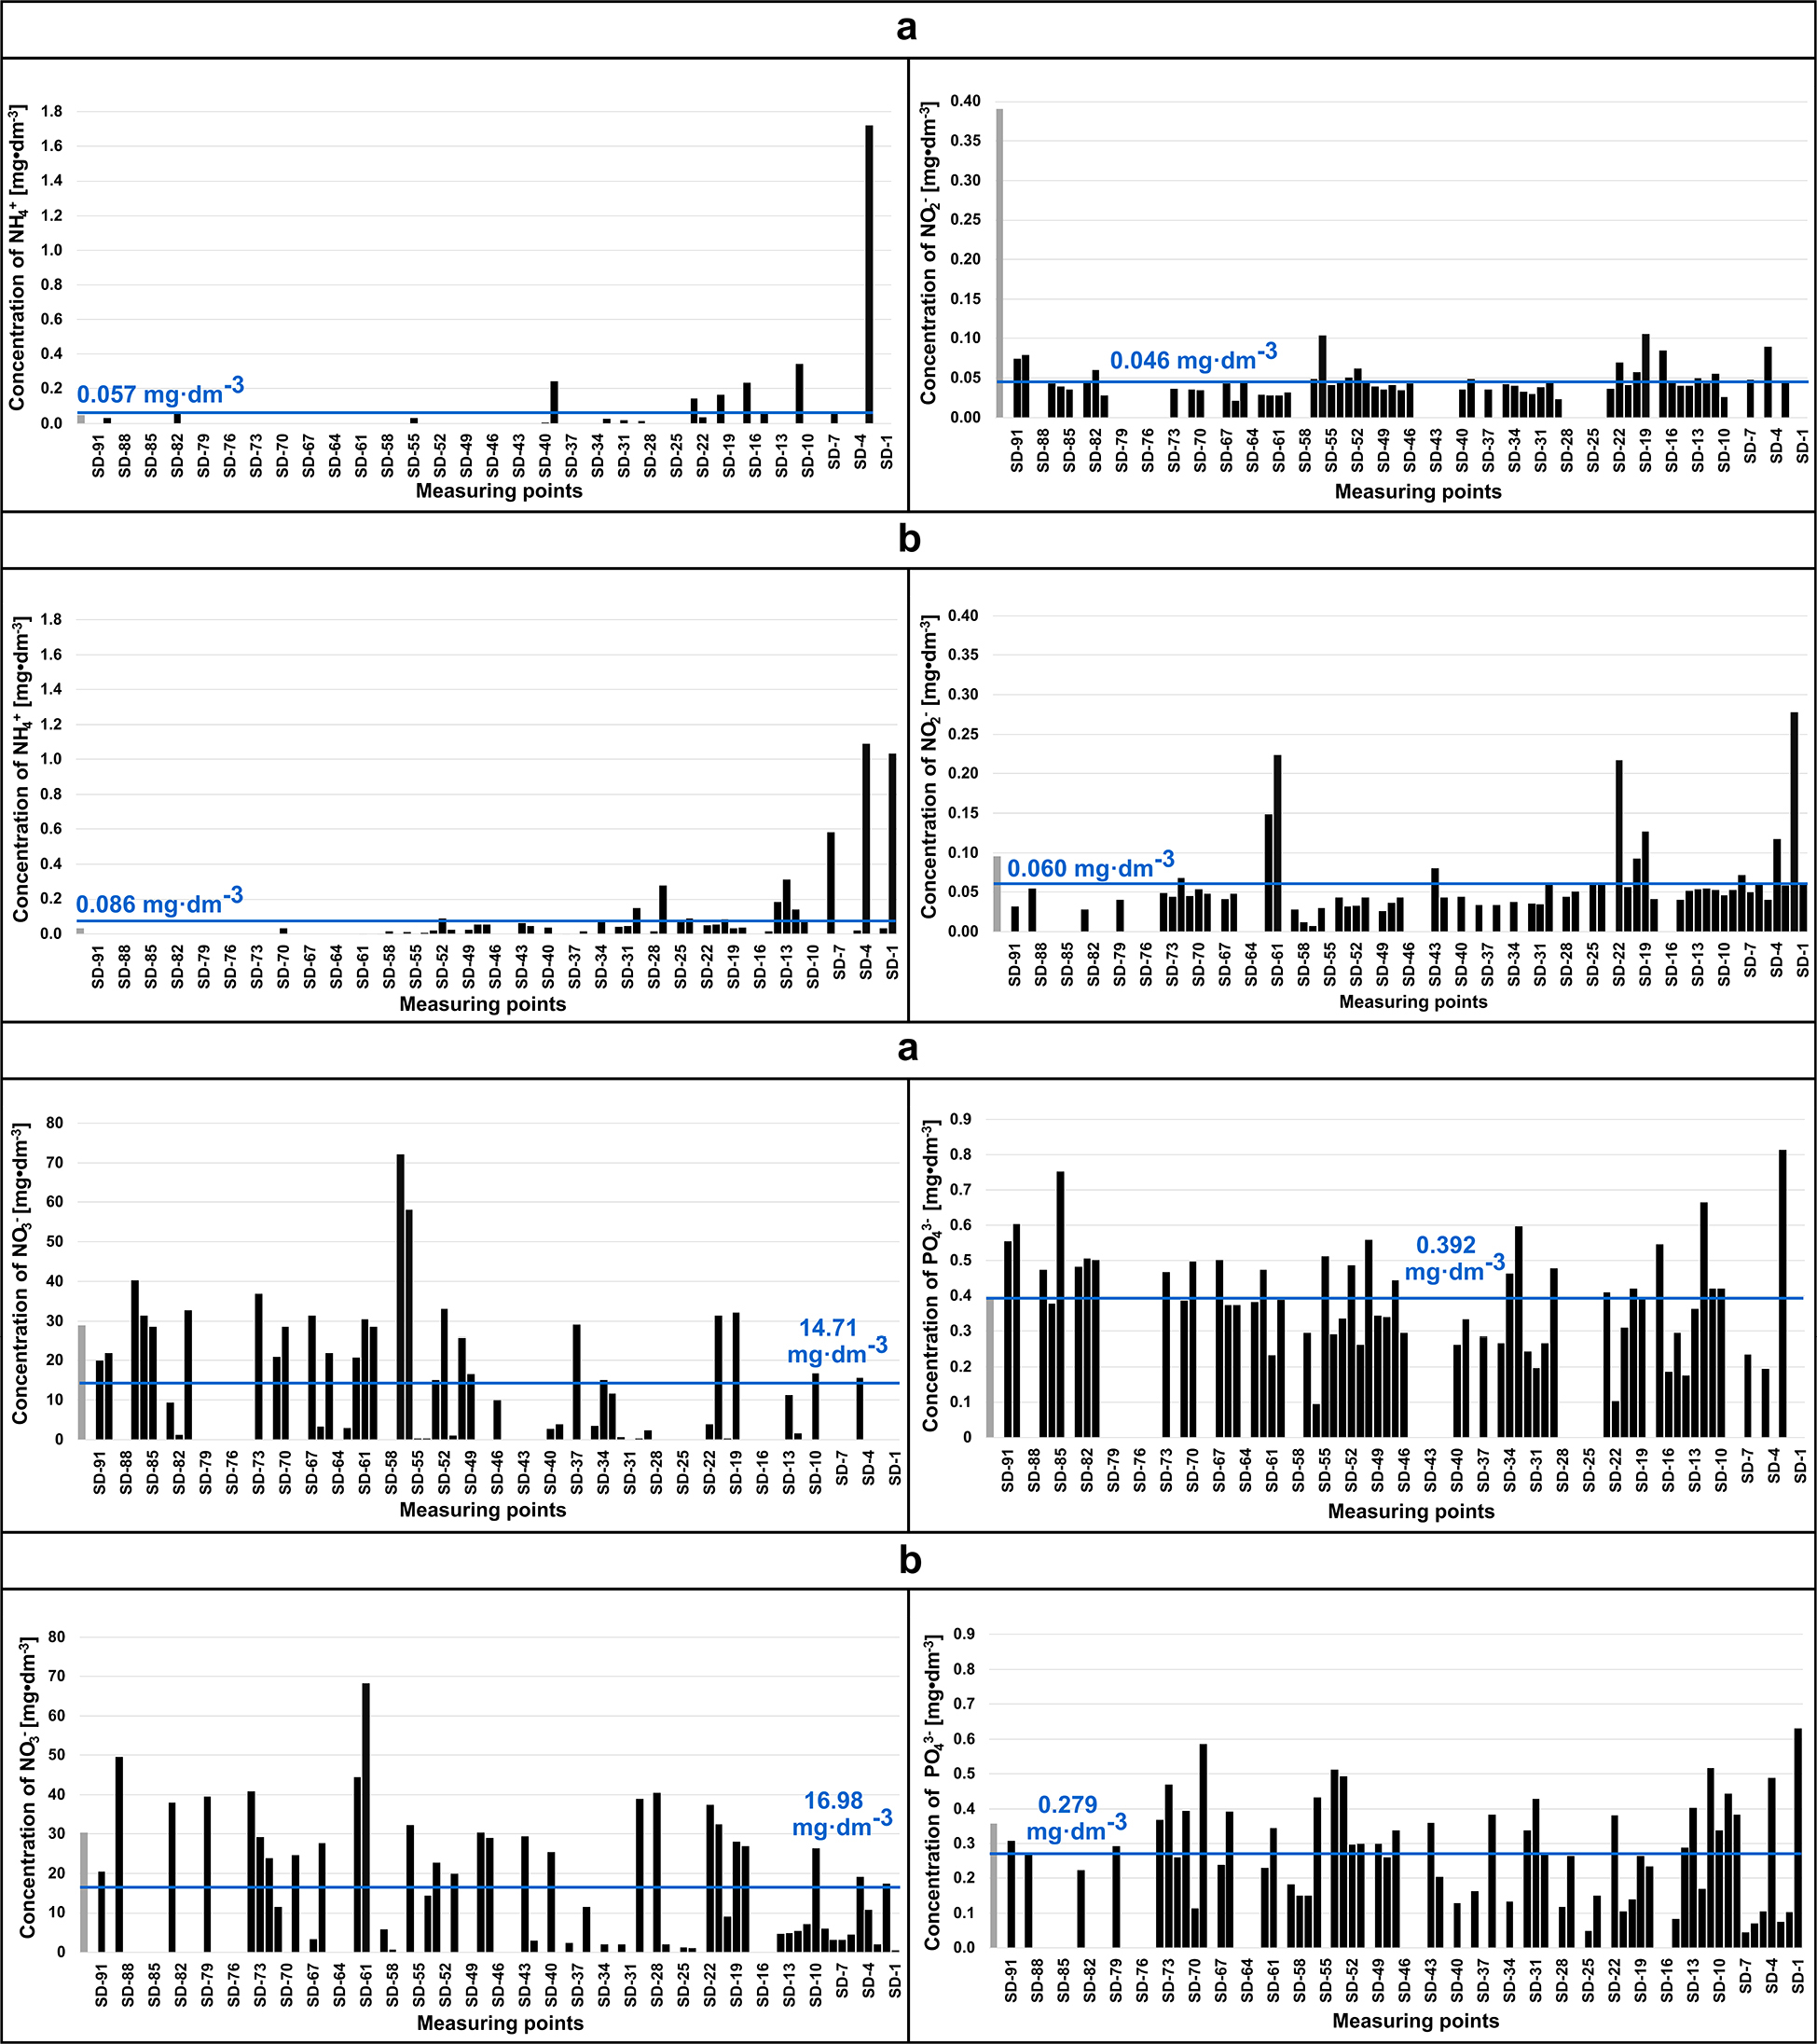
Fig. 5.
Variability of concentrations of ammonium ion, nitrate, nitrite, mineral nitrogen, and orthophosphate in hyporheic waters along the riverbed: a – in the spring period; b – in the autumn- winter period. Black colour indicates results for hyporheic waters; gray colour – average for river waters; blue colour – average ion concentration for a given period in hyporheic waters.
Table 5.
Values of physicochemical properties and concentrations of nutrients at groundwater outfalls and in their immediate vicinity during the autumn-winter period.
| Parameter | Unit | Żółwik spring | Burzliwe spring | Szare spring | Piękne spring | |||||||||||
|---|---|---|---|---|---|---|---|---|---|---|---|---|---|---|---|---|
| Water temp. | [°C] | 7.6 | 8.8 | 8.6 | 9.2 | |||||||||||
| 6.3 | 5.5 | 4.4 | 5.9 | 7.2 | 7.5 | 8.7 | 7.9 | 8.4 | 7.9 | 9.1 | 8.8 | 8.8 | 8.8 | 8.9 | ||
| pH | [–] | 8.09 | 7.43 | 7.12 | 7.54 | |||||||||||
| 7.64 | 7.78 | 7.3 | 7.69 | 8.25 | 7.33 | 7.50 | 7.48 | 7.12 | 7.03 | 6.28 | 6.95 | 7.04 | 6.86 | 7.06 | ||
| SEC | [μS · cm−1] | 409 | 428 | 293 | 333 | |||||||||||
| 410 | 441 | 321 | 310 | 272 | 389 | 350 | 408 | 288 | 275 | 290 | 352 | 279 | 309 | 310 | ||
| Eh | [mV] | 84 | -121 | 15 | 72 | |||||||||||
| 128 | 128 | 178 | 131 | 119 | 133 | 101 | 70 | 177 | 52 | 71 | -72 | -222 | -193 | -163 | ||
| NO3– | [mg · dm−3] | 53.5 | 30.9 | 27.7 | 29.600 | |||||||||||
| 20.5 | 49.5 | 24.6 | 3.3 | 27.6 | 11.5 | 2.1 | 2.0 | 0.0 | 38.9 | 26.9 | 0.0 | 4.7 | 4.9 | 5.5 | ||
| NO2– | 0.05 | 0.107 | 0.115 | 0.044 | ||||||||||||
| 0.03 | 0.05 | 0.05 | 0.04 | 0.05 | 0.03 | 0.04 | 0.04 | 0.04 | 0.06 | 0.04 | 0.04 | 0.05 | 0.05 | 0.06 | ||
| NH4+ | 0.0 | 0.0 | 0.04 | 0.01 | ||||||||||||
| 0.0 | 0.0 | 0.0 | 0.0 | 0.0 | 0.02 | 0.07 | 0.04 | 0.05 | 0.15 | 0.04 | 0.02 | 0.2 | 0.1 | 0.1 | ||
| PO4−3 | 0.3 | 0.34 | 0.34 | 0.34 | ||||||||||||
| 0.3 | 0.3 | 0.6 | 0.2 | 0.4 | 0.4 | 0.1 | 0.3 | 0.4 | 0.3 | 0.2 | 0.1 | 0.3 | 0.4 | 0.2 | ||
| Point | [-] | SD-91 | SD-89 | SD-69 | SD-67 | SD-66 | SD-36 | SD-34 | SD-32 | SD-31 | SD-30 | SD-18 | SD-15 | SD-14 | SD-13 | SD-12 |