
Introduction
The hyporheic zone (HZ) is defined as the space contained beneath the bottoms of lakes, streams, and spring niches, where surface water and groundwater mix (Krause et al. 2022). Hyporheic flow is the transport of surface water through bottom sediments, which returns to the riverbed at a later stage of flow (Bencala et al. 2011). This flow usually lasts longer than the time of water flow in the riverbed (Boano et al. 2014). Model and field studies indicate that the retention time of river water in riverbed sediments can range from a few minutes to several hours (Harvey et al. 2019), depending on the nature of the river flow, the fraction and forms of riverbed sediments (Saenger et al. 2005), the degree of connectivity of the two aquatic environments (Harvey et al. 2019), and the amount of groundwater recharge (Hester, Doyle 2008). The efficiency of water exchange in the HZ is influenced by hydrostatic (i.e., groundwater elevation and hydrostatic pressure) and hydrodynamic (i.e., the riverbed velocity and local pressure increase caused by turbulent flow) factors (Boano et al. 2014). The formation of the HZ beneath the riverbed is favoured by bedding deposits of crumbly sedimentary rocks (Marciniak et al. 2017). The HZ has important functions, including filtration, contributing to the removal of pollutants from surface water (Duff, Triska 1990). In areas subjected to intense economic and settlement pressures, the purification potential of the HZ may be suppressed (Oswald et al. 2023).
This study aimed to determine the spatial variability of hydrochemical conditions in the hyporheic zone of a spring watercourse in the suburban area of Łódź city, under significant settlement pressure. The research focused on identifying how the concentrations of biogenic compounds (NH4+, NO2–, NO3–, PO43-) and redox conditions change along the flow path beneath the streambed.
The spring watercourse was chosen for the study because of the expected high positive hydraulic gradients in the riverbed, conditions that indicate inflow of water from below its bed and, with it, potential contaminants. The investigated watercourse also provides an opportunity to conduct studies on natural groundwater outflows in its riverbed springs, which accompany the watercourse bed along its entire length, allowing for a direct representation of groundwater drainage in the valley. The juxtaposition of the results of hydrochemical studies of spring and hyporheic waters will help indicate which environment is more sensitive to pollution and can be a targeted subject of monitoring to effectively identify threats to surface water quality. The northern arm of the Struga Dobieszkowska (NSD) stream flows through the most deeply cut valley of the Łódź Hills, which is a highly polluted tributary of the upper Moszczenica River (Ziułkiewicz 2012, Ziułkiewicz et al. 2023). The river waters of the NSD, after connecting with the southern arm, flow from various spring zones into the Stryków Reservoir, built on the Moszczenica River in the city of Stryków. Increased occurrence of cyanobacteria has been reported in this reservoir (Nowicka-Krawczyk et al. 2022).
Study area
The catchment area of the NSD is located in the Łódź province, along the borders of the municipalities of Stryków, Nowosolna and the city of Łódź. The initial springs of the NSD are situated near the village of Stary Imielnik, at an ordinate of 186–185 m above sea level (Fig. 1). This ordinate corresponds to the most represented hypsometric interval of spring occurrences in central Poland (Maksymiuk, Mela 1995). The NSD sub-catchment is characterized by low surface runoff relative to its total area (7.5 km2). The unit outflow for this catchment is 2.87 dm3 · s−1 · km−2. In comparison, the q for the entire Struga Dobieszkowska (SD) catchment in 2003–2004 was 6.60 dm3 · s−1 · km−2 (Jokiel, Tomalski 2005). Notably, the zero runoff in the entire catchment area is 92.5% (Fig. 1). Given that the study area encompasses the valley between the initial springs and the point of connection with the southern arm of the Struga Dobieszkowska, a topographic catchment was determined, the characteristics of which are shown in Table 1. The NSD is a fifth-order watercourse. Along its course, there are many manifestations of groundwater outflows, including the largest springs: “Żółwik”, “Burzliwe”, “Szare”1 and “Piękne” (Fig. 1c). According to data collected from 1997 to 2003, the average discharge from all NSD springs is 20.1 dm3 · s−1 (Walisch 2003).
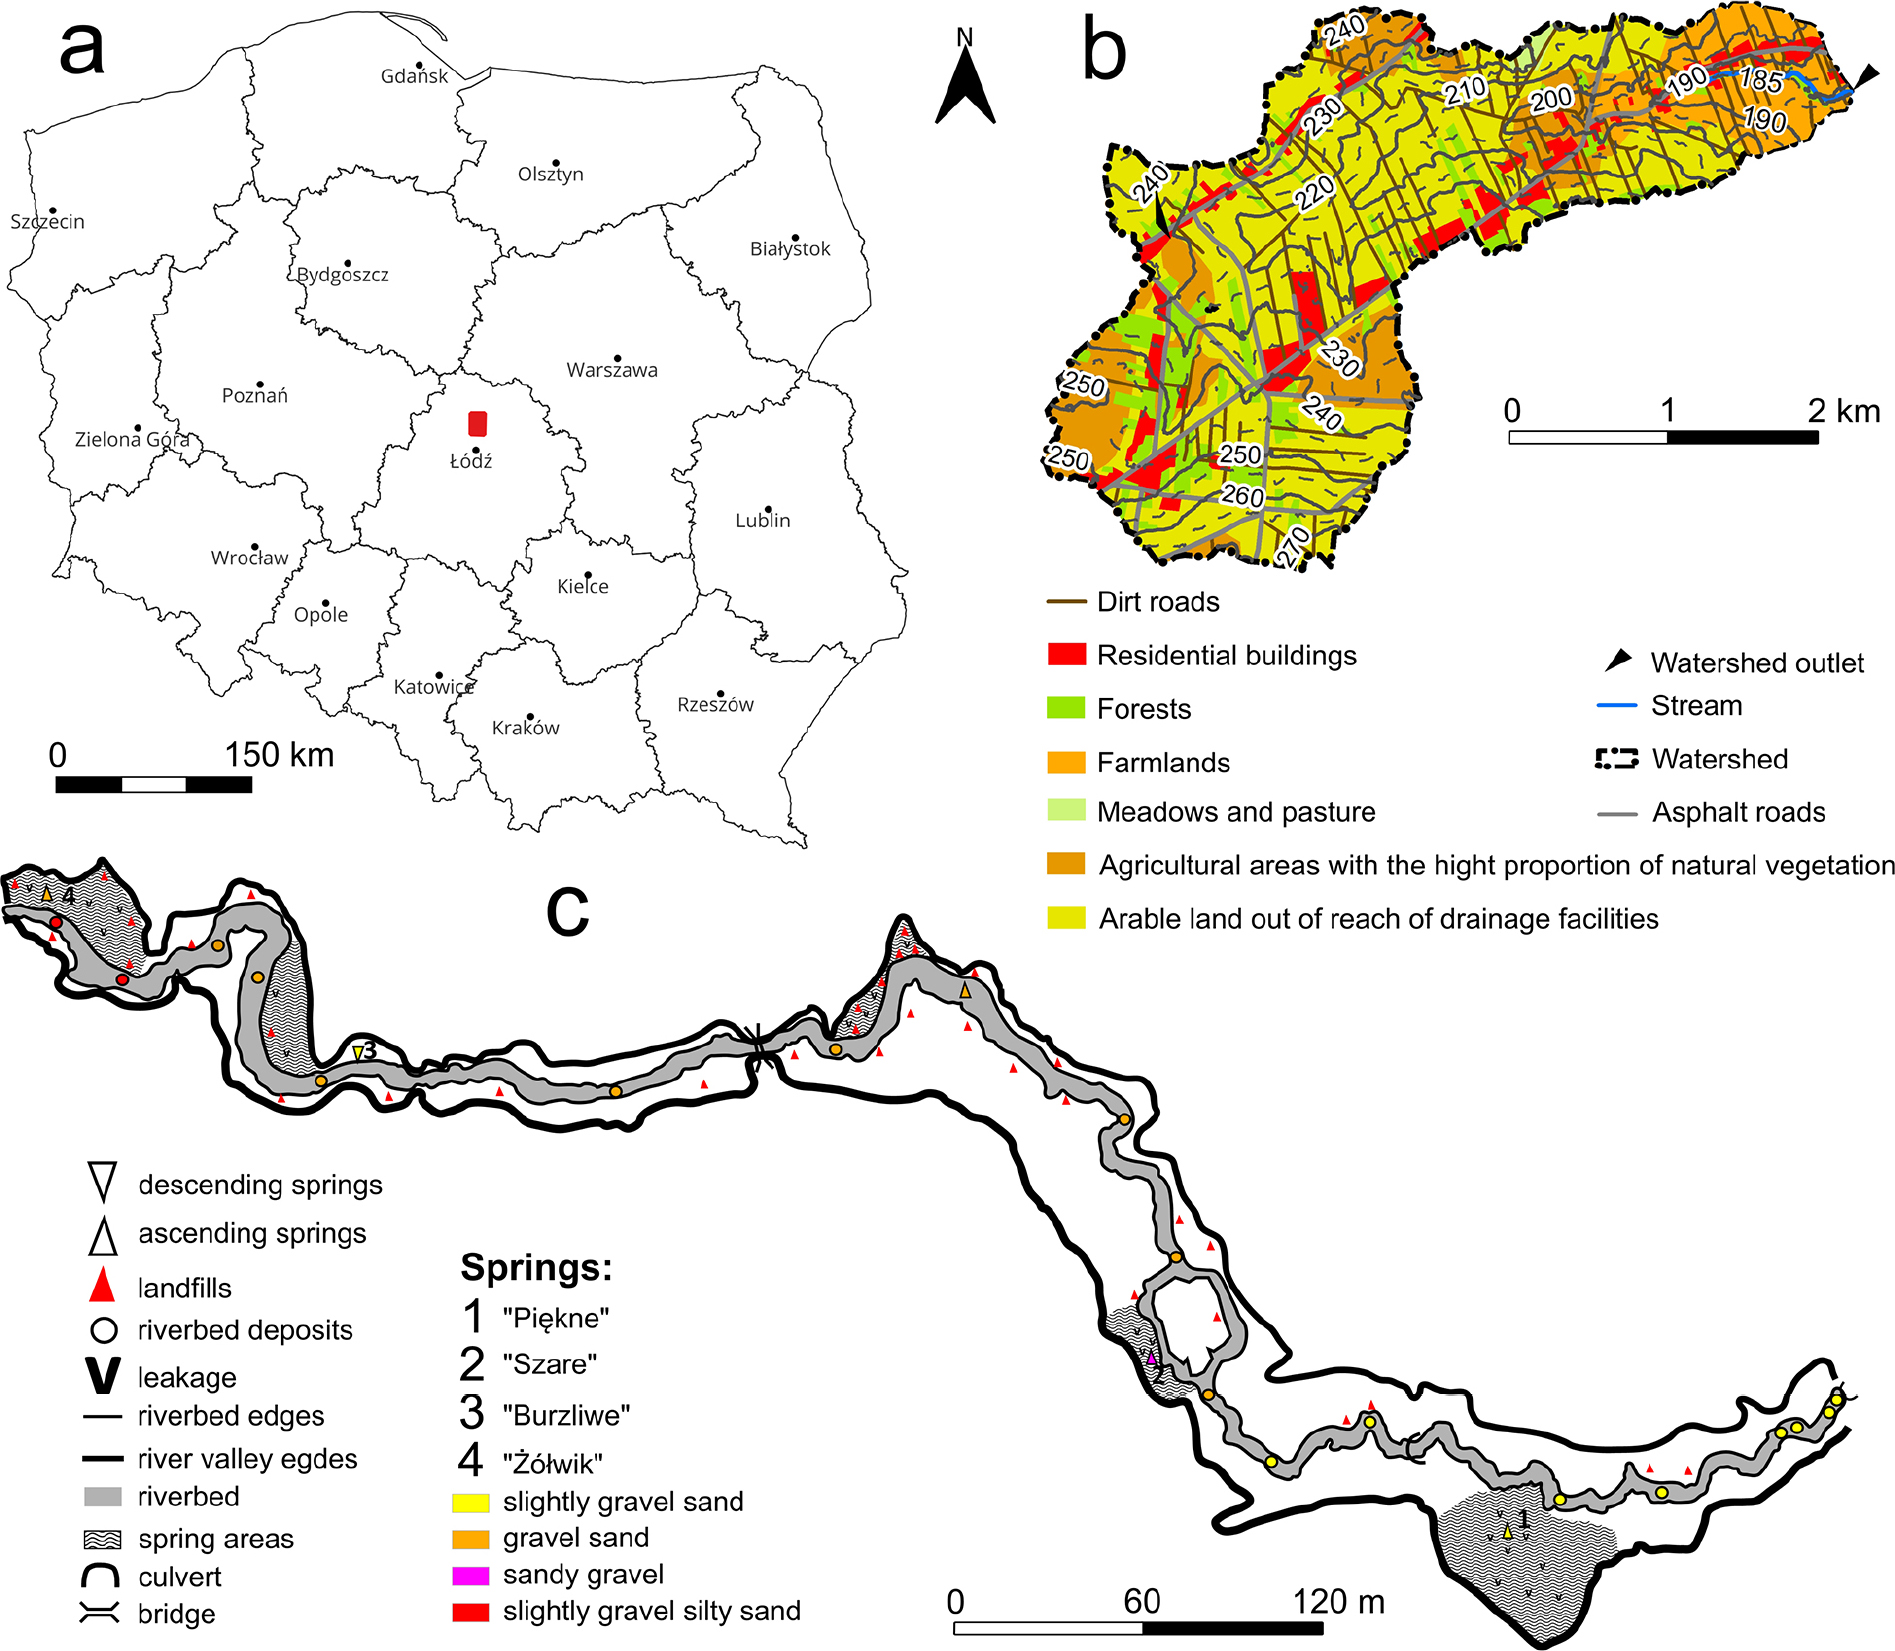
Fig. 1.
Land use map of the catchment area of the northern arm of the Struga Dobieszkowska watercourse: a – location of the catchment area in Poland; b – map of the entire catchment area; c – type of bottom sediments in the riverbed of the Struga Dobieszkowska.
Table 1.
Characteristics of the differential catchment area and the riverbed of the northern arm of the Struga Dobieszkowska stream.
| Drainage catchment | |||||||
|---|---|---|---|---|---|---|---|
| Feature | Circuit | Area | Slope | H max | H min | Length | Medium width |
| [km] | [km2] | [‰] | [m a.s.l.] | [km] | |||
| Value | 2.95 | 0.55 | 23.26 | 203.0 | 179.5 | 1.01 | 0.54 |
| Northern arm of the Struga Dobieszkowska | |||||||
| Feature | Lengtd | Slope | Riverbed widtd | Medium deptd | |||
| [km] | [‰] | [m] | [cm] | ||||
| Value | 0.86 | 5.35 | 1.5–4.0 | 14.5 | |||
The catchment area of Struga Dobieszkowska lies within the edge zone of the Łódź Hills mesoregion, which is part of the South Mazovian Hills macroregion. This zone is characterized by significant denivelations on the Zgierz-Łódź-Brzeziny line between the Heights and the Łowicko-Błońska Plain, where Klatkowa (1965) distinguished five morphological levels. The catchment area of the Struga Dobieszkowska includes 3 upper grades: the upland surface (282.9–210.0 meters a.s.l.), the Smardzew level (210.0–185.0 m a.s.l.), and the Stryków level (185.0–160.0 m a.s.l.). The differential topographic catchment of the NSD is mainly composed of glacial sands of the Middle Polish Glaciation (Warthanian). In the southern part, the surface is marked by sands, gravels, and, in some places, glacial till. The river valley’s bottom is composed of Holocene fluvial sands, and the valley slopes feature small erosional forms characteristic of dry valleys and evaporation patterns, with deluvial covers developing in the lower sections (Brzeziński 1992).
The sediments lining the riverbed are dominated by a sandy fraction. In the initial section of the watercourse, sandy gravel is dominant, which turns into gravel-sand with the course of the stream. From the bottom of the “Szare” spring, all the way to the mouth, the sediments change to slightly gravelly sands. The outflow of water in the “Żółwik” spring is through gravel sands, in the “Burzliwe” and “Piękne” springs through slightly gravel sands, in the “Szare” spring through slightly gravel silty sands (Fig. 1c).
The land development of the catchment is characteristic of suburban areas, with a predominance of rural landscape elements. To the south, the catchment area is adjacent to the scattered urban areas of Łódź. The catchment area is mainly used for agriculture (Fig. 1b). On the southern and northern sides, the valley is surrounded by farms and cultivated fields. Their share in the development of the catchment is about 80%. From the north, it is directly adjacent to the development of the Stary Imielnik village, which is subject to rapid urbanization. The village is plumbed, and the sewage system is based on individual installations, i.e., septic tanks and domestic sewage treatment plants. According to the latest data for the municipality of Stryków (2023), 94% of homes were connected to the sewerage system (the indicator for the Łódź Voivodeship id 97%) (www.polskawliczbach.pl).
The bottom of the river valley and the lower parts of the slopes are overgrown with alder. In several places on the northern slope of the valley, there are old village garbage dumps, from which waste is carried by surface runoff to the valley floor and further distributed by the waters of the spring stream along its course (Serwach, Ziułkiewicz 2025).
The meteorological data during the NSD research period, presented below, were measured at the station of the Institute of Meteorology and Water Management – National Research Institute in Łódź (Lublinek) (www.meteoblue.pl). In spring, average daily air temperatures ranged from 2°C (April 7, 2021) to 25°C (May 11) (Fig. 2A). The average daily air temperature in April was 9.2°C, while in May it was 15.1°C. In the second period, daily temperatures ranged from -6°C (December 26–27, 2021) to 15°C (November 1) (Fig. 2B). The average for November was 6.6°C, for December 0.7°C, and for January 2022: 1.9°C. The monthly precipitation total for April 2021 was 42.3 mm, and for May, 76 mm (Fig. 2A). Rainfall was the only data recorded in both months. In the autumn–winter period, precipitation totals ranged from 10.1 mm in November (mainly rain) to 13.5 mm in December (mainly snow) and 10.1 mm in January 2022 (mainly snow) (Fig. 2B).
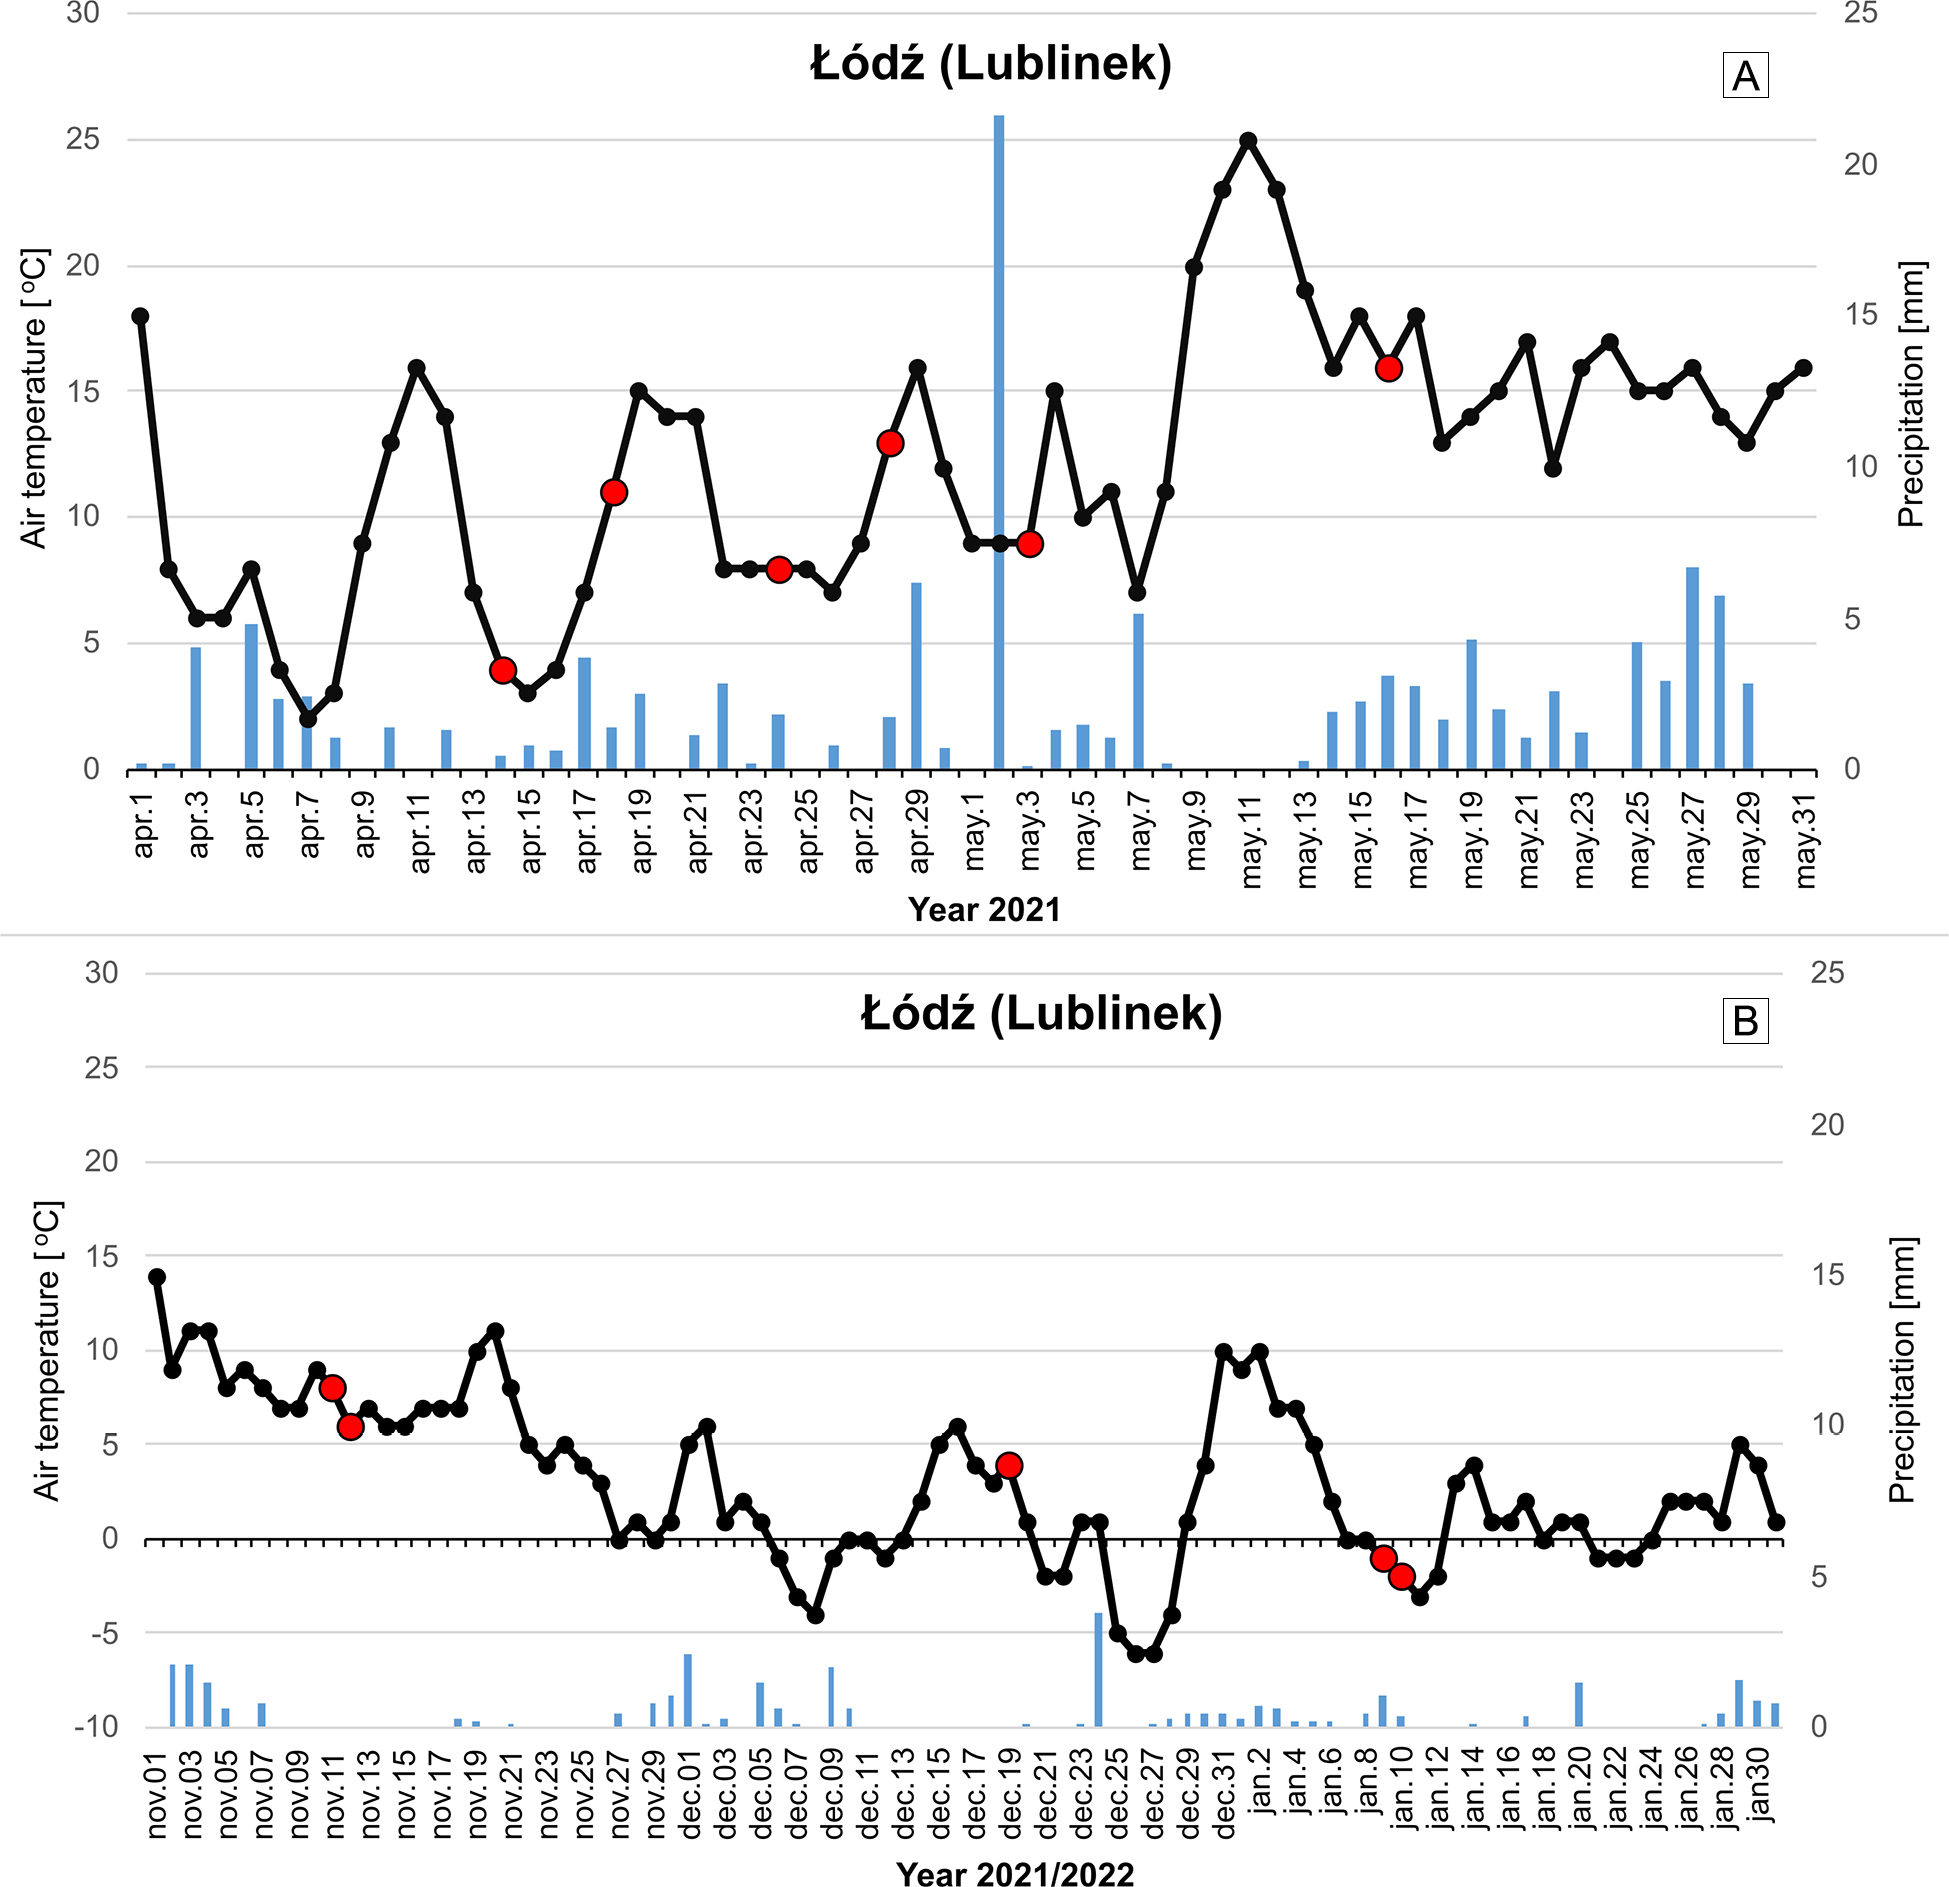
Fig. 2.
Air temperature and precipitation for the Łódź-Lublinek station during measurement cycles: A – spring cycle, B – autumn–winter cycle. Days of field measurements are marked with red dots.
Methods
VHG (vertical hydraulic gradient) measurements in the NSD riverbed were conducted in two main research cycles. The first covered the period from 14.04.2021 to 16.05.2021 (spring cycle), and the second was implemented from 11.11.2021 to 10.01.2021 (autumn–winter cycle). Measurement points were placed in the riverbed at intervals of 5–15 m. The final point total was 91 in each survey season. In the VHG measurements, a gradientometer was used (Marciniak, Chudziak 2015), which allows measurements to be taken at any point along the bottom of the watercourse. With this device, it is possible to compare the pressure of surface and groundwater, expressed in millimetres of water column. When the pressure of surface water is higher than that of ground water, this indicates downwelling, a situation in which surface water infiltrates into the streambed sediments. Conversely, when groundwater pressure is higher, it indicates upwelling, meaning that the river drains groundwater. Gradientometer was also used to collect water samples from beneath the riverbed in zones of positive VHG (upwelling), which was considered important for identifying pollutant inflow pathways to the riverbed. Once the gradientometer is placed at a measurement point, it is removed only after completing the VHG measurements and collecting the water sample. During operation, it is manually switched from measurement to sampling mode. Measurements of physicochemical parameters, including water temperature, pH2, SEC3 and redox potential were carried out in an overflow cell in which electrodes and measurement sensors were tightly mounted. Water samples were collected using a hand-operated vacuum pump equipped with a manometer and transferred into Nalgene 500 ml PE containers. These samples were then transported to the Geology and Geomorphology Department at the University of Łódź in a refrigerator at 4°C. In the laboratory, analyses were conducted to determine the concentrations of various mineral forms of nutrients (NH4+, NO2–, NO3–, PO43–) and chlorides. The study also included river and spring waters as a representation of groundwater drained by the stream. The work was supplemented by measuring the stream flow rate with a Biomix HEGA-1 hydrometric mill. The content of biogenic ions was determined by chromatography on a Marcel S.330 UV-VIS device, and chlorides by the Mohr method. The concentrations of individual substances were determined according to the following analytical standards: nitrates - DIN EN 26777; nitrites – DIN 38406-9; ammonium – DIN 38406-5; phosphates – PN-EN ISO 10304-1, and chlorides – (IC) PN-EN ISO 14911. The physicochemical properties were measured with an Elmetron CX-742 device with electrodes and sensors from Eurosensor and Elmetron. To determine the type of channel sediments, samples were collected from a depth of 20 cm at selected points in the stream channel. These sediments were then subjected to granulometric analyses in the laboratory using sieve and aerometric methods (Mycielska-Dowgiałło 1995).
To identify the hyporheic zone based on chloride concentrations (Cl–), the proportion of river water in hyporheic waters was calculated using the formula given by Battin et al. (2003), which is based on the End-member mixing analysis (EMMA) method (Christophersen et al. 1990). The subsequent steps for deriving this formula are as follows:
where:
– CHZ – chloride concentration in hyporheic water,
– CRW – chloride concentration in river water,
– CGW – chloride concentration in groundwater,
– x – the share of river water in hyporheic waters.
The “Piękne” spring, with a long period of hydrochemical observations (Ziułkiewicz et al. 2023), was adopted as a representation of the underground end-mixing element in the HZ. As a second end-member, the concentrations in the hyporheic water were used separately for each sampling point, treating them as individual case studies. As the final element, chloride concentrations in river water were used, with samples collected at several locations along the channel (approximately one per every 200 m).
Results
Vertical hydraulic gradients
In all seasons in which VHG was measured, points with upwelling absolutely prevailed. In both periods, the downwelling zones formed clusters of no more than 4 points. However, a zone of more frequent occurrence of downwelling than in the rest of the riverbed, located in the initial section, was outlined (Fig. 3). Another downwelling zone was found between the 500th and 750th meters of the stream. Within it, points with negative VHG are scattered at greater distances than in the initial zone. They form clusters of up to three points. In autumn and winter, VHG values were higher (Table 2, Fig. 3) at lower NSD flows.
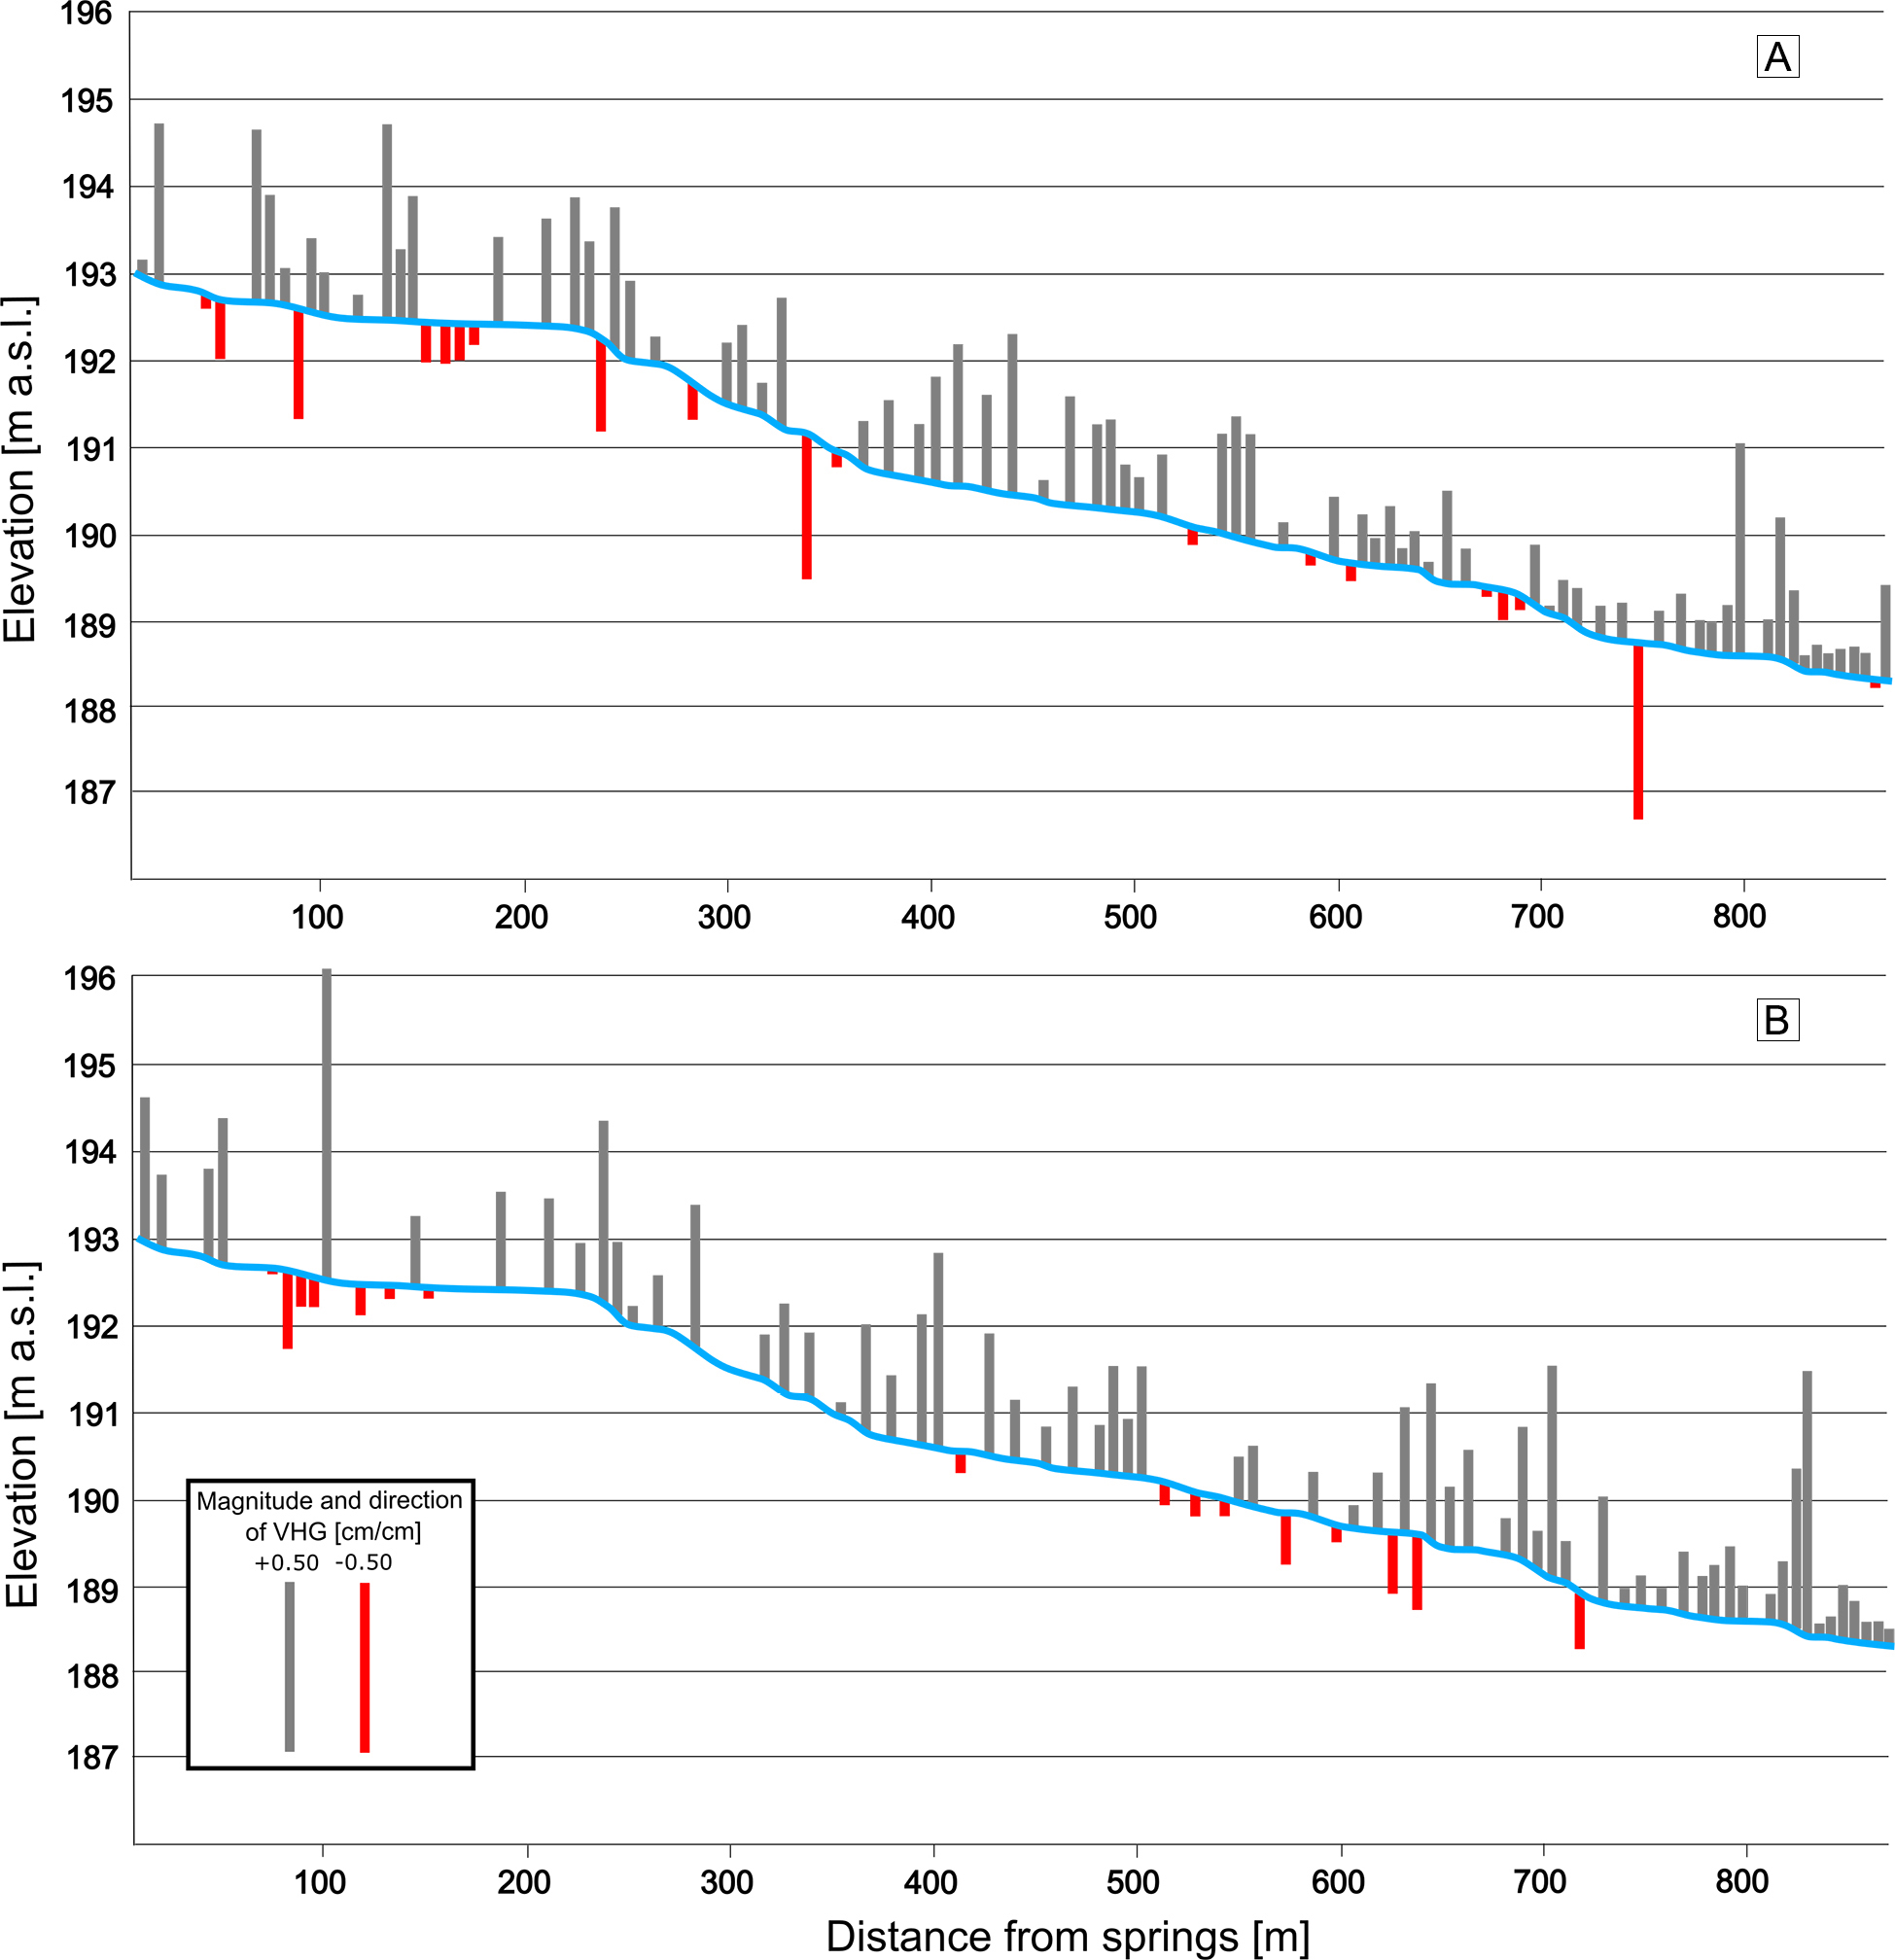
Fig. 3.
Magnitudes of hydraulic gradients in the riverbed of the northern arm of the Struga Dobieszkowska watercourse in the period: a – spring; b – autumn and winter.
Table 2.
Characteristics of the northern riverbed of Struga Dobieszkowska.
| Parameter | Spring | Autumn/winter | Average | |
|---|---|---|---|---|
| Discharge [dm3 · s−1] | 22.3 | 20.7 | 21.5 | |
| Reynolds number | Value | 7921 | 7761 | 7841 |
| flow type | turbulent | turbulent | turbulent | |
| HZ [%] | ||||
| Share of sections with HZ on the course of the riverbed at/n | 24.1/56 | 37.7/58 | 30.9 | |
| Share of river water in HZ zones at/n | 52.2/56 | 43.9/58 | 47.9 | |
| VHG [cm · cm−1] | ||||
| Minimum | –0.50 | –0.22 | –0.36 | |
| Maximum | +0.60 | +0.89 | +0.75 | |
| Average | +0.12 | +0.14 | +0.13 | |
| Frequency of phenomena [%] | ||||
| Share of points with downwelling | 20.9 | 17.6 | 19.3 | |
| Share of points with upwelling | 78.0 | 72.5 | 75.3 | |
| Share of points with pressure balance | 1.1 | 1.1 | 1.1 | |
| Share of inactive points | 0.0 | 8.8 | 4.4 | |
According to calculations of mixing ratios (1), the hyporheic zone occurs on average at approximately 31% of the length of the NSD; in the spring period, this share was 24.1%, and in the autumn–winter period, 37.7% (Table 2). In the autumn–winter period, the hyporheic zone occurred over a greater length of the river channel. A higher river flow was recorded in spring and amounted to 22.3 dm3 · s−1, and in the autumn–winter period, 20.7 dm3 · s−1. In both periods, the flow was turbulent, with a slightly higher Reynolds number in the spring (Table 2).
Hydrochemical conditions
The basic statistical characteristics of the physicochemical properties of the tested waters are presented in Table 3.
Table 3.
Characteristic values of physicochemical properties of river and hyporheic waters in measurement seasons.
| Spring season | |||||||
|---|---|---|---|---|---|---|---|
| Parameter | Unit | Hyporheic waters | River waters | ||||
| Average | Minimum | Maximum | Average | Minimum | Maximum | ||
| T | [°C] | 10.3 | 6.0 | 15.0 | 10.1 | 7.0 | 12.0 |
| pH* | [–] | 6.93 | 6.10 | 7.91 | 7.72 | 7.56 | 7.85 |
| SEC | [μS · cm−1] | 398 | 235 | 1108 | 416 | 396 | 462 |
| Eh | [mV] | +59 | –123 | +165 | – | – | – |
| Autumn/winter season | |||||||
| T | [°C] | 7.3 | 4.0 | 10.0 | 6.5 | 4.3 | 8.4 |
| pH* | [–] | 6.83 | 6.05 | 8.25 | 6.91 | 6.33 | 8.27 |
| SEC | [μS · cm−1] | 364 | 245 | 660 | 398 | 350 | 427 |
| Eh | [mV] | +42 | –222 | +178 | 94 | 57 | 153 |
Hyporheic waters were warmer than river waters in both periods and exhibited greater fluctuations (Table 3). In spring, the water temperature in the HZ decreased along the river course, whereas in autumn and winter it increased (Fig. 4). Comparing the temperature of spring waters with hyporheic waters, it can be observed that the former shows a wider range of results. In autumn and winter, when the temperature of hyporheic waters increased along the river course, the temperature also increased in subsequent springs located closer to the mouth (Table 5, Fig. 4).
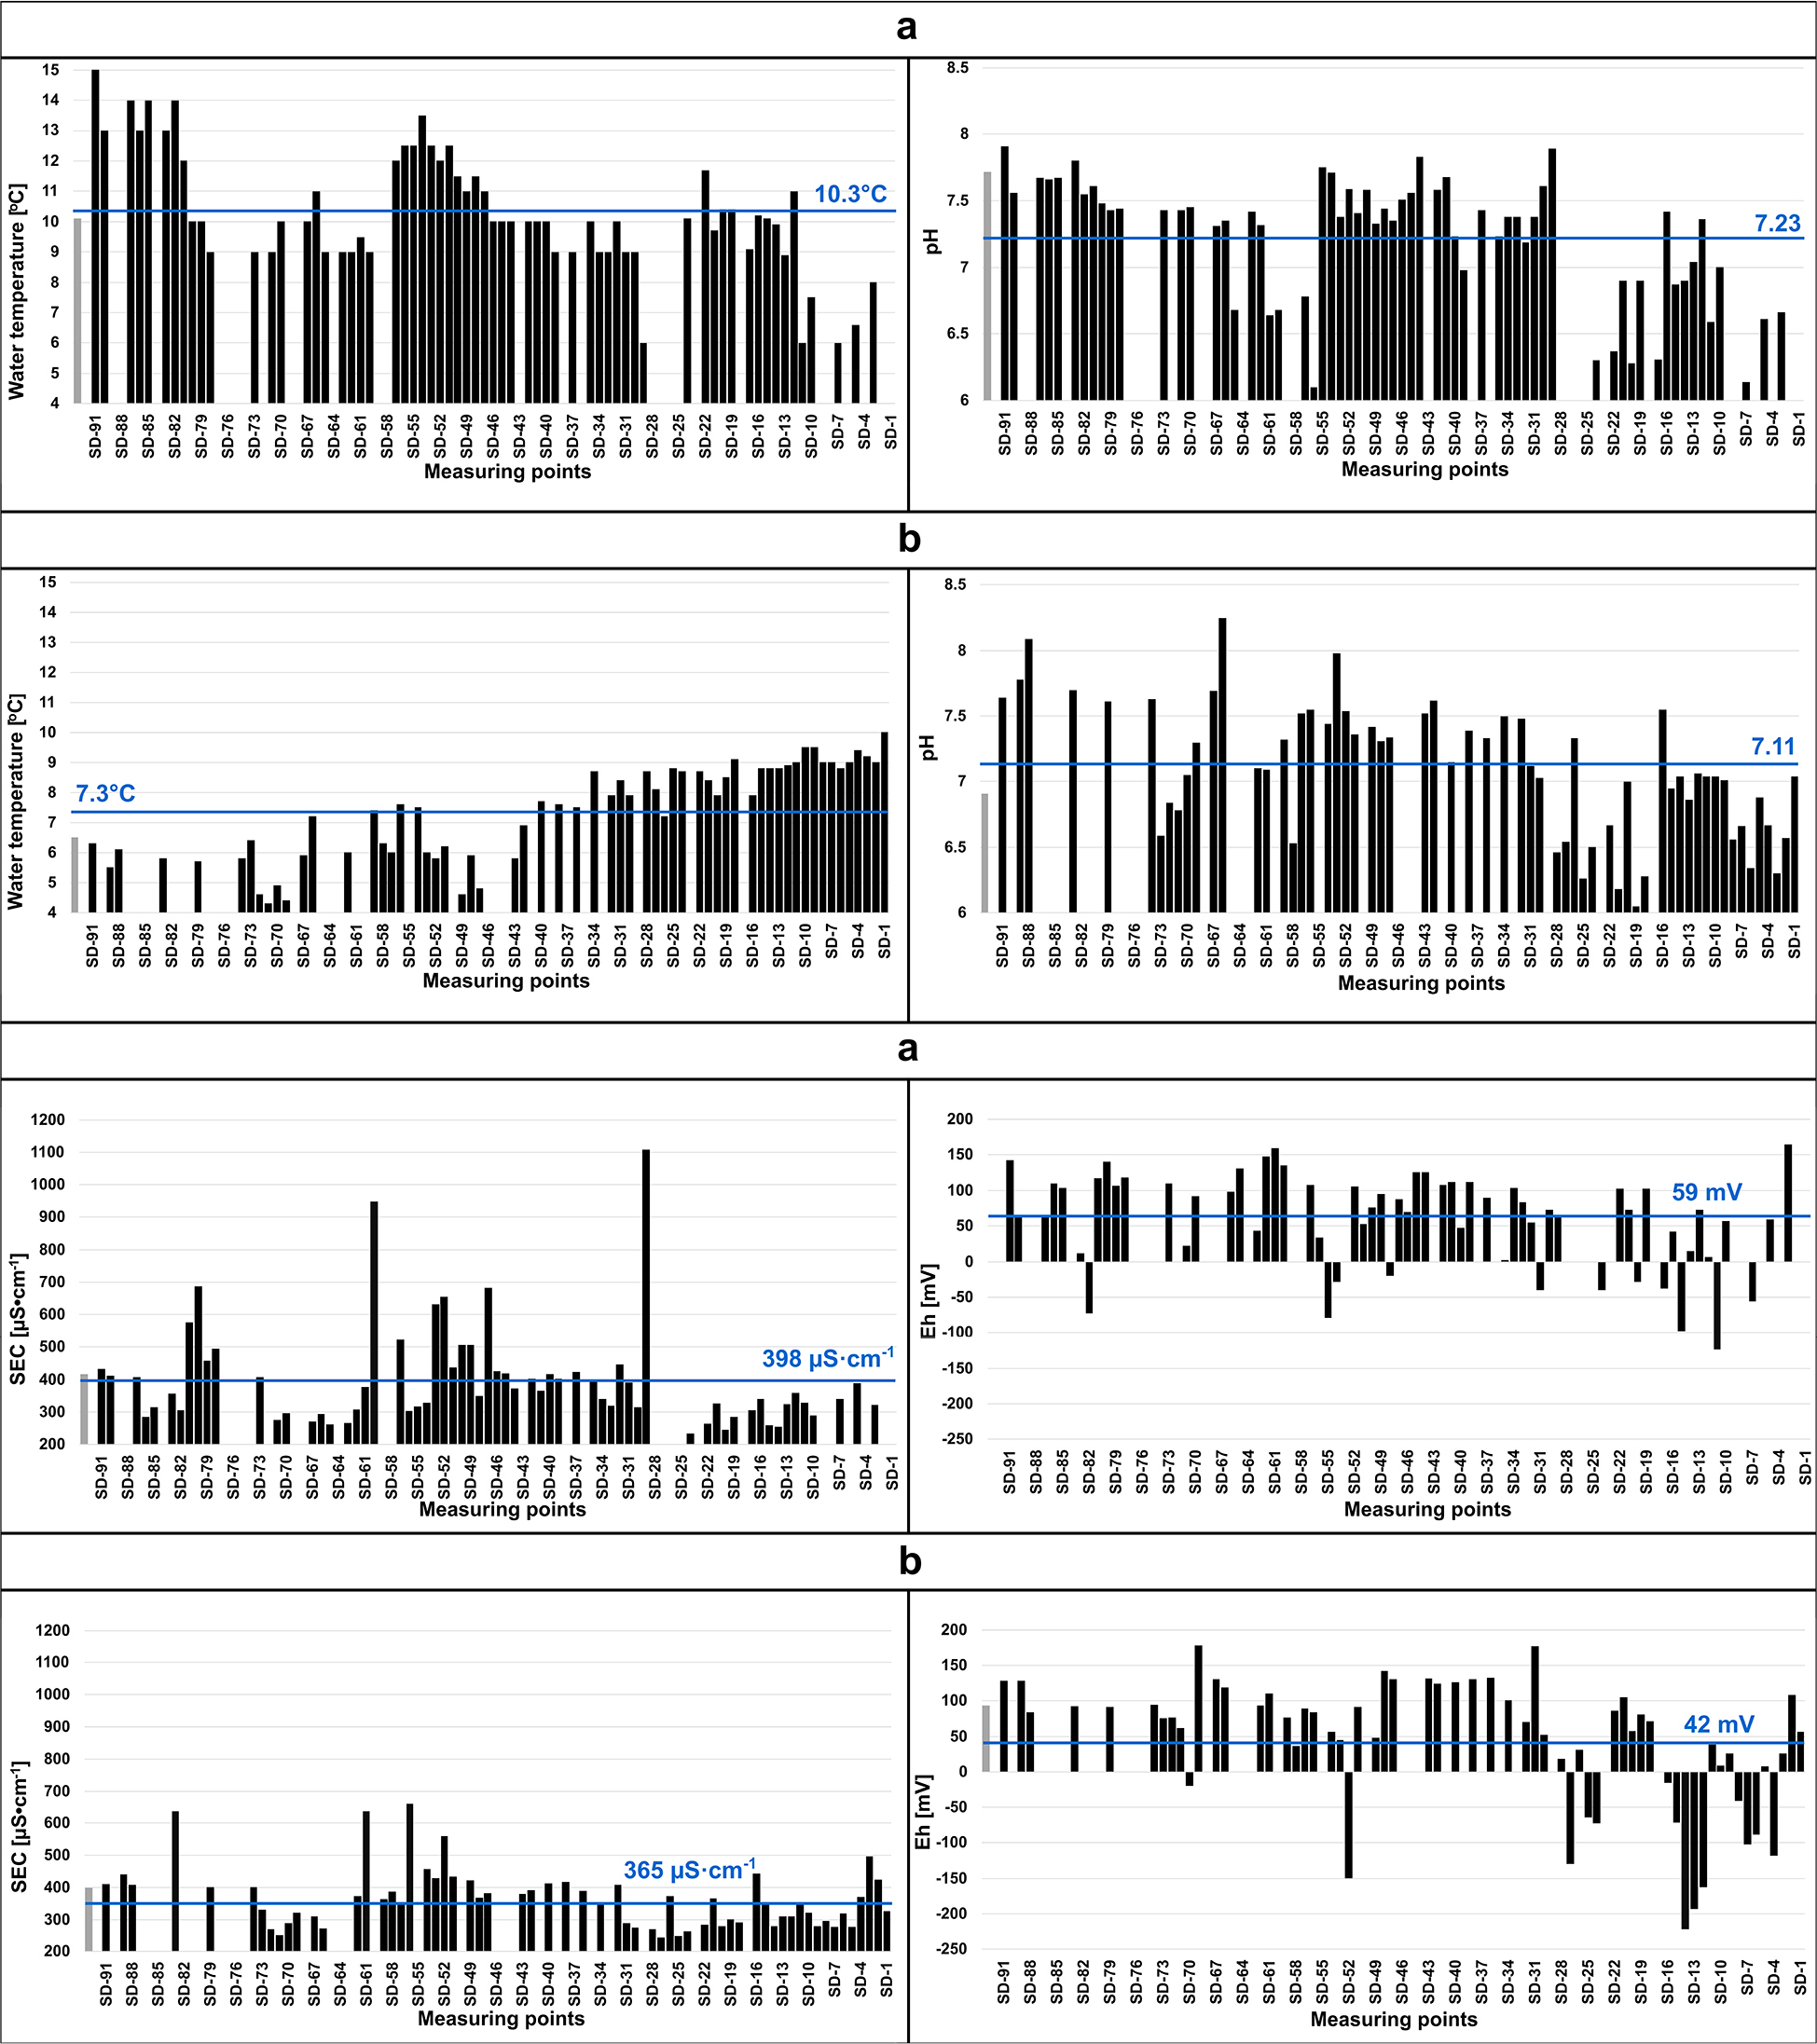
Fig. 4.
Changes in temperature, pH, SEC, and Eh of hyporheic waters along the riverbed: a – in the spring period; b – in the autumn–winter period. Black colour indicates results for hyporheic waters; gray colour – average for river waters; blue colour – average value of physico-chemical parameters for a given period in hyporheic waters.
The average pH reaction of river waters was higher than that of hyporheic waters in both seasons, with lower amplitudes in the stream relative to the HZ. The pH of hyporheic waters decreased along the course of the stream: in spring from 7.91 (SD-91) to 6.29 (SD-20), and in the autumn–winter season from 8.25 (SD-66) to 6.05 (SD-19) (Table 3, Fig. 4).
The SEC of river waters was higher than that of hyporheic waters, with higher amplitudes in the HZ. There were no consistent trends in course changes, while elevated SEC values often occurred locally in the upper and middle sections, especially in the spring season (SD-29 and SD-60) (Table 3, Fig. 4).
The redox potential of HZ waters was slightly higher in spring than in autumn, when the amplitude of changes was also noticeably higher (Table 3). Cases of negative redox potential were relatively few, and concentrated in the mouth section (Fig. 4). The Eh range of river waters was at least twice as narrow as that of HZ waters, and the average was twice as high (Table 3). In the HZ, redox conditions were generally transient, but with high dynamics of changes, greater in the autumn-winter season.
The results of measurements of physicochemical properties of spring water are presented in Table 5. In the vicinity of the inflow spring “Żółwik”, the physicochemical properties of spring and hyporheic waters were very similar. The maximum differences in the results between spring and hyporheic waters were: –2.2°C; –0.45 pH units; +32 mV in Eh and +44 μS · cm−1 in SEC. For the remaining ascending sources, the differences in results between spring and HZ waters are more pronounced. Significant differences in water pH are observed for the “Piękne” and “Burzliwe” springs, with differences in SEC exceeding 100 μS · cm−1 noted in all facilities. The most signifcant differences were noted for redox, which reached 294 mV near the “Piękne” spring. The characteristic values calculated for the concentrations of mineral forms of nutrients are shown in Table 4.
Table 4.
Characteristic values of nutrient concentrations in the river and hyporheic waters.
| Spring season | |||||||
|---|---|---|---|---|---|---|---|
| Ion [mg · dm−3] | Hyporheic waters | River waters | |||||
| Average | Minimum | Maximum | No ion at measurement at/n | Average | Minimum | Maximum | |
| NH4+ | 0.056 | 0.000 | 1.720 | 40/56 | 0.050 | 0.000 | 0.193 |
| NO2– | 0.046 | 0.021 | 0.106 | 0/56 | 0.265 | 0.062 | 0.830 |
| NO3– | 14.713 | 0.000 | 72.100 | 11/56 | 28.850 | 23.800 | 34.300 |
| PO4−3 | 0.392 | 0.094 | 0.813 | 0/56 | 0.391 | 0.334 | 0.455 |
| Autumn/winter season | |||||||
| NH4+ | 0.086 | 0.000 | 1.090 | 18/56 | 0.032 | 0.000 | 0.080 |
| NO2– | 0.060 | 0.007 | 0.278 | 0/56 | 0.095 | 0.070 | 0.120 |
| NO3– | 16.976 | 0.000 | 68.200 | 5/56 | 30.425 | 26.100 | 35.000 |
| PO4−3 | 0.279 | 0.045 | 0.630 | 0/56 | 0.357 | 0.296 | 0.391 |
In river waters, higher concentrations of NH4+ and NO2– were recorded in spring than in autumn-winter. However, in both of these periods, there were cases of a lack of ammonium ions in river water. In hyporheic waters, higher mean concentrations of ammonium and nitrite were recorded in autumn–winter, with noticeable increase towards the mouth. The same spatial trend also occurred in spring. Average and maximum concentrations of NH4+ in all seasons were higher in hyporheic waters than in river waters (Table 4, Fig. 5). In both periods, high variability of NO2- concentrations (at a level comparable to NO3–) was observed in the HZ along the river course. Average and maximum concentrations of nitrite ions were recorded in the river and springs than in hyporheic waters (Table 4).
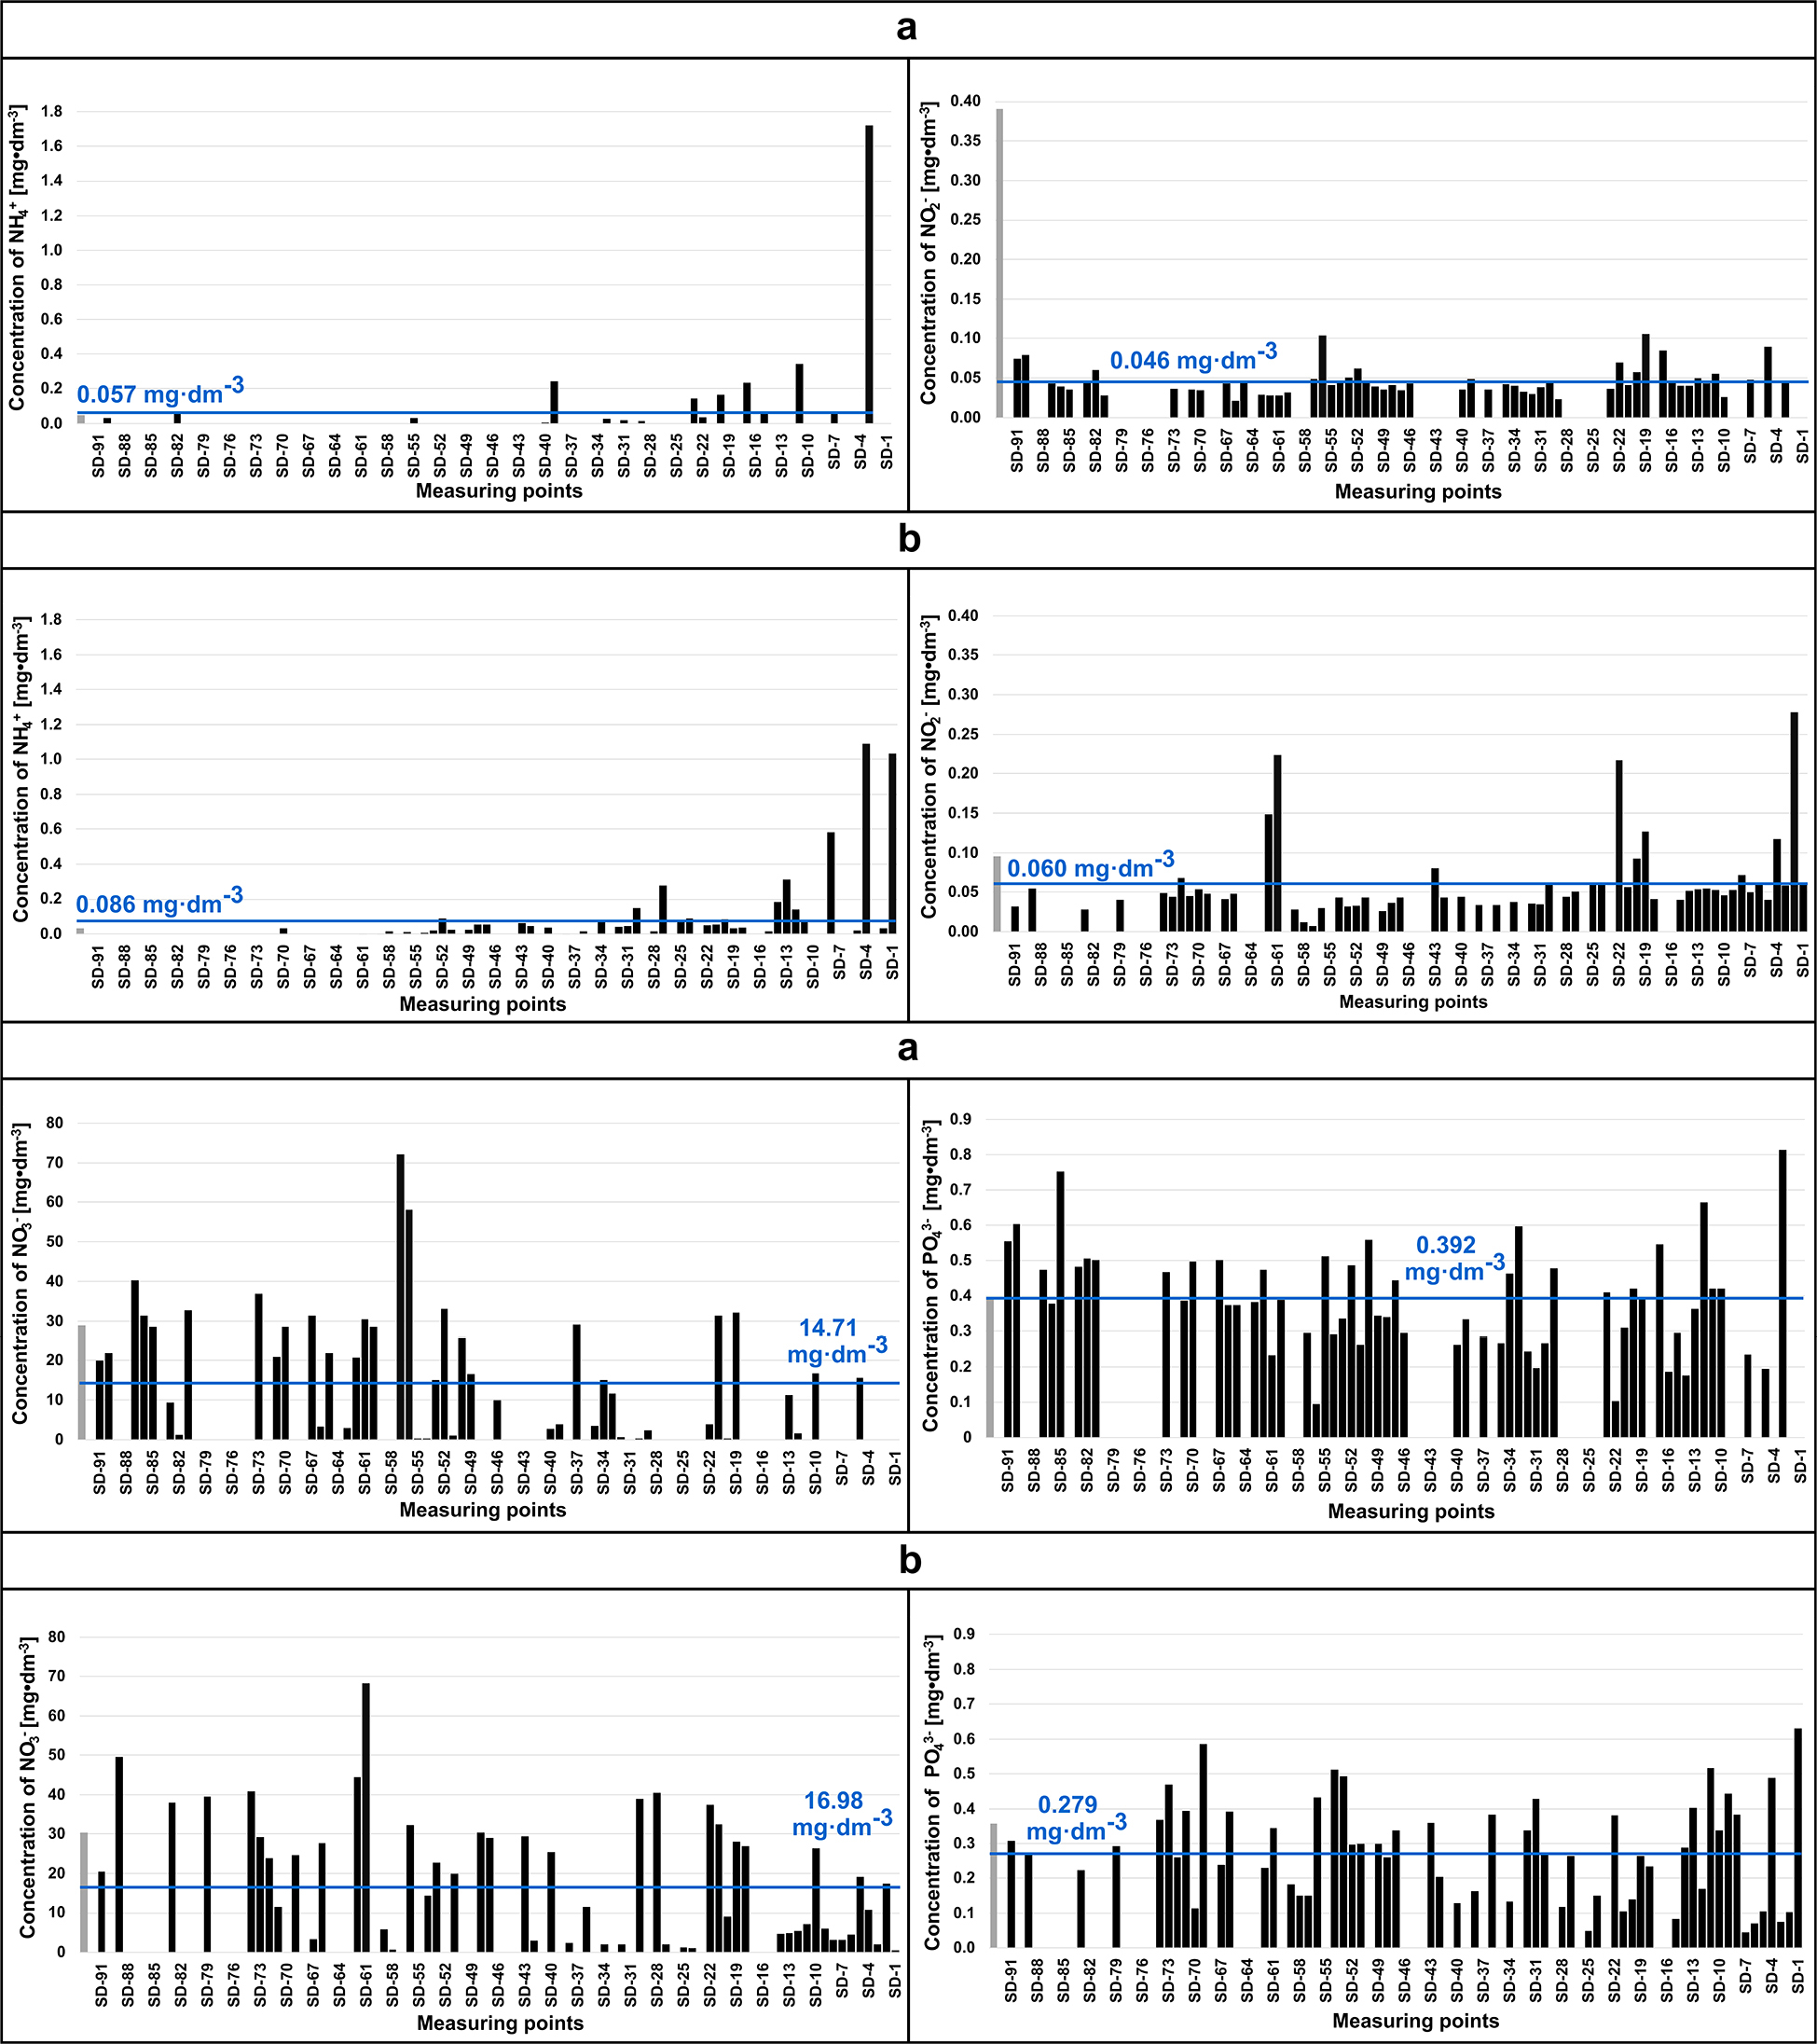
Fig. 5.
Variability of concentrations of ammonium ion, nitrate, nitrite, mineral nitrogen, and orthophosphate in hyporheic waters along the riverbed: a – in the spring period; b – in the autumn- winter period. Black colour indicates results for hyporheic waters; gray colour – average for river waters; blue colour – average ion concentration for a given period in hyporheic waters.
In river waters, average nitrate concentrations were similar in both periods. For hyporheic waters, higher average concentrations occurred in the autumn–winter cycle. In spring and autumn, several samples showed no NO3–. A decrease in concentrations toward the mouth of the watercourse was noticeable in both measurement cycles. During the study, the mean concentrations of NO3– in river waters were about twice as high as in hyporheic waters (Table 4, Fig. 5).
Higher phosphate concentrations were recorded in river waters in spring. In hyporheic waters, higher average and maximum concentrations also occurred in spring. During this time, increased concentrations were recorded in the initial section and at point SD-3. In the autumn–winter period, no increased concentrations were recorded in the initial section. In spring, the average PO43- concentrations in river and hyporheic waters were very similar, although the HZ displayed a higher peak value. In the autumn–winter period, higher average concentrations were recorded in river waters, where the maximum concentration was lower than in hyporheic ones (Table 5).
Table 5.
Values of physicochemical properties and concentrations of nutrients at groundwater outfalls and in their immediate vicinity during the autumn-winter period.
| Parameter | Unit | Żółwik spring | Burzliwe spring | Szare spring | Piękne spring | |||||||||||
|---|---|---|---|---|---|---|---|---|---|---|---|---|---|---|---|---|
| Water temp. | [°C] | 7.6 | 8.8 | 8.6 | 9.2 | |||||||||||
| 6.3 | 5.5 | 4.4 | 5.9 | 7.2 | 7.5 | 8.7 | 7.9 | 8.4 | 7.9 | 9.1 | 8.8 | 8.8 | 8.8 | 8.9 | ||
| pH | [–] | 8.09 | 7.43 | 7.12 | 7.54 | |||||||||||
| 7.64 | 7.78 | 7.3 | 7.69 | 8.25 | 7.33 | 7.50 | 7.48 | 7.12 | 7.03 | 6.28 | 6.95 | 7.04 | 6.86 | 7.06 | ||
| SEC | [μS · cm−1] | 409 | 428 | 293 | 333 | |||||||||||
| 410 | 441 | 321 | 310 | 272 | 389 | 350 | 408 | 288 | 275 | 290 | 352 | 279 | 309 | 310 | ||
| Eh | [mV] | 84 | -121 | 15 | 72 | |||||||||||
| 128 | 128 | 178 | 131 | 119 | 133 | 101 | 70 | 177 | 52 | 71 | -72 | -222 | -193 | -163 | ||
| NO3– | [mg · dm−3] | 53.5 | 30.9 | 27.7 | 29.600 | |||||||||||
| 20.5 | 49.5 | 24.6 | 3.3 | 27.6 | 11.5 | 2.1 | 2.0 | 0.0 | 38.9 | 26.9 | 0.0 | 4.7 | 4.9 | 5.5 | ||
| NO2– | 0.05 | 0.107 | 0.115 | 0.044 | ||||||||||||
| 0.03 | 0.05 | 0.05 | 0.04 | 0.05 | 0.03 | 0.04 | 0.04 | 0.04 | 0.06 | 0.04 | 0.04 | 0.05 | 0.05 | 0.06 | ||
| NH4+ | 0.0 | 0.0 | 0.04 | 0.01 | ||||||||||||
| 0.0 | 0.0 | 0.0 | 0.0 | 0.0 | 0.02 | 0.07 | 0.04 | 0.05 | 0.15 | 0.04 | 0.02 | 0.2 | 0.1 | 0.1 | ||
| PO4−3 | 0.3 | 0.34 | 0.34 | 0.34 | ||||||||||||
| 0.3 | 0.3 | 0.6 | 0.2 | 0.4 | 0.4 | 0.1 | 0.3 | 0.4 | 0.3 | 0.2 | 0.1 | 0.3 | 0.4 | 0.2 | ||
| Point | [-] | SD-91 | SD-89 | SD-69 | SD-67 | SD-66 | SD-36 | SD-34 | SD-32 | SD-31 | SD-30 | SD-18 | SD-15 | SD-14 | SD-13 | SD-12 |
Nutrient concentrations in spring waters are shown in Table 5. In the case of the “Żółwik” spring, nutrient concentrations in the spring season and in hyporheic waters are comparable. In the case of nitrate, there was one instance of concentration difference reaching 33 mg · dm−3 (Table 5). For other tested springs, fluctuations in concentrations were more varied, especially for nitrate. Amplitude range between spring and hyporheic waters ranged from 0.3 to 29.7 mg · dm−3. Nitrite and phosphate presented the most stable results, similar to or lower than those in spring waters. The ammonium ion was absent in the Burzliwe and Żółwik springs and in the nearby hyporheic water. For the two remaining springs, higher ammonium ion concentrations were typically recorded in the adjacent part of the hyporheic zone (Table 5).
Discussion
Struga Dobieszkowska (SD), which is a tributary of the Moszczenica River, is located in one of the most upwelled areas of Central Poland. Research conducted on an 860-meter section of the watercourse’s bed revealed a definite predominance of upwelling zones. This is due to the nature of the studied section, which receives water from springs and other natural groundwater outflows along its entire length. A comparison of the magnitude of gradients measured at the bottom of the NSD bed with gradients measured directly within the ascending springs seems to support this assumption. The highest VHG found in the stream bed was 0.885 cm · cm−1 (Fig. 3), while in the “Szare” and “Piękne” springs, the VHG was much higher, i.e., 1.35 cm · cm−1. According to experimental studies, the critical hydraulic gradient is 1.16 cm · cm−1. Above this limit, fluidization of bottom formations occurs (Marciniak et al. 2018), i.e., the dilution phenomenon of riverbed sediments due to the ascending groundwater subflow. Measurements taken along the stream near the spring niches revealed a marked increase in VHG values, suggesting increased “upwelling.” Despite the absence of distinct bed sand pulsation, it is reasonable to infer the presence of preferred subterranean flow zones directly discharging into the stream bed, potentially along the extension of outflows from nearby productive springs (Figs 2, 3). Similar changes in VHG near groundwater outflows were observed in the southern arm of the SD (Ziułkiewicz et al. 2023). The VHG measured in the middle Moszczenica, far beyond the spring zones, was at a significantly lower level than that of the studied spring watercourse, i.e., a maximum of 0.055 cm · cm−1 (Marciniak et al. 2019) versus 0.885 cm · cm−1. The ratio of positive to negative VHG was also different. Within the studied NSD, the representation of upwelling reached 78%, while for the central Moszczenica it was 54% (Marciniak et al. 2019). As shown by other studies of the Moszczenica River, this is not a general rule. Gradients recorded upstream of the old mill in Gieczno exceeded 1.5 cm · cm−1 (in June 2023) (Ziułkiewicz 2024). According to Ziułkiewicz et al. (2021), in the erosion stretch of Malina4, the average VHG in winter was higher than in the NSD riverbed, whereas in spring it was lower. Higher VHG was recorded in Malina in winter, while the proportion of points with downwelling increased in the spring season. In NSD, a similar pattern occurred, with higher VHGs also recorded in autumn and winter than in spring. Comparable results were observed on the Truckee River (Nevada, USA), where VHG during the winter period not only increased in magnitude but also changed direction from negative to positive compared to summer (Shope et al. 2012). The higher VHGs in the autumn–winter season may have resulted from increased groundwater recharge following the mid-winter thaw, during which water was released from melting snow in the absence of surface freezing of the aeration zone (www.meteoblue.pl). During the analysis, a feature of the HZ became apparent, namely the ability to move upwelling and downwelling zones along the riverbed. The reason for such “movement” could be the transport of riverbed sediment or the presence of obstacles such as trunks, tree branches, or changes in the efficiency of the river’s groundwater recharge. A similar situation also occurred in the Malina riverbed (Ziułkiewicz et al. 2021, Ziułkiewicz, Grulke 2024). This can lead to changes in sediment properties in specific parts of the riverbed, such as the permeability coefficient.
The results of the biogenic concentrations obtained indicate the discharge of agricultural and domestic pollutants (fertilizers, sewage or farm garbage leachate) into the riverbed, which is evident, especially in the river waters. Concentrations recorded in NSD waters were compared with environmental standards for the content of these substances in surface waters. Exceedances for the third class of surface water quality occurred for three substances (nitrate, nitrite, and phosphate). Analysis of nutrient concentrations in hyporheic waters indicates that such inflow occurs only in short sections of the riverbed located in virtually every part of the studied watercourse. The initial and middle sections coincide with the locations of waste dumps (Fig. 1c), which are cover hotspot of hyporheic water pollution, such as microplastic particles (Serwach, Ziułkiewicz 2025). In the middle section at the outlet of the dry valley, where the largest landfill is located, elevated SEC, nitrate and nitrite concentrations were found in the absence of ammonium (Fig. 5), which may indicate the impact of another pollution source on the spatio-temporal scale of the NSD underground drainage basin. No potential surface source of pollution was observed in the initial section of the spring stream under study. However, the “Żółwik” spring operating there showed the highest nitrate concentrations in the spring waters under study (Table 5). Also noteworthy is the NSD mouth section, characterized by a lower redox potential, SEC (mainly in spring) and high ammonium ion concentrations. It is worth noting that this is the section of the watercourse where the thickness of sandy accumulation formations in the river bed is the greatest (Fig. 1). In this zone, there is a reduction in the pollutants brought in with groundwater, which are diluted by mixing with river water. These, in turn, enter the hyporheic zone in the higher sections of the riverbed, to return to it in this particular section of the NSD. In sediments with a finer fraction, preferably fine sand, the impact of the hyporheic zone on river water chemistry is more apparent (Marciniak et al. 2017). Large fluctuations in the values of the hydrochemical elements studied were found along the entire length of the NSD. Distinctly elevated SEC values and nutrient concentrations observed at individual measurement points or small clusters indicate spatially limited inflows of pollutants from underground drainage. This leads us to conclude that zones of preferred underground flow and pollutant delivery operate within the HZ NSD. Over the course of the two study seasons, these zones were observed to be dynamic and in motion (Figs 3, 4), consistent with observations from the Malina River bed (Ziułkiewicz and Grulke 2024). Based on the work of Wagner and Bretschko (2002), which posits that preferred underground flow zones constitute a spatially complex and dynamic system of water circulation beneath the riverbed, the hydrochemical anisotropy of the HZ may be attributed, in part, to this phenomenon.
Summary
The study of the northern arm of the Struga Dobieszkowska provided valuable information on hydrochemical variability and hyporheic exchange processes in a small spring stream. The main conclusions are as follows:
– The NSD is dominated by upwelling zones caused by intensive groundwater inflow from the aquifer, which feeds numerous springs;
– Seasonal movement of upwelling and downwelling zones was observed along the riverbed, reflecting the anisotropy of the hyporheic zone and temporal variations in groundwater recharge;
– High concentrations of biogenic substances were recorded mainly in the middle stretch of the watercourse, coinciding with the location of landfills and areas affected by agricultural and domestic pollution;
– In the mouth section, lower redox potential and increased ammonium concentrations reflect partial pollutant reduction and dilution processes, confirming the self-purifying function of the hyporheic zone supported by sandy bed deposits.
By identifying pollutant inflow zones within the HZ, actions can be taken to reduce their impact. One approach is the introduction of macrophytic vegetation, such as calamus or yellow scythe, to enhance nutrient bioassimilation (Izydorczyk et al. 2015). The second way is to stimulate downwelling of river water in polluted sections to promote dilution, oxygen supply and nitrogen transformation, such as ammonification and nitrification. In this case, hyporheic sediments perform the function of nitrogen and phosphorus removal, similar to that of riparian buffers (Triska et al. 1993). Natural obstacles such as beaver dams, fallen trunks or boulders may also enhance circulation and self-purification (Lautz et al. 2006, Adler et al. 2025). The high hydrochemical anisotropy of the HZ, driven by continuous changes in sediment hydraulic properties (Dole-Olivier et al. 2022), plays a key role in river restoration, as more natural flow conditions promote better hyporheic development and improve water quality.
Acknowledgments
The authors would like to thank Mr. Piotr Markowicz, M.Sc., and Mr. Jan Górowski, M.Sc., for their assistance during fieldwork, as well as Ms. Anna Fortuniak, M.Sc., for laboratory analyses of biogenic substances. The authors also thank the anonymous reviewers for their constructive comments and suggestions.
Notes
[5] It is a spring-fed stream flowing in the northern part of Zgierz, dividing into two distinct hydromorphological parts: erosive and accumulative. In the erosive one, there is intensive upwelling and feeding of the watercourse from riverbed and bedrock springs. In the accumulation one, downwelling predominates and there is no supply from springs.
[6] Contributed by Author’s contribution
RG: Conceptualization; Data curation; Formal Analysis; Investigation; Methodology; Visualization; Writing – original draft; Writing – review & editing. MZ: Conceptualization; Investigation; Methodology; Validation; Writing – review & editing.