
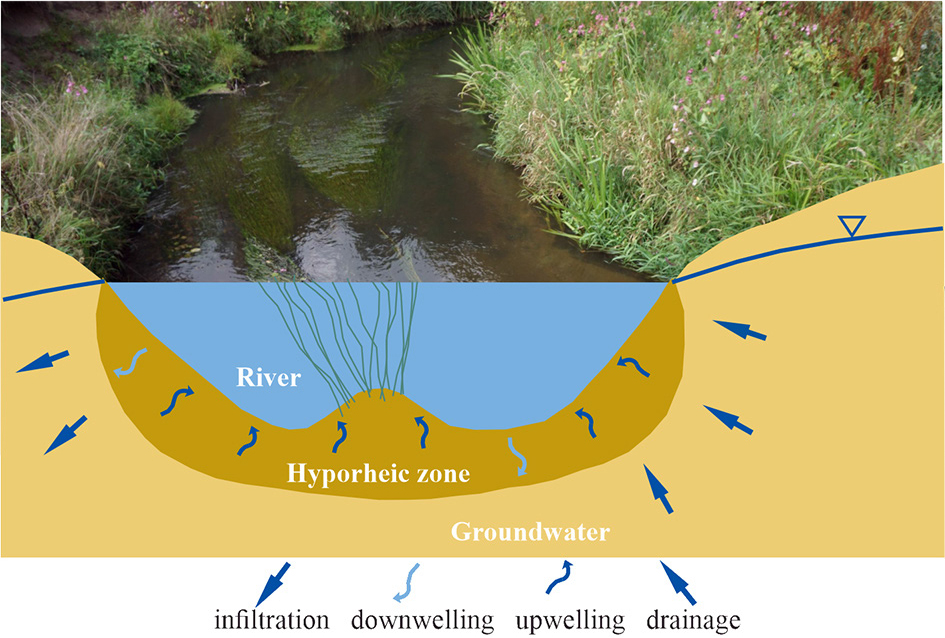
Fig. 1.
Water exchange in the hyporheic zone.
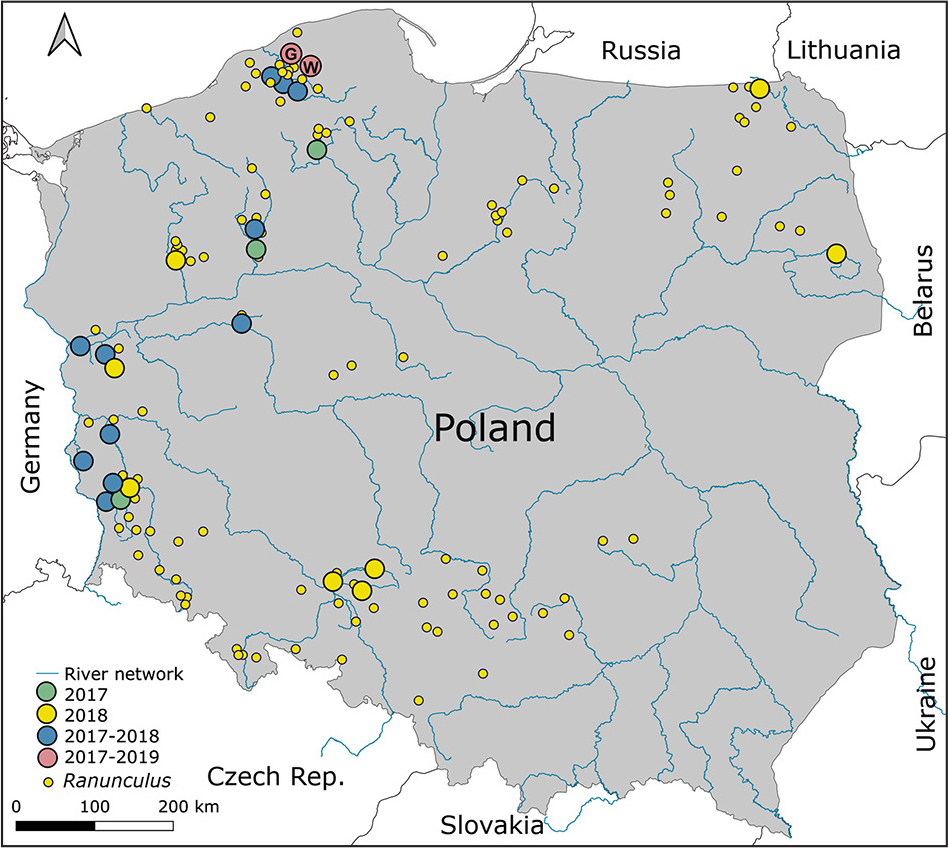
Fig. 2.
Study sites in rivers in Poland. The coloured circles indicate the locations of the one-time survey (in 2017 or 2018), the two-time survey (in 2017 and 2018), and the three-time survey (in 2017, 2018, and 2019). The letters G and W indicate the location of the areas where detailed surveys were carried out in the Glaźna River and Warblewska Struga River.
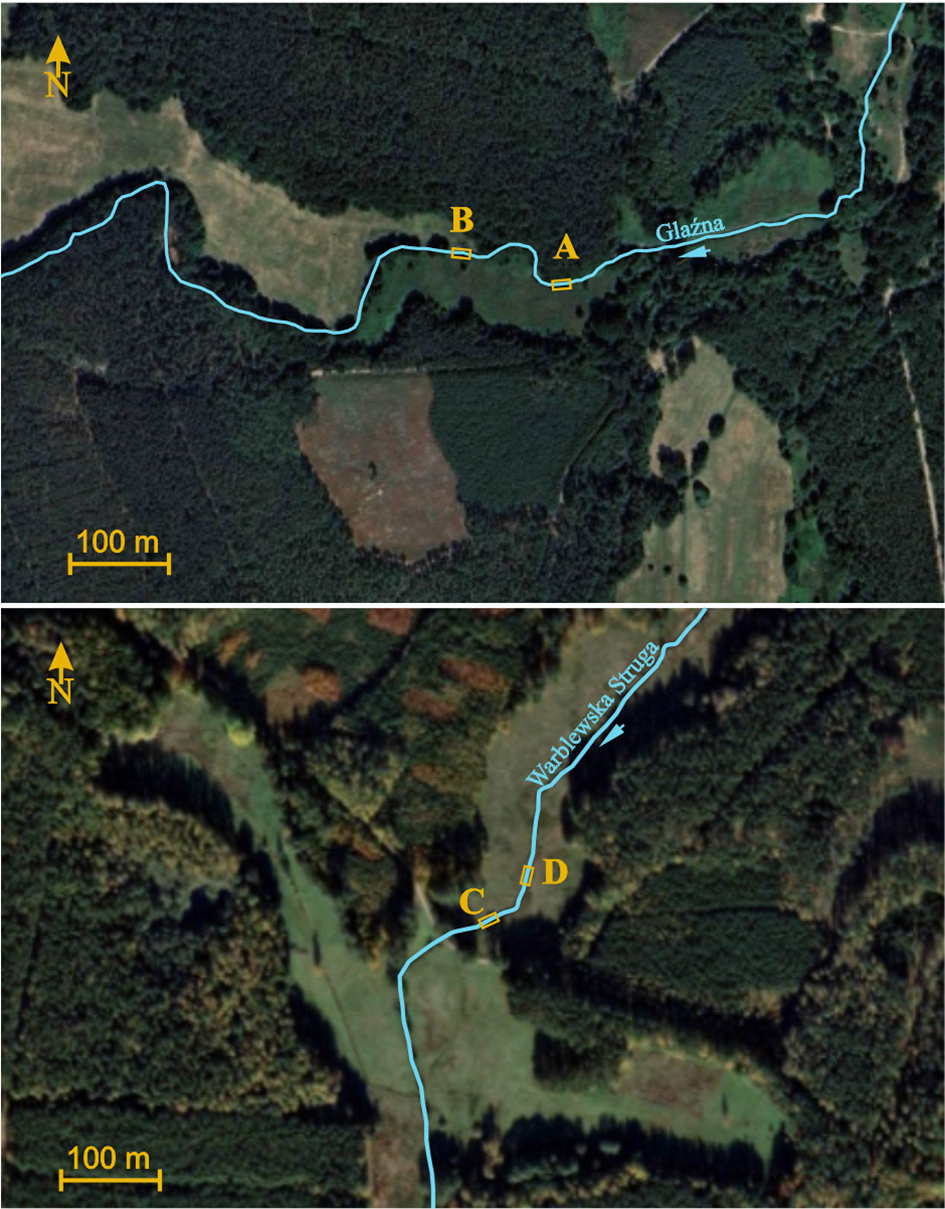
Fig. 3.
Location of testing polygons: A and B in the Glaźna River and C and D on the Warblewska Struga River.
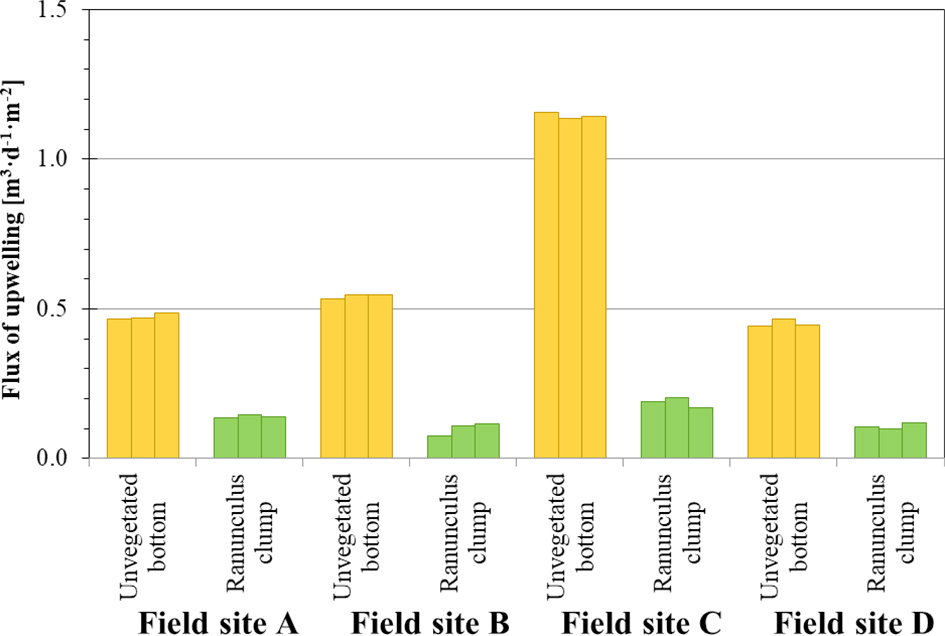
Fig. 4.
Comparisons of upwelling fluxes in unvegetated riverbed and within Ranunculus clumps.
Table 1.
The variation in filtration fluxes in the water crowfoot rivers measured in 2019.
| Year | N | Upwelling flux [m3·d−1·m−2] | |||||
|---|---|---|---|---|---|---|---|
| MIN | AVG | MD | MAX | SD | CV | ||
| 2019 | Unvegetated riverbed | ||||||
| 12 | 0.443 | 0.653 | 0.510 | 0.653 | 0.286 | 2.38% | |
| Ranunculus clump | |||||||
| 12 | 0.077 | 0.135 | 0.127 | 0.205 | 0.036 | 0.30% | |
Table 2.
Results of upwelling flux surveys carried out in 2019 in the water crowfoot rivers.
| The bottom of the river | River | Polygon | Upwelling flux [m3·d−1·m−2] | ||
|---|---|---|---|---|---|
| Unvegetated riverbed | Glaźna | A | 0.467 | 0.470 | 0.487 |
| B | 0.533 | 0.547 | 0.545 | ||
| Warblewska Struga | C | 1.156 | 1.136 | 1.144 | |
| D | 0.443 | 0.467 | 0.447 | ||
| Ranunculus clump | Glaźna | A | 0.137 | 0.147 | 0.140 |
| B | 0.077 | 0.110 | 0.116 | ||
| Warblewska Struga | C | 0.190 | 0.205 | 0.170 | |
| D | 0.107 | 0.100 | 0.118 | ||
Table 3.
The variation of hydraulic gradient in rivers with water crowfoot vegetation measured in 2017 and 2018.
| Hyporheic exchange | N | Hydraulic gradient [cm·cm−1] | ||||||
|---|---|---|---|---|---|---|---|---|
| [–] | [%] | MIN | AVG | MD | MAX | SD | CV [%] | |
| 2017 | ||||||||
| Upwelling | 63 | 67.0 | 0.005 | 0.0538 | 0.0400 | 0.2700 | 0.0569 | 105.7 |
| Neutral | 8 | 8.5 | ||||||
| Downwelling | 23 | 24.5 | –0.245 | –0.0660 | –0.0350 | –0.0050 | 0.0750 | –113.6 |
| 2018 | ||||||||
| Upwelling | 99 | 70.2 | 0.005 | 0.0490 | 0.0350 | 0.3150 | 0.0440 | 91.5 |
| Neutral | 5 | 3.6 | ||||||
| Downwelling | 37 | 26.2 | –0.550 | –0.0800 | –0.0250 | –0.0050 | 0.1420 | –177.0 |
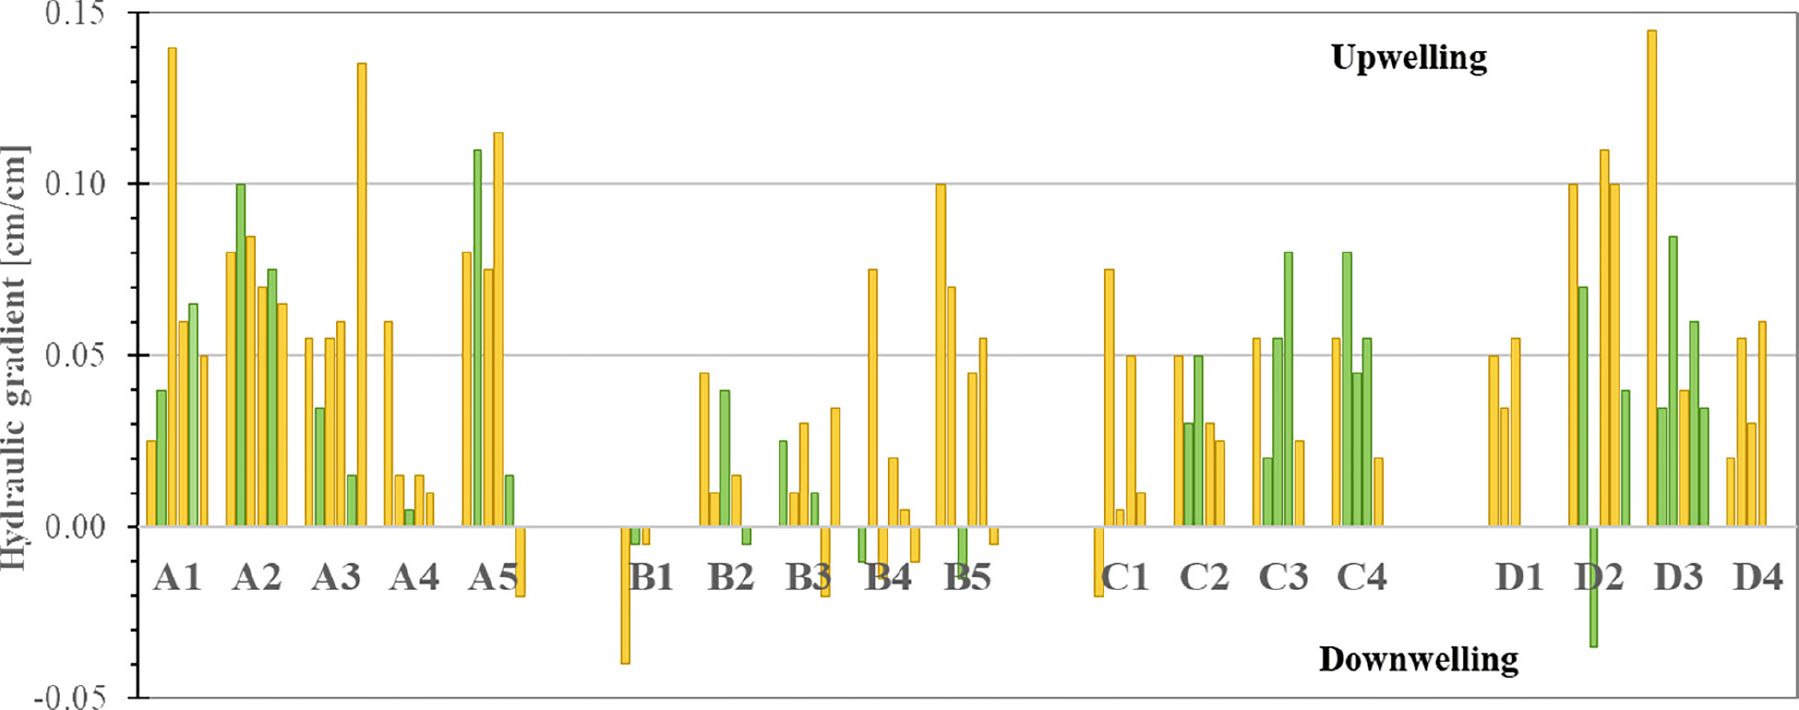
Fig. 5.
Results of gradientometric measurements recorded in 2019 in the unvegetated riverbed (yellow) and Ranunculus clumps (green).
Table 4.
Measured in 2019, the range of variation of hydraulic gradient in rivers with water crowfoot vegetation.
| Hyporheic exchange | N | Hydraulic gradient [cm·cm−1] | ||||||
|---|---|---|---|---|---|---|---|---|
| [–] | [%] | MIN | AVG | MD | MAX | SD | CV [%] | |
| 2019 Unvegetated riverbed | ||||||||
| Upwelling | 54 | 87.1 | 0.005 | 0.052 | 0.053 | 0.145 | 0.0341 | 65.7 |
| Neutral | 0 | 0.0 | ||||||
| Downwelling | 8 | 12.9 | –0.040 | –0.017 | –0.018 | –0.005 | 0.0106 | –62.7 |
| 2019 Ranunculus clump | ||||||||
| Upwelling | 35 | 85.4 | 0.005 | 0.048 | 0.040 | 0.110 | 0.0285 | 59.7 |
| Neutral | 0 | 0.0 | ||||||
| Downwelling | 6 | 14.6 | –0.035 | –0.013 | –0.010 | –0.005 | 0.0103 | –77.1 |
Table 5.
Results of vertical hydraulic gradient studies conducted in 2019 in rivers with water crowfoot (white colour – unvegetated riverbed, green colour – Ranunculus clamps).
| River | Field-site | Cross-section | Hydraulic gradient [cm·cm−1] | |||||
|---|---|---|---|---|---|---|---|---|
| Glaźna | A | A1 | 0.025 | 0.040 | 0.140 | 0.060 | 0.065 | 0.050 |
| A2 | 0.080 | 0.100 | 0.085 | 0.070 | 0.075 | 0.065 | ||
| A3 | 0.055 | 0.035 | 0.055 | 0.060 | 0.015 | 0.135 | ||
| A4 | 0.060 | 0.015 | 0.005 | 0.015 | 0.010 | |||
| A5 | 0.080 | 0.110 | 0.075 | 0.115 | 0.015 | –0.020 | ||
| B | B1 | –0.040 | –0.005 | –0.005 | ||||
| B2 | 0.045 | 0.010 | 0.040 | 0.015 | –0.005 | |||
| B3 | 0.025 | 0.010 | 0.030 | 0.010 | –0.020 | 0.035 | ||
| B4 | –0.010 | 0.075 | –0.015 | 0.020 | 0.005 | –0.010 | ||
| B5 | 0.100 | 0.070 | –0.015 | 0.045 | 0.055 | –0.005 | ||
| Warblewska Struga | C | C1 | –0.020 | 0.075 | 0.005 | 0.050 | 0.010 | |
| C2 | 0.050 | 0.030 | 0.050 | 0.030 | 0.025 | |||
| C3 | 0.055 | 0.020 | 0.055 | 0.080 | 0.025 | |||
| C4 | 0.055 | 0.080 | 0.045 | 0.055 | 0.020 | |||
| D | D1 | 0.050 | 0.035 | 0.055 | ||||
| D2 | 0.100 | 0.070 | –0.035 | 0.110 | 0.100 | 0.040 | ||
| D3 | 0.145 | 0.035 | 0.085 | 0.040 | 0.060 | 0.035 | ||
| D4 | 0.020 | 0.055 | 0.030 | 0.060 | ||||
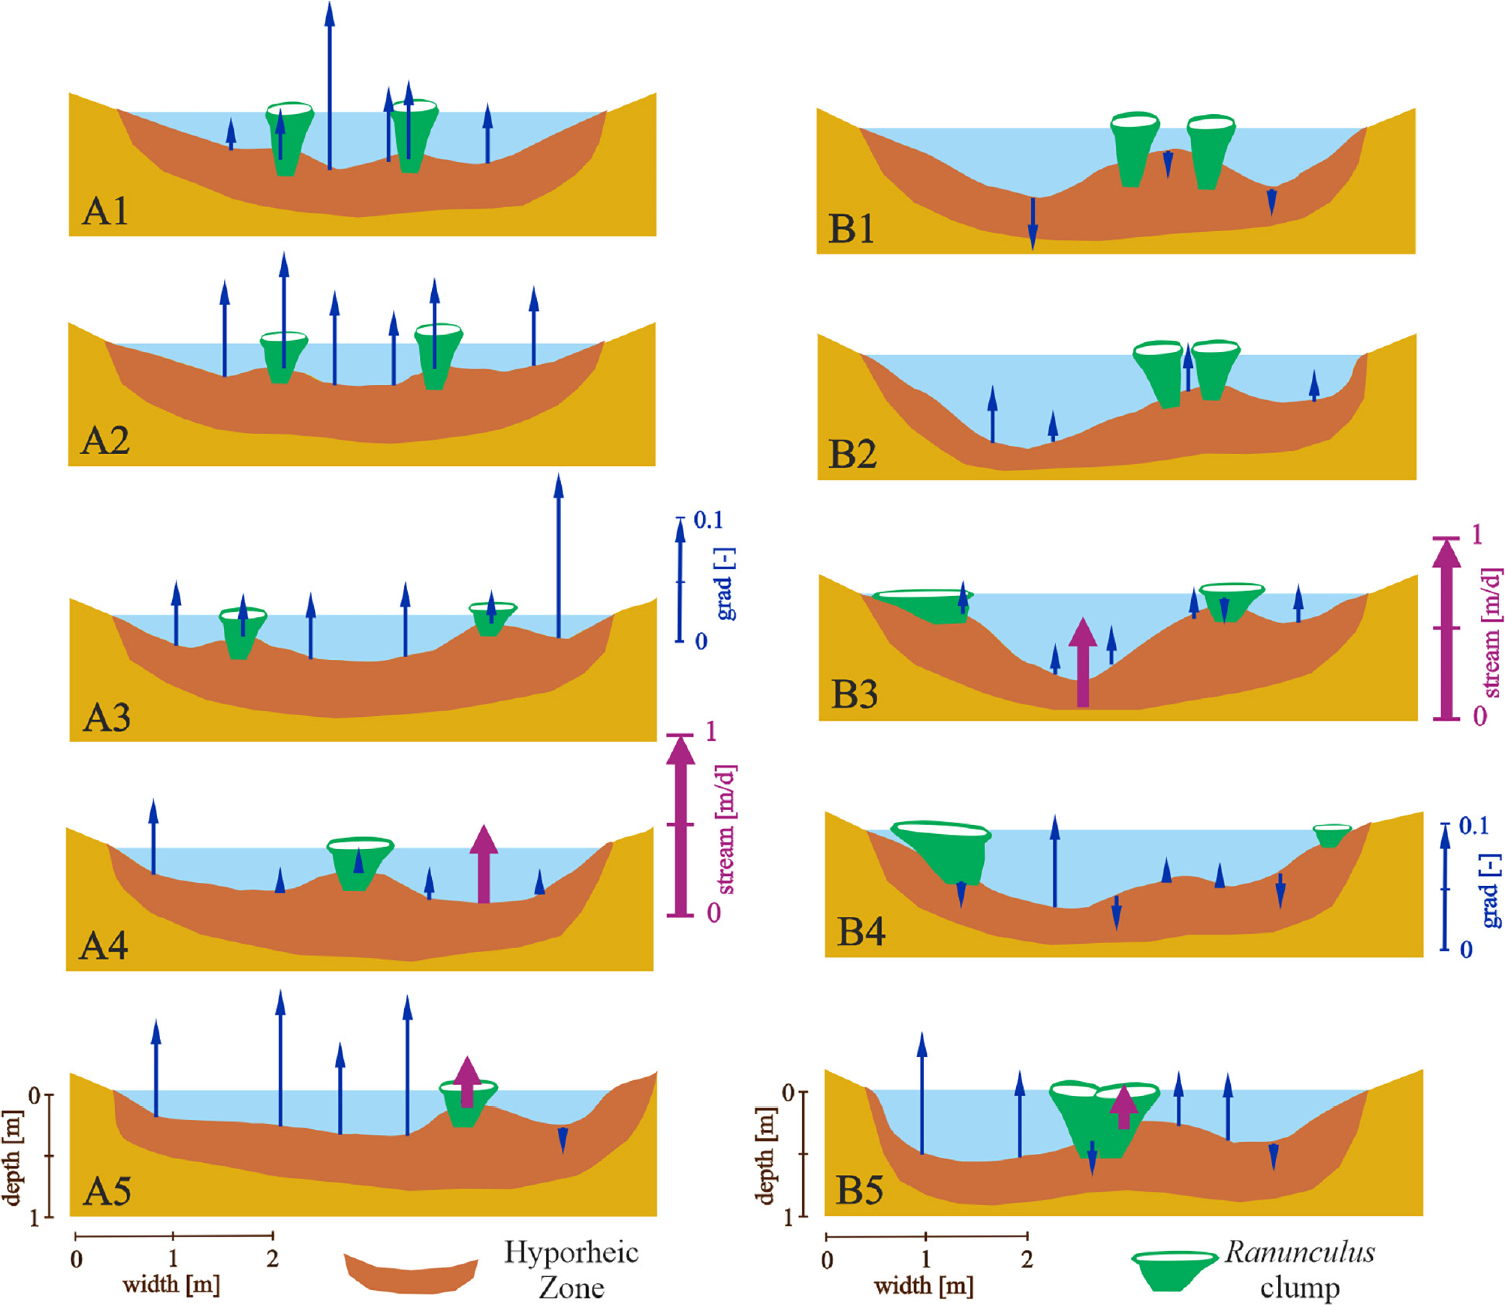
Fig. 6.
Results of filtrometric and gradientometric surveys carried out in 2019 at cross-sections A1, A2, A3, A4, and A5 and cross-sections B1, B2, B3, B4, B5, perpendicular to the current of the Glaźna River.
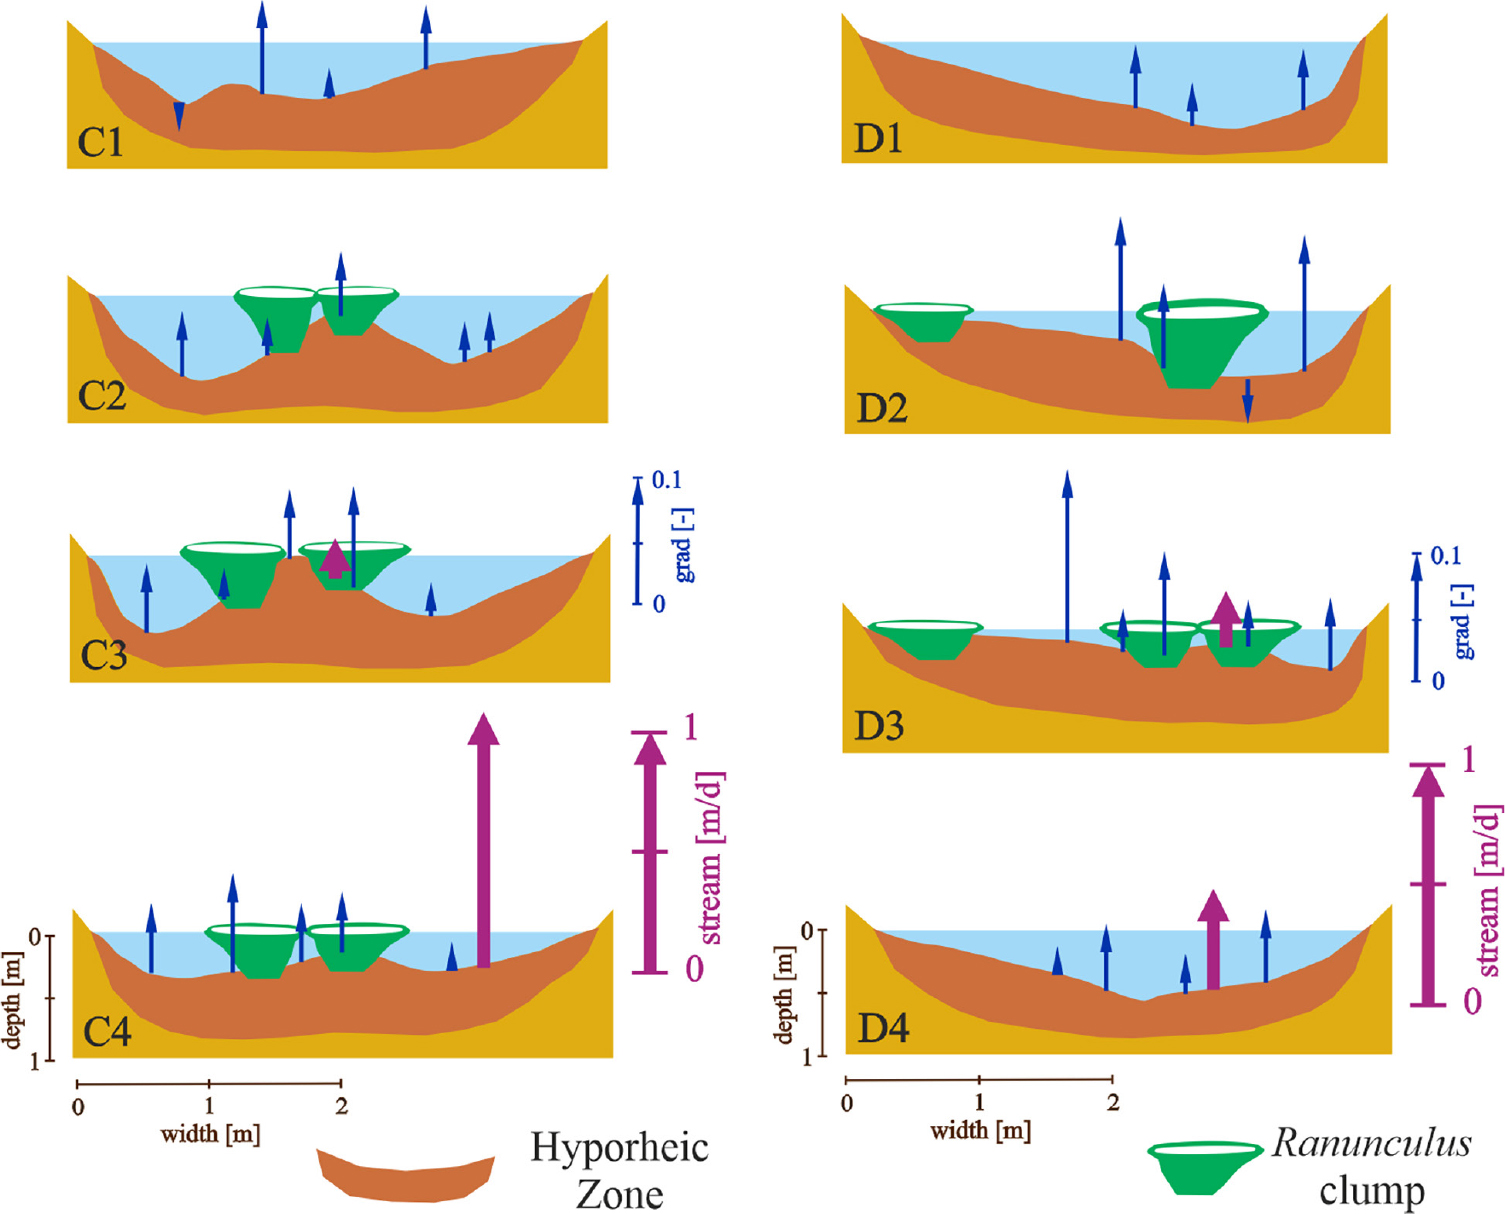
Fig. 7.
Results of filtrometric and gradientometric surveys carried out in 2019, at cross-sections C1, C2, C3, C4 and at cross-sections D1, D2, D3, D4, perpendicular to the Warblewska Struga river current.
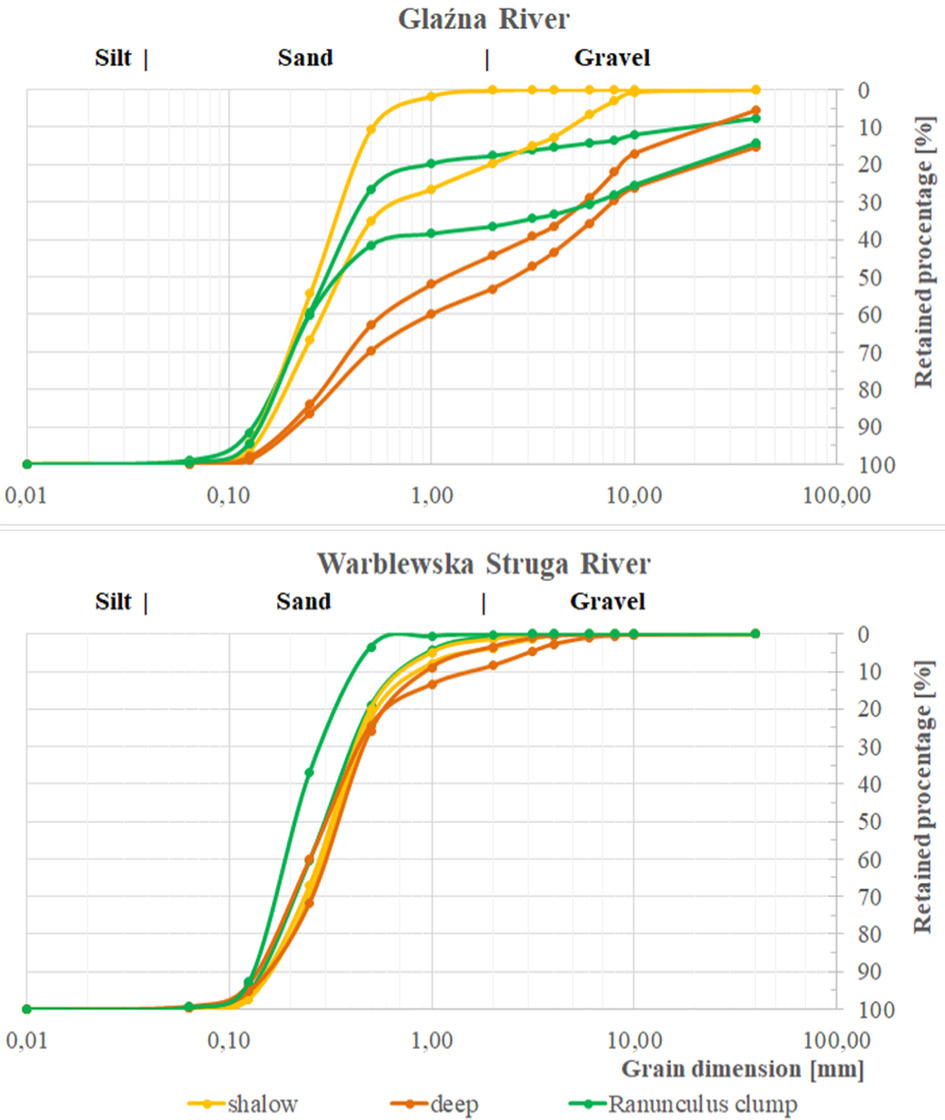
Fig. 8.
Grain size curves of substrate samples taken from the test plots on the Glaźna and Warblewska Struga rivers.