
Introduction
Internal migration significantly influences the redistribution of populations and modifies their socio-demographic and economic composition across regions and within the urban system. The movement of people within a country’s administrative boundaries plays a crucial role in reshaping labour and housing markets, thereby influencing the pathways of societal and economic development (Bell et al. 2015, Smith, Finney 2016, Rees et al. 2017). As Pisarevskaya et al. (2020) emphasise, migration studies have developed a distinct body of knowledge on why people migrate, how migration takes place, and what the consequences are for both migrants themselves and the societies involved in migration processes. Therefore, understanding the patterns and drivers of internal migration is essential for comprehending broader societal transformations. The study of internal migration becomes particularly significant in countries with diverse ethnic compositions, where mobility patterns may differ substantially between the majority and minority populations. Limited geographic mobility among specific ethnic groups may indicate socioeconomic disadvantages or cultural preferences that influence migration decisions (De Haas 2021). These variations in mobility rates across different ethnic groups can elucidate the complex impact of internal migration on demographic shifts, social cohesion, and economic development at both regional and national levels. As Pisarevskaya et al. (2020) note, migration studies have evolved at the crossroads of various disciplines, incorporating insights from sociology, political science, anthropology, geography, economics, and increasingly from health studies, development studies, and governance studies, reflecting the multifaceted nature of migration phenomena. There is increasing scholarly interest in ethnic internal migration across Europe (Finney, Catney 2016, Darlington-Pollock et al. 2019). This interest is driven by the fact that immigration has contributed to greater ethnic diversity within nations. At the same time, internal migration plays a crucial role in redistributing populations across regions and influencing settlement patterns (Stillwell, McNulty 2016, Bernard, Perales 2022). However, knowledge gaps remain.
Latvia presents a particularly interesting case in the study of internal migration patterns across ethnic groups. Since the mid-20th century and throughout the 40 years of the Soviet rule, Latvia has experienced a significant increase in immigrants originating from different parts of the former Soviet Union, accentuating ethnic population diversity across much of the country. There has been keen research interest in ethnic populations (e.g. Aasland, Fløtten 2001, Cara 2010, Nemeth 2013, Nemeth, Dövényi 2019), and relatively little research has been conducted on the internal migration of ethnic groups in Latvia. Consequently, the relatively high proportion of ethnic minorities within the country’s population–comprising primarily Russians, Belarusians, Ukrainians, and Poles, among others–provides a valuable context for examining the intersection of ethnicity and migration patterns within the country. Despite the ethnic diversity resulting from significant population movements throughout history, internal migration along ethnic lines remains to be studied. The demographic landscape of Latvia has been shaped by complex historical processes, including Soviet-era immigration, waves of post-independence emigration, and ongoing depopulation (Dahs et al. 2021, Zvidrins 2021). According to recent demographic data, Latvia’s population continues to experience both international out-migration and internal redistribution, with varying patterns across different ethnic groups (OECD 2024). These demographic shifts have significant implications for regional development, labour markets, and social integration policies. Understanding the ethnic dimension of internal migration is, therefore, crucial for developing effective policy responses to the demographic challenges facing Latvia. Age represents another critical factor in migration decision-making, with mobility propensities typically varying significantly across the life course (Thomas, Dommermuth 2020, Bernard, Kalemba 2022). Young adults generally exhibit higher migration rates associated with education and early career development, whereas families with children and older adults show different mobility patterns related to housing, amenities, and retirement preferences (Carling 2024). Ethnic minorities in Latvia are experiencing a slightly more intense ageing process than the majority population, necessitating a re-evaluation of its impact on the dynamics of internal migration (Krisjane et al. 2023). The intersection of age and ethnicity in migration behaviour remains an underexplored area in migration studies, particularly in the context of the post-Soviet realm, where historical settlement patterns have created distinct ethnic geographies. The geographical dimension of internal migration in Latvia is equally important, with movements occurring between and within urban and rural areas, in particular, Riga’s suburbs, and non-metropolitan regions. The urban system in Latvia, characterised by the predominance of the metropolitan region of the capital city, Riga, alongside a relatively dense network of small towns, provides a distinct spatial context to examine internal migration. Research on migration systems has demonstrated that these geographical structures can exert a substantial influence on migration patterns, thereby facilitating the redistribution of populations across various regions of the state (Rowe et al. 2019).
This research paper examines the ethnic dimension of changes in usual residence using one-year data from the Population Census (2011) and Population Register (2019). Through the analysis of these datasets, this study aims to address the research question: Do the determinants or drivers of migration differ among ethnic groups, as distinguished by age and place of in-migration, within Latvia’s urban system and regions? This question addresses a significant gap in the literature on internal migration in ethnically diverse societies and contributes to a broader theoretical understanding of how structural factors interact with individual characteristics to shape migration decisions. Comprehending population mobility is essential for urban planners, policymakers, and institutions to assess the population dynamics associated with internal migration, thereby facilitating the effective adaptation of public services.
Theoretically, this study engages three strands of migration scholarship. First, the life-course perspective on migration (Thomas, Dommermuth 2020, Bernard, Kalemba 2022) predicts strong age-selectivity in mobility, with peaks in young adulthood when education and labour-market transitions are most concentrated. Second, the literature on ethnic residential mobility and co-ethnic destination concentration (Tammaru et al. 2013, Finney, Catney 2016) predicts that minority migrants are more likely than majority migrants to select destinations with established co-ethnic communities and the associated institutional infrastructure. Third, the structural-economic perspective (Rowe et al. 2019, De Haas 2021) predicts that labour-market and housing-market conditions dominate destination choice irrespective of ethnicity, attenuating co-ethnic concentration effects as economic integration proceeds. Our analysis assesses the relative weight of these mechanisms in the Latvian case and contributes to the small but growing body of work on internal migration in the post-Soviet Baltic context (Kulu, Billari 2004, Leetmaa, Tammaru 2007, Tammaru et al. 2013), where Soviet-era settlement legacies and post-independence economic restructuring have produced distinctive ethnic geographies.
To explain the need for research on ethnic internal migration, we first provide an overview of the geographical distribution and demographic changes of ethnic majority-minority groups in Latvia. In the following sections, we will describe the data sources and methods used, and present the main findings. The discussion and concise conclusion will synthesise the research outcomes concerning internal ethnic migration in Latvia.
Research context: Evolving spatial and temporal patterns of ethno-demographics in Latvia
Latvia represents a compelling case study of ethno-demographic changes in the post-Soviet space, characterised by significant ethnic heterogeneity and complex population dynamics. The country’s demographic composition features a predominant Latvian majority (62.3% as of 2019) alongside a substantial Russian minority (24.9%), as well as other historically established ethnic groups, including Belarusians, Ukrainians, Poles, and Lithuanians. This ethnic mosaic underwent substantial reconfiguration in the post-independence period, with pronounced implications for spatial distribution, age structure, and overall demographic sustainability. A comprehensive examination of Latvia’s ethnic composition between 2000 and 2019, as presented in Table 1, revealed multifaceted demographic trajectories across ethnic groups. The data demonstrated a universal decline across all major ethnic populations, albeit with significant variations in magnitude. While the ethnic Latvian population experienced a 12.7% shrinkage during this period, demographic contraction among ethnic minority groups was substantially more pronounced. The Russian population decreased by 31.9%, with other established minorities exhibiting an even more severe demographic decline: Belarusians (−36.8%), Ukrainians (−32.3%), Poles (−34.8%), and Lithuanians (−33.1%).
Table 1.
Ethnic composition and its changes in Latvia, 2000–2019 (Central Statistical Bureau of Latvia).
| Ethnic group | Total population 2019 | Population change 2000–2019 | Mean age | ||||
|---|---|---|---|---|---|---|---|
| number | % of total | % of ethnic minorities | number | % | 2000 | 2019 | |
| Latvians | 1,196,251 | 62.3 | – | −174,305 | −12.7 | 36.8 | 40.4 |
| Russians | 478,578 | 24.9 | 66.2 | −224,539 | −31.9 | 39.5 | 47.4 |
| Belarusians | 61,418 | 3.2 | 8.5 | −35,719 | −36.8 | 44.7 | 55.4 |
| Ukrainians | 43,062 | 2.2 | 6.0 | −20,572 | −32.3 | 41.9 | 52.5 |
| Poles | 38,818 | 2.0 | 5.4 | −20,680 | −34.8 | 42.0 | 50.9 |
| Lithuanians | 22,340 | 1.2 | 3.1 | −11,085 | −33.1 | 42.3 | 51.0 |
| Other | 79,040 | 4.1 | 10.9 | +29,345 | +59.0 | 36.2 | 24.0 |
| Total | 1,919,507 | −457,555 | −19.2 | 38.2 | 42.5 | ||
This differential rate of population decline has resulted in a subtle but meaningful shift in Latvia’s overall ethnic composition, with the proportion of ethnic Latvians increasing despite their absolute numerical decrease. Concurrently, the category designated as other ethnic groups has demonstrated remarkable growth, expanding by 59.0% between 2000 and 2019, indicating significant recent immigration from third countries. This emergent category comprises primarily recent arrivals from Ukraine and a range of EU and non-EU origins (notably India and Uzbekistan), reflecting Latvia’s gradual integration into wider European labour-mobility flows and the recent labour-migration channels opened to non-EU citizens. Because the demographic profile of this group differs sharply from that of historically established minorities (markedly younger mean age, recent arrivals, and small numbers in any one territorial unit), it is excluded from the binary Latvian/ethnic-minority comparison in the regression models that follow; its internal mobility deserves to be studied with special emphasis in future work.
The demographic transitions evident in Latvia’s ethnic landscape are inextricably linked to pronounced shifts in the age structure. Analysis of mean age data revealed a universal ageing trend across all major ethnic groups, although with significant inter-ethnic variations. While the mean age of ethnic Latvians increased from 36.8 years in 2000 to 40.4 years in 2019, the ageing process has been considerably more accelerated among ethnic minority populations. In stark contrast, the category of ‘other ethnicities’ exhibits a markedly different age profile, with a mean age of just 24.0 years in 2019, representing a substantial decrease from 36.2 years in 2000. This pattern reflects the recent nature of immigration flows contributing to this category, typically comprising younger individuals, and suggests fundamentally different demographic trajectories for emergent ethnic minority communities compared to the established ones.
The spatial distribution of ethnic minorities across Latvia’s territorial units (urban and rural) exhibits pronounced regional variation, as illustrated in Figure 1. The highest concentration of minority populations is observed in Latgale, the eastern region of Latvia, particularly in territories adjacent to Russian, Belarusian, and Lithuanian borders. This spatial pattern reflects historical settlement processes, including the Soviet-era industrialisation and immigration policies. Urban centres demonstrate particularly high levels of ethnic diversity, with the two largest cities, Riga and Daugavpils, featuring minority populations that outnumber ethnic Latvians (52.9% and 79.8% minorities, respectively). Among Latvia’s largest cities, only Valmiera and Jekabpils exhibited minority proportions below the national average of 37.7%, with Valmiera showing a substantially lower concentration.
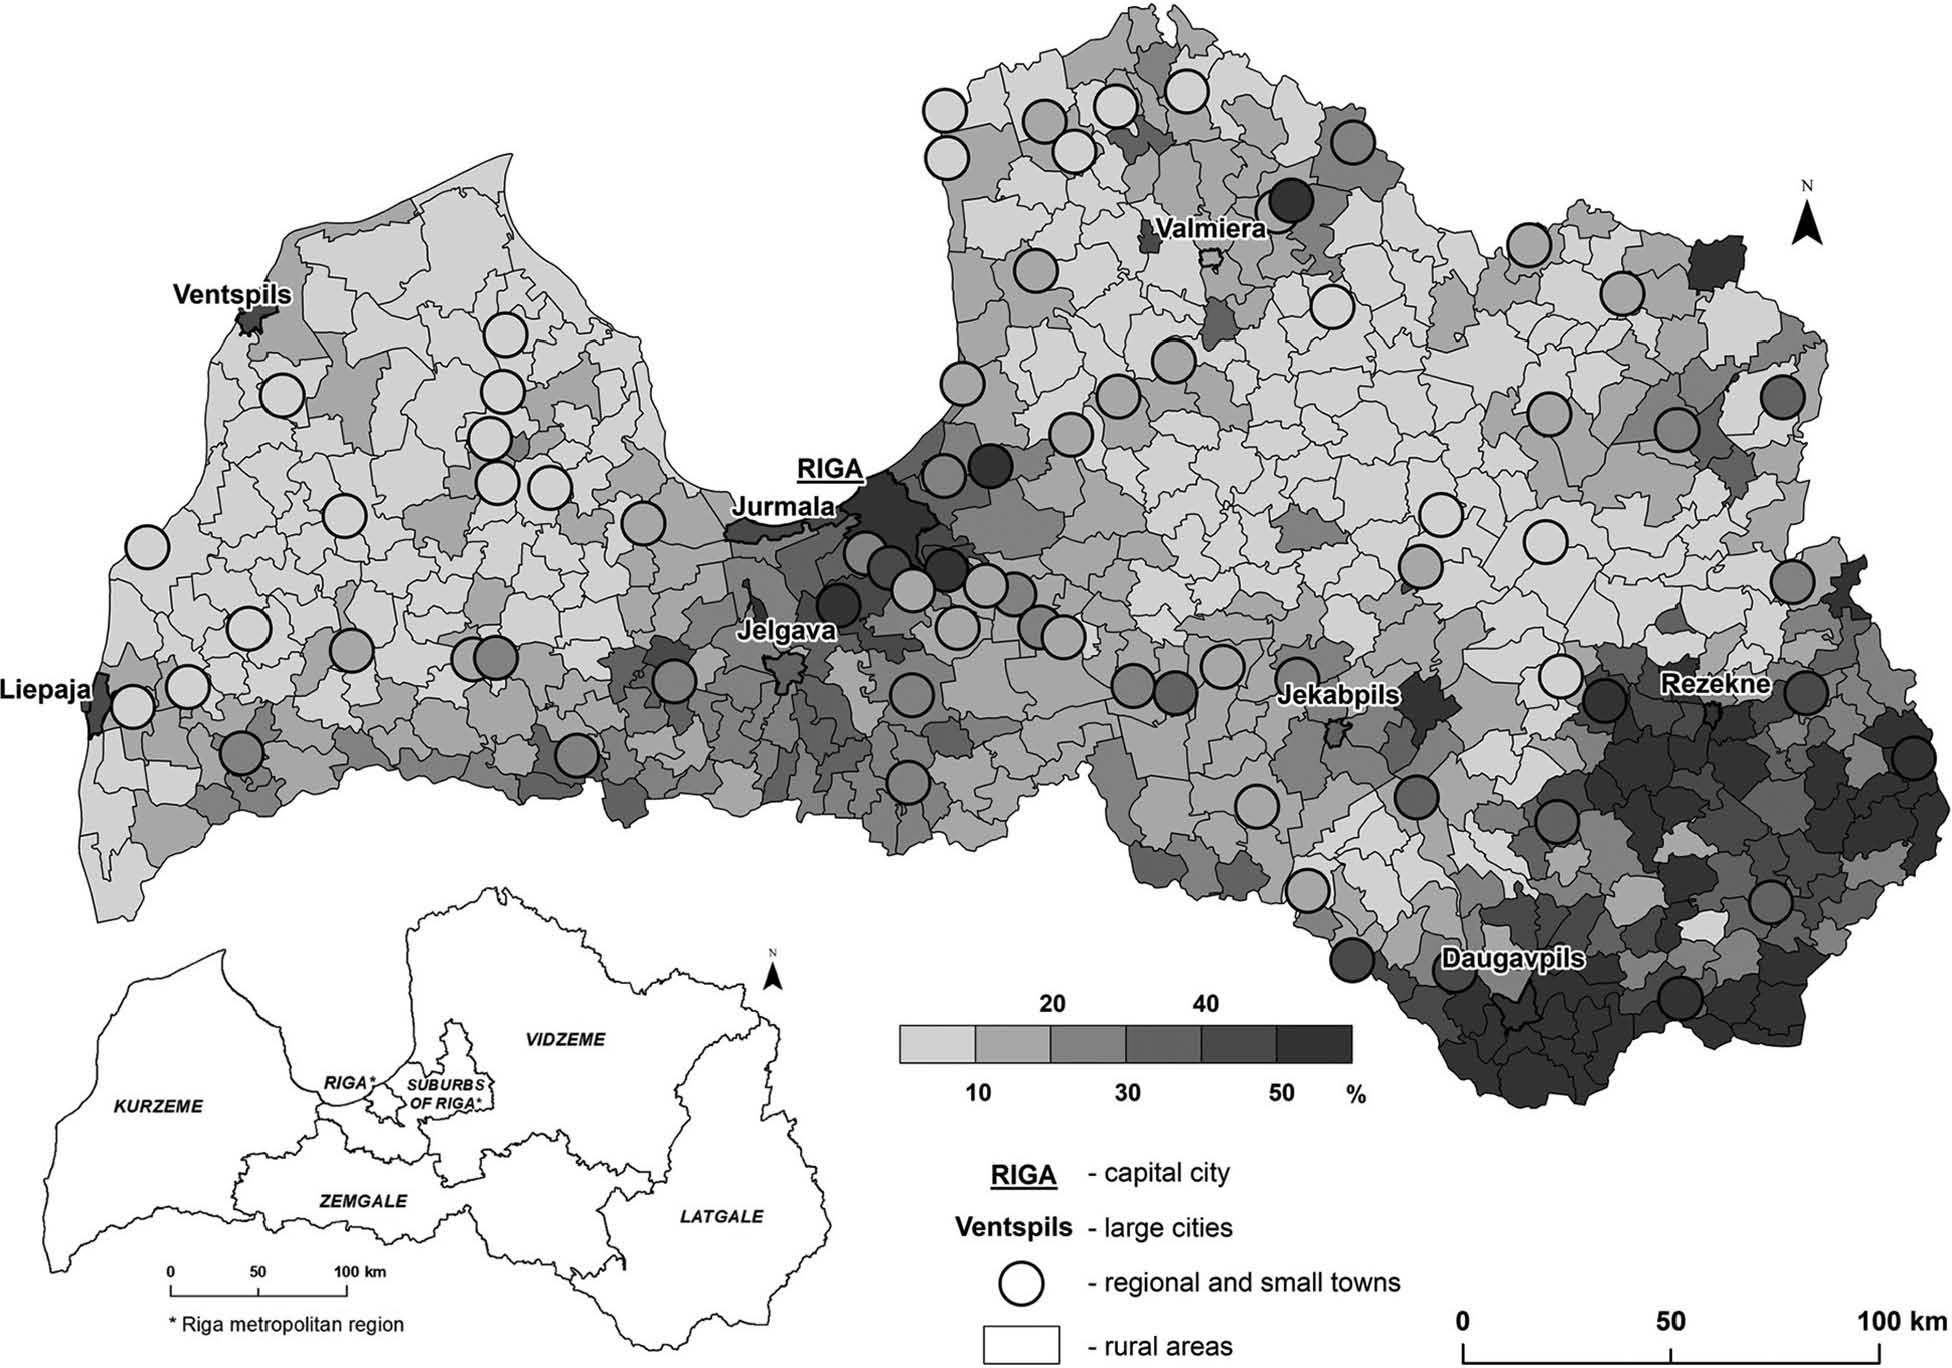
Fig. 1.
The share (%) of ethnic minorities by territorial units (urban and rural) in Latvia (2019) based on data from the Central Statistical Bureau of Latvia.
The temporal dynamics of ethnic population redistribution, as depicted in Figure 2, reveal significant spatial heterogeneity in the changes between 2011 and 2019. Territories proximate to major urban centres, particularly the suburbs of Riga, have experienced notable population growth across all ethnic categories. This pattern suggests that suburbanisation processes are transcending ethnic boundaries, with both Latvian and ethnic minority populations participating in similar patterns of internal migration oriented towards Riga’s suburbs. Conversely, both urban and rural territories distant from major urban centres have witnessed substantial population declines, reflecting the broader centre-periphery dynamics in Latvia’s urban system. This spatial reconfiguration has implications for service provision, economic development, and social cohesion in areas that have experienced significant demographic contraction.
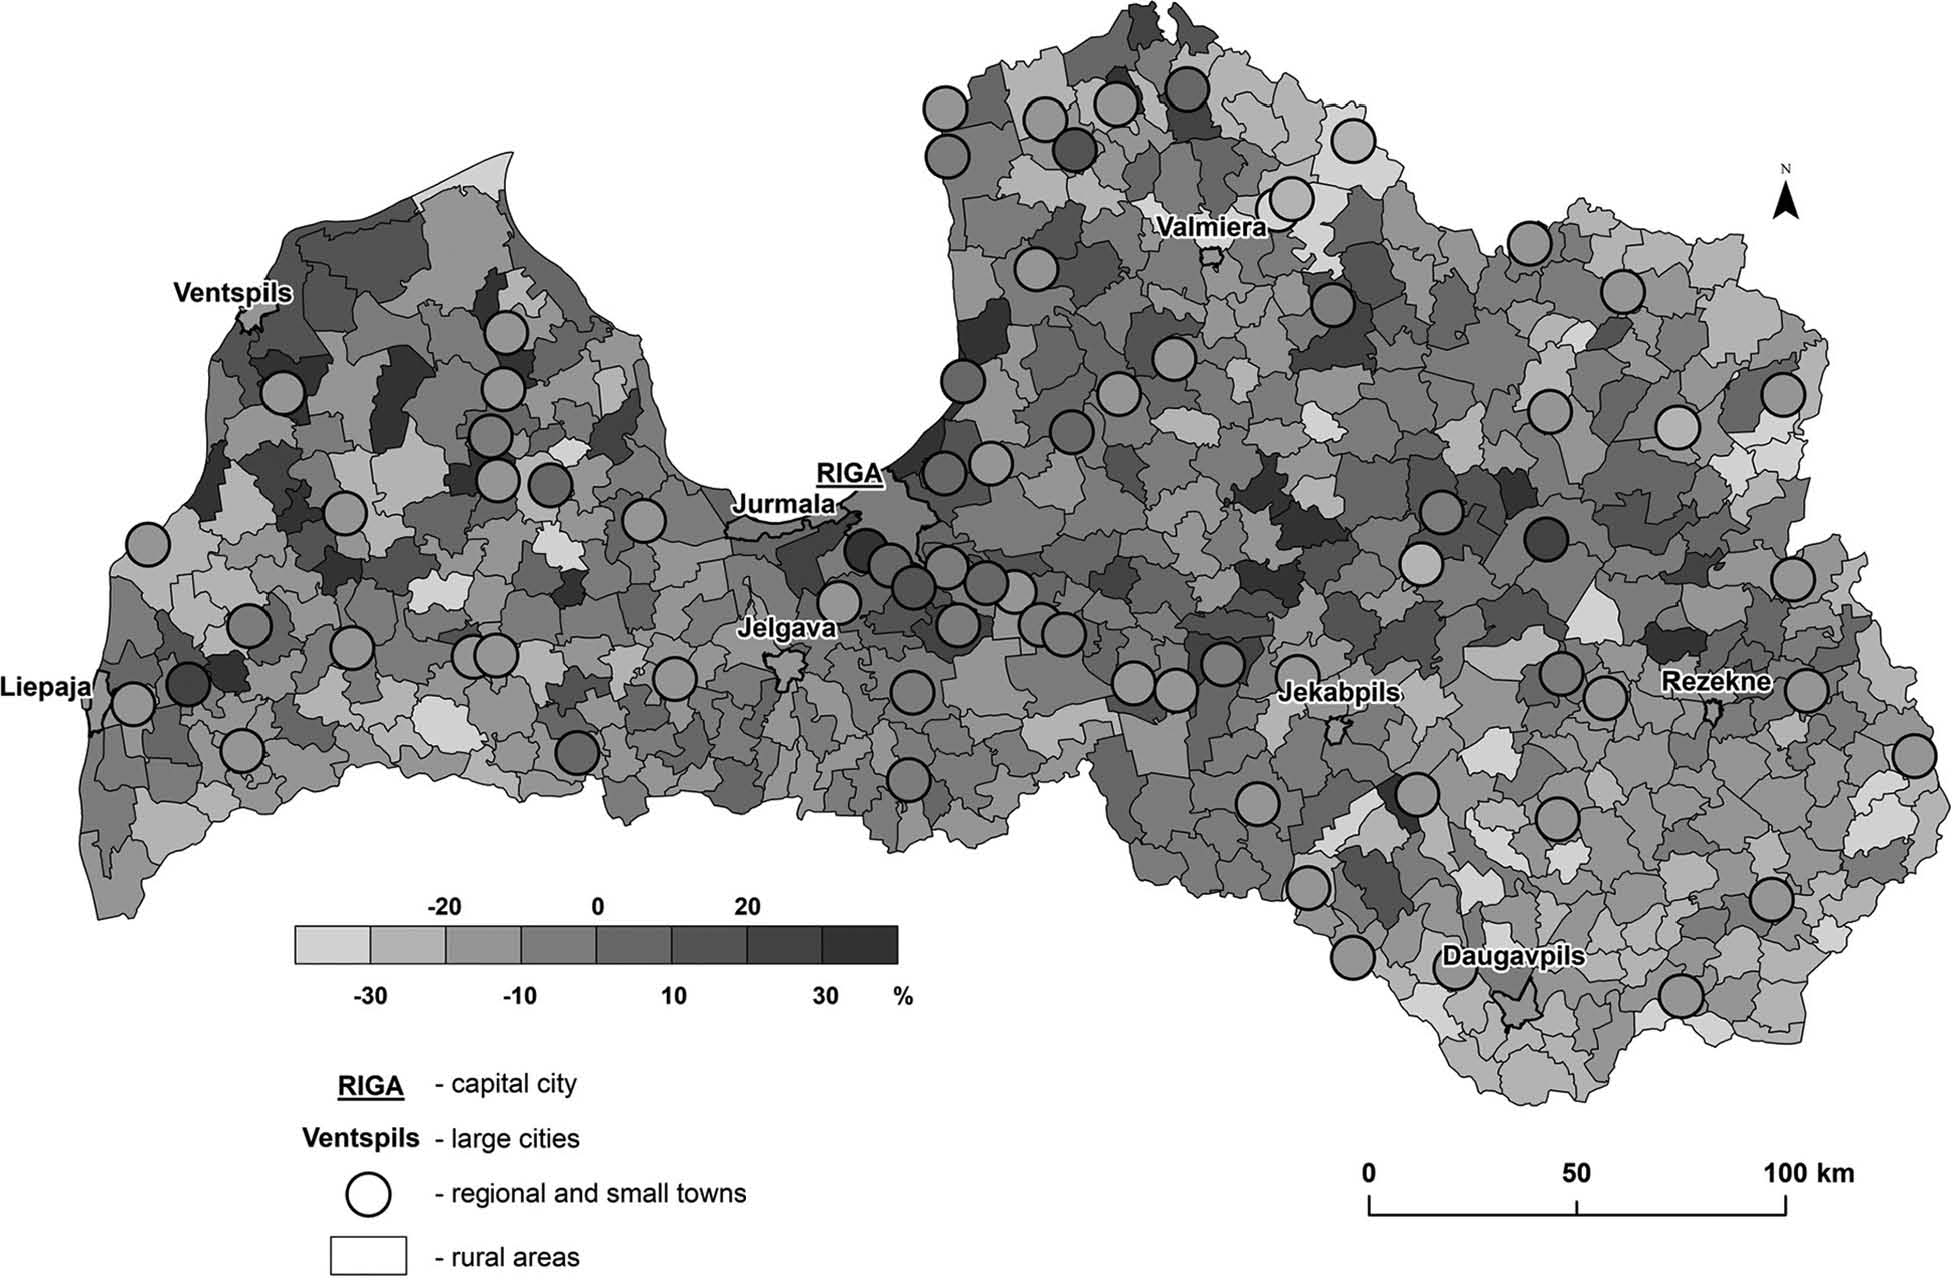
Fig. 2.
Relative population change (100% = 2011) among ethnic minorities by territorial units (urban and rural) in Latvia (2011–2019) based on data from the Central Statistical Bureau of Latvia.
The confluence of age structure transformations and spatial redistribution patterns presents a complex picture of Latvia’s evolving ethno-demographic landscape. The accelerated ageing observed among Slavic minorities (Russians, Belarusians, and Ukrainians) represents a particularly significant demographic challenge, mirroring the patterns documented in Western countries regarding immigrant population ageing (Warnes et al. 2004, Nguyen 2011). As noted by Jimenez et al. (2012), ethnic minorities increasingly constitute the fastest-growing segment of the elderly population in many Western societies. Latvia’s experience demonstrates that similar processes unfolded in the post-Soviet context, albeit with distinctive historical antecedents. The Soviet-era immigrant settlement patterns and subsequent post-independence demographic processes have created a situation where Slavic minorities now exhibit substantially older age profiles than the ethnic Latvian population.
Materials and methods
This study employs individual-level data from the 2011 Population Census and 2019 Population Register to examine spatial and age-related patterns of internal migration across different ethnic groups in Latvia. These datasets were selected because they represent the most reliable sources of population composition at the individual level (Friesen 2020) and contain critical information regarding residents’ ethnicity, age, and place of residence. The 2011 Population Census data included a variable which deals with residents’ change of residence since 2010. Individuals who relocated to different territorial units during this period were classified as internal migrants. For the 2019 Population Register data, a one-year migration analysis was conducted by matching the resident identifiers between 2018 and 2019. Residents whose places of residence changed to another territorial unit between these two observation points were categorised as internal migrants. The population aged 0–14 was excluded from the analysis as tied-movers, as migration patterns for this demographic cohort are primarily dependent on parental decisions rather than independent mobility factors. Following these methodological parameters, the mobile adult group constituted 2.8% of the total population in both observed periods, comprising approximately 47,600 internal migrants in 2011 and 45,000 in 2019 (Table 2). The choice of 2011 and 2019 is data-driven: 2011 was the Latvian census round in which the one-year migration variable was available, and 2019 is the latest pre-pandemic year for which population register identifiers can be matched between t and t-1 to construct a clean one-year migration measure. The eight-year window, therefore, captures internal migration under relatively stable macroeconomic conditions during the post-crisis recovery, while excluding both the immediate disruption of the 2008–2010 crisis and the COVID-19 disruption from 2020 onwards. The territorial units used in the analysis follow the official classification of the Central Statistical Bureau of Latvia and are grouped into five categories of the urban system: the capital city of Riga (1); Riga’s suburbs, defined as the commuting hinterland of the capital city excluding Riga and Jurmala (2); other large cities (Daugavpils, Liepaja, Jelgava, Jurmala, Ventspils, Rezekne, Valmiera, and Jekabpils) (3); regional and small towns, comprising all other territorial units with town status (4); and rural areas (pagasti) (5). For the regional analysis, territorial units are aggregated into the five statistical regions of Latvia: Riga and its suburbs, Zemgale, Vidzeme, Kurzeme, and Latgale.
Table 2.
In-migrants and non-migrants by ethnicity (age group 0–14 excluded).
| 2010–2011 | 2018–2019 | |||||||
|---|---|---|---|---|---|---|---|---|
| In-migrants | Non-migrants | In-migrants | Non-migrants | |||||
| Count (k) | % | Count (k) | % | Count (k) | % | Count (k) | % | |
| Latvians | 33.6 | 3.3 | 999.9 | 96.7 | 32.8 | 3.4 | 943.7 | 96.6 |
| Ethnic minorities | 14.0 | 2.0 | 668.4 | 98.0 | 12.2 | 2.0 | 600.7 | 98.0 |
| Total | 47.6 | 2.8 | 1668.3 | 97.2 | 45.0 | 2.8 | 1544.4 | 97.2 |
To assess the impact of age and geographic factors on internal migration propensity across different ethnic groups, eight binary logistic regression models were constructed. Binary logistic regression was selected as the primary analytical method because of its established application in the social sciences and geography for analysing dichotomous outcomes (Champion et al. 2009, Finney, Simpson 2009, Parra-Casado et al. 2017). This statistical approach is particularly appropriate for migration studies, where the dependent variable represents a binary state (in-migrants versus non-migrants). The regression models incorporated ethnicity as a filter variable, with age and geographic factors serving as covariates, and migration status (in-migrant/non-migrant) as the dependent variable (Table 3). To avoid multicollinearity issues, urban system and region variables were not included in the same regression models, as significant overlap exists between these geographic categories, particularly regarding Riga and its suburban hinterland. The binary logistic regression models were formulated according to the following equation (Greene 2003):
where:
- p(ϒi = 1) is the probability of the event ϒ for resident i being equal to 1;
- β0 is the intercept term (constant);
- βjk are the coefficients associated with each predictor variable.
Table 3.
Binary logistic regression model variables.
| Type | Variable | Group | Regression model no. |
|---|---|---|---|
| Filter variables | Ethnicity | Latvians | all |
| Ethnic minorities | |||
| Dependent variable | Migration status | In-migrants | all |
| Non-migrants | |||
| Covariates (predictor variables) | Age group | 15–19 | all |
| 20–24 | |||
| 25–29 | |||
| 30–34 | |||
| 35–39 | |||
| 40+ | |||
| Urban system | Capital city of Riga | 1; 2; 3; 4 | |
| Suburbs of Riga | |||
| Other largest cities | |||
| Regional & small towns | |||
| Rural areas | |||
| Region | Riga & suburbs | 5; 6; 7; 8 | |
| Zemgale | |||
| Vidzeme Kurzeme | |||
| Latgale |
For each predictor variable, we report the β coefficient (the change in log-odds of migration associated with each category relative to the reference) and the corresponding odds ratio (OR = exp(β)). A negative β (equivalently OR <1) indicates a lower migration propensity than the reference category, while a positive β (OR >1) indicates a higher propensity. Because our data approximate the full resident population rather than a sample, p-values are reported for completeness but should be interpreted as descriptive markers of effect magnitude rather than as inferential tests against sampling error (Mood 2010). For cross-group comparisons, we focus on β coefficients and ORs as the substantive quantities of interest.
The models were systematically applied to different ethnic groups to identify variations in the determinants of migration across Latvia’s diverse ethnic landscape. This methodological approach enables the identification of both universal and ethnicity-specific factors influencing internal migration patterns, with particular attention paid to age and geographic context as potential differentiating variables.
Results
Spatial distribution of population and internal migrants
The urban system has a significant influence on the internal migration patterns among ethnic groups in Latvia. Owing to the population concentration and positive growth in Riga’s suburbs, these territories were distinguished as a specific category in the analysis, separate from the capital city itself. Significant disparities between Latvians and minorities are evident at the rural and small town level, where the proportion of the Latvian population is substantially higher (Fig. 3). Conversely, minority populations demonstrate greater concentrations in Riga, its suburbs, and other major urban centres. A comparative analysis of internal migrants versus the total population reveals distinct patterns across the urban system. The proportion of in-migrants is notably lower in Riga and other large cities, and significantly higher in the capital’s suburbs. Latvian migrants show stronger representation in suburban areas and larger cities than their minority counterparts.
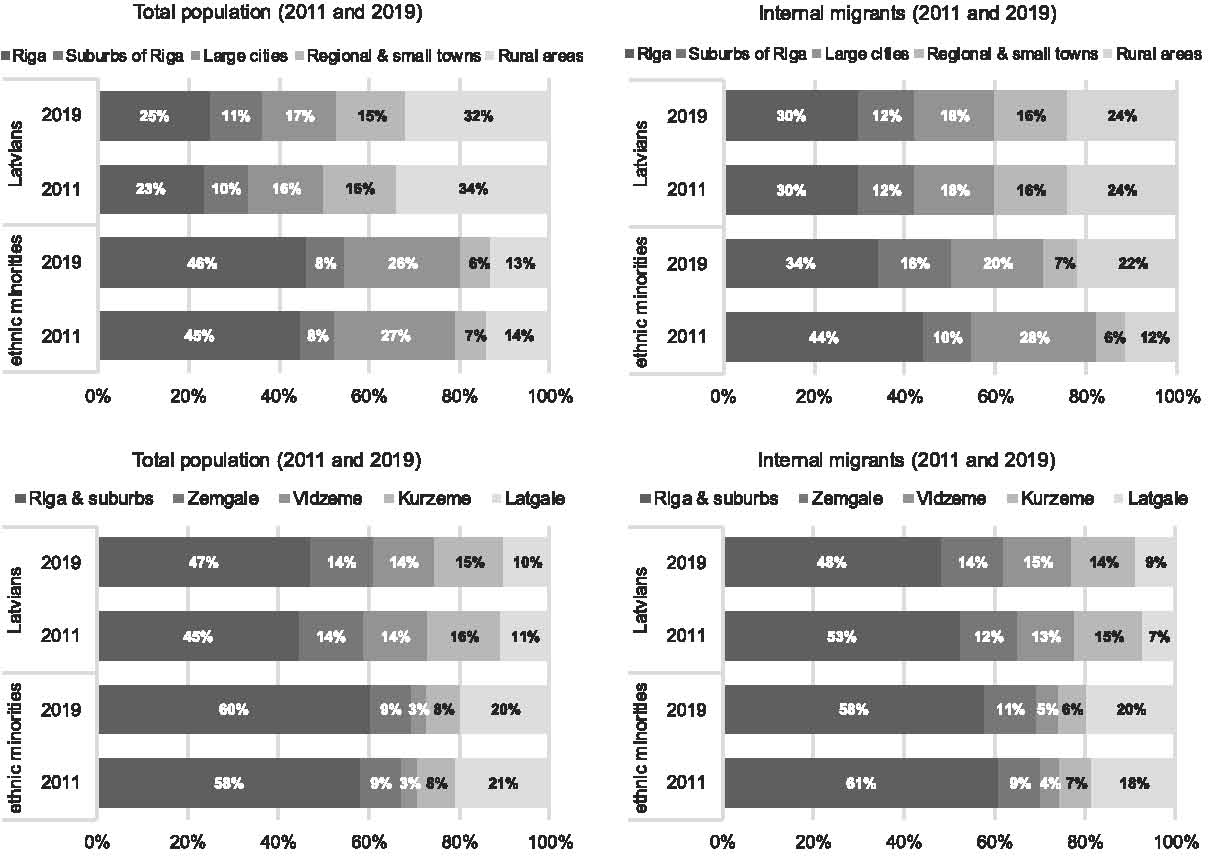
Fig. 3.
Distribution of the total population and internal migrants across the urban system and regions by the majority-minority ethnic groups (2011 and 2019) based on data from the Population Census (2011) and Population Register (2019).
Temporal analysis of internal migration dynamics between 2011 and 2019 indicated subtle differences in settlement patterns between ethnic groups. Minority populations demonstrated lower rates of relocation to Riga and other large cities. However, a higher proportion of minorities migrated to Riga’s suburban areas in 2019, a pattern that parallels the trends observed in the Latvian population since 2011. Additionally, the relative share of Latvian population migration to rural areas increased during this period.
Age-specific migration patterns
Given the distinct age structure among ethnic groups (Table 2), it is essential to examine how age intersects with migration processes. Migration propensities typically vary across age groups, and numerous studies have indicated that the likelihood of migration decreases with age. Young adults demonstrate higher migration rates for employment and educational reasons, whereas older individuals accumulate commitments that increase the complexity of migration decisions, thereby reducing mobility (Stillwell et al. 2008, Elshof et al. 2014, Coulter, Scott 2015) In Latvia, the highest migration propensities for both ethnic groups were observed among young adults aged 19–35 years (Fig. 4). The migration patterns of pre-school-age individuals typically mirror those of young adults, albeit at slightly lower rates, as young children generally accompany their migrating parents. The migration propensity for school-aged (7–18 years old) individuals is considerably lower among Latvians and moderately lower among ethnic minorities.
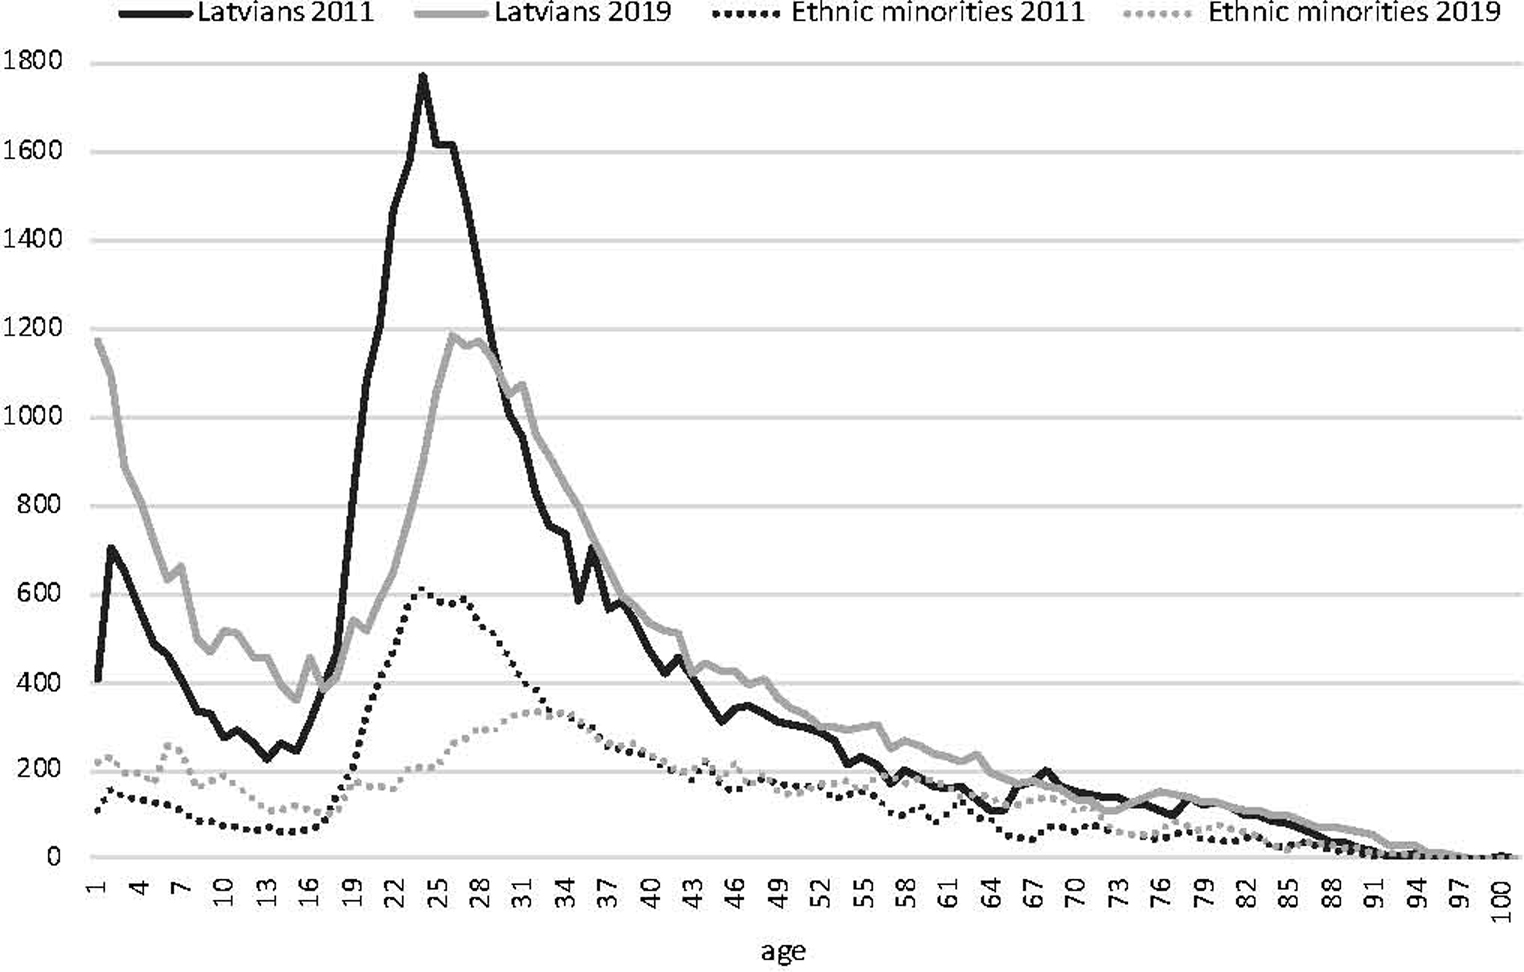
Fig. 4.
Age-specific migration propensities by majority-minority ethnic groups (2011 and 2019) based on data from the Population Census (2011) and Population Register (2019).
A comparative analysis between 2011 and 2019 revealed the most pronounced differentiation in migration propensities among ethnic minority populations. In 2011, migration was predominantly concentrated among those aged 19–35 years, with other age cohorts showing limited mobility. By 2019, however, the migration propensity among pre-working-age minority residents had increased markedly. This shift is consistent with lagged effects of the 2008–2010 economic crisis, during which working-age individuals relocated to major employment centres within Latvia (primarily to the capital city of Riga), although our cross-sectional design cannot establish causation. This trend is also observable, although less pronounced, among Latvian migrants. However, it is noteworthy that the absolute number of internal migration events among the middle-aged and elderly cohorts increased for both ethnic groups between 2011 and 2019.
To assess the differential impact of age, regional differences, and the urban system on internal migration across ethnic groups, binary logistic regression models were conducted separately for the Latvian and ethnic minority groups.
Age effects on internal migration
Age demonstrated similar patterns of influence on migration propensity in both 2011 and 2019. Both ethnic groups exhibit comparable trends, with individuals aged 25–29 years showing a higher likelihood of internal migration among ethnic minorities compared to other age cohorts. Notable differences in regression coefficients are observed between the 20–24-year-old and 30–34-year-old age groups, with the former demonstrating greater migration propensity in 2011 and the latter in 2019. Additionally, the 35–39-year-old age cohort exhibited a higher migration likelihood in 2019 than in 2011. The presence of large coefficient differences (p < 0.01) within the age-group covariate, coupled with minimal disparities between Latvians and minorities, indicates that age is a highly influential factor in migration decisions, transcending ethnic background. This suggests that internal migration in Latvia exhibits stronger age selectivity than ethnicity-based selectivity.
Urban system effects on internal migration
The urban hierarchy significantly influences internal migration patterns. In 2011, the Latvian population demonstrated the highest likelihood of in-migration to the capital city, underscoring Riga’s importance as an economic activity centre, particularly during the global economic crisis (Table 4). By 2019, however, the likelihood of migration had shifted towards regional and small towns and Riga’s suburbs. Notably, Riga’s suburbs exhibit the highest proportion of mobile population among all types of urban systems, while Riga itself has the lowest. Given the characteristics of binary regression (Menard 2009), a smaller percentage of the group of interest (mobile population in Riga) can result in reduced regression coefficients, particularly when internal migration occurs more frequently in other hierarchy groups compared to Riga, specifically suburbs and towns. It should be noted that the town classification included urban areas located within Riga’s suburbs, with the exception of the large city of Jurmala (Fig. 1).
Table 4.
Logistic regression of the likelihood of internal migration, predicted by age group and destination within the urban system (ref. non-migrants Latvians).
| β – internal migrants among Latvians (ref. non-migrants) | |||||
|---|---|---|---|---|---|
| Model 1 (2011) | Model 2 (2019) | ||||
| β coefficient | P | β coefficient | P | ||
| Age | 15–19 | −0.139 | 0.000 | 0.194 | 0.000 |
| 20–24 | 0.914 | 0.000 | 0.754 | 0.000 | |
| 25–29 | 1.000 | (ref.) | 1.000 | (ref.) | |
| 30–34 | 0.543 | 0.000 | 0.845 | 0.000 | |
| 35–39 | 0.102 | 0.000 | 0.531 | 0.000 | |
| 40+ | −0.620 | 0.000 | −0.254 | 0.000 | |
| Urban system | Capital city of Riga | 1.000 | (ref.) | 1.000 | (ref.) |
| Suburbs of Riga | 0.872 | 0.000 | 1.178 | 0.000 | |
| Large cities | 0.807 | 0.000 | 0.940 | 0.007 | |
| Regional & small towns | 0.758 | 0.000 | 1.064 | 0.025 | |
| Rural areas | 0.471 | 0.000 | 0.976 | 0.127 | |
| −2 Log likelihood | 279,745.547 | 276,813.279 | |||
| Nagelkerke R2 | 0.065 | 0.041 | |||
1 Note: Values reported are β coefficients on the log-odds scale. Corresponding odds ratios are obtained as OR = exp(β); e.g., β = 0.914 corresponds to OR ≈ 2.49, and β = −0.620 to OR ≈ 0.54. Because the data approximate the full resident population, p-values are reported for completeness and should be read as descriptive markers of effect magnitude rather than as inferential tests against sampling error (Mood 2010).
For ethnic minority populations (Table 5), all categories of the urban system demonstrated higher regression coefficients than the capital city in 2019, with a significant increase in in-migration likelihood across all urban system categories. This pattern can be attributed to the considerably smaller proportion of one-year migrants in Riga, particularly among ethnic minorities.
Table 5.
Logistic regression of the likelihood of internal migration, predicted by age group and destination within the urban system (ref. non-migrants ethnic minorities).
| β – internal migrants among ethnic minorities (ref. non-migrants) | |||||
|---|---|---|---|---|---|
| Model 3 (2011) | Model 4 (2019) | ||||
| β coefficient | P | β coefficient | P | ||
| Age | 15–19 | −0.183 | 0.000 | 0.180 | 0.000 |
| 20–24 | 0.904 | 0.001 | 0.816 | 0.000 | |
| 25–29 | 1.000 | (ref.) | 1.000 | (ref.) | |
| 30–34 | 0.636 | 0.000 | 0.913 | 0.020 | |
| 35–39 | 0.194 | 0.000 | 0.680 | 0.000 | |
| 40+ | −0.693 | 0.000 | −0.123 | 0.000 | |
| Urban system | Capital city of Riga | 1.000 | (ref.) | 1.000 | (ref.) |
| Suburbs of Riga | 1.090 | 0.000 | 1.428 | 0.000 | |
| Large cities | 0.953 | 0.286 | 1.414 | 0.000 | |
| Regional & small towns | 0.956 | 0.512 | 1.851 | 0.000 | |
| Rural areas | 0.928 | 0.011 | 1.828 | 0.000 | |
| −2 Log likelihood | 129,068.467 | 114,064.836 | |||
| Nagelkerke R2 | 0.059 | 0.052 | |||
1 Note: Values reported are β coefficients on the log-odds scale. Corresponding odds ratios are obtained as OR = exp(β); e.g., β = 0.914 corresponds to OR ≈ 2.49, and β = −0.620 to OR ≈ 0.54. Because the data approximate the full resident population, p-values are reported for completeness and should be read as descriptive markers of effect magnitude rather than as inferential tests against sampling error (Mood 2010).
Regional influences on internal migration
The regional analysis highlighted a general tendency for Latvians to migrate towards Riga city and its suburban hinterland (Table 6), an area predominantly comprising Riga and its proximate territorial units. For all regions, regression coefficients among Latvians differ significantly from the reference group (capital city and its suburbs).
Table 6.
Logistic regression of the likelihood of internal migration, predicted by age group and region of destination (ref. non-migrants Latvians).
| β – internal migrants among Latvians (ref. non-migrants) | |||||
|---|---|---|---|---|---|
| Model 5 (2011) | Model 6 (2019) | ||||
| β coefficient | P | β coefficient | P | ||
| Age | 15–19 | −0.167 | 0.000 | 0.220 | 0.000 |
| 20–24 | 0.895 | 0.000 | 0.762 | 0.000 | |
| 25–29 | 1.000 | (ref.) | 1.000 | (ref.) | |
| 30–34 | 0.544 | 0.000 | 0.853 | 0.000 | |
| 35–39 | 0.096 | 0.000 | 0.556 | 0.000 | |
| 40+ | −0.638 | 0.000 | −0.243 | 0.000 | |
| Regions | Riga & suburbs | 1.000 | (ref.) | 1.000 | (ref.) |
| Zemgale | 0.739 | 0.000 | 0.869 | 0.000 | |
| Kurzeme | 0.807 | 0.000 | 0.930 | 0.000 | |
| Vidzeme | 0.782 | 0.000 | 0.777 | 0.000 | |
| Latgale | 0.515 | 0.000 | 0.624 | 0.000 | |
| −2 Log likelihood | 280,393.782 | 277,992.085 | |||
| Nagelkerke R2 | 0.062 | 0.037 | |||
1 Note: Values reported are β coefficients on the log-odds scale. Corresponding odds ratios are obtained as OR = exp(β); e.g., β = 0.895 corresponds to OR ≈ 2.45, and β = −0.638 to OR ≈ 0.53. Because the data approximate the full resident population, p-values are reported for completeness and should be read as descriptive markers of effect magnitude rather than as inferential tests against sampling error (Mood 2010).
In contrast, minority populations demonstrate a higher likelihood of migration to other regions (Table 7). For both years, minorities exhibited a substantially higher likelihood of relocating to Kurzeme, a western Latvian region characterised by two major cities with substantial minority populations and corresponding infrastructure, including schools and businesses, thereby attracting this demographic group. A closer inspection of within-region flows indicates that ethnic minority in-migration to Kurzeme is concentrated in the two large cities of Liepaja and Ventspils–both of which retain sizeable historically established Russian-speaking populations together with ethnic infrastructure (e.g. schools where language of instruction was Russian, along with cultural organisations), and a business base (e.g. seaports, logistics, and transit companies) oriented towards the eastern hinterland. These mechanisms are jointly responsible for what would otherwise be an unexpected destination preference, given that the Kurzeme region outside its major cities is predominantly inhabited by Latvians. Two other regions, Vidzeme and Latgale, have attracted fewer ethnic minority in-migrants. Latgale, despite having a sizeable minority population, is economically disadvantaged and is experiencing rapid population ageing, thus attracting fewer in-migrants from both ethnic cohorts. Vidzeme, because of its economic limitations, has the smallest minority population among all the regions.
Table 7.
Logistic regression of the likelihood of internal migration, predicted by age group and region of destination (ref. non-migrants ethnic minorities).
| β – internal migrants among minorities (ref. non-migrants) | |||||
|---|---|---|---|---|---|
| Model 7 (2011) | Model 8 (2019) | ||||
| β coefficient | P | β coefficient | P | ||
| Age | 15–19 | −0.174 | 0.000 | 0.227 | 0.000 |
| 20–24 | 0.906 | 0.001 | 0.851 | 0.001 | |
| 25–29 | 1.000 | (ref.) | 1.000 | (ref.) | |
| 30–34 | 0.639 | 0.000 | 0.908 | 0.013 | |
| 35–39 | 0.201 | 0.000 | 0.704 | 0.000 | |
| 40+ | −0.698 | 0.000 | −0.088 | 0.000 | |
| Regions | Riga & suburbs | 1.000 | (ref.) | 1.000 | (ref.) |
| Zemgale | 0.975 | 0.402 | 1.222 | 0.000 | |
| Kurzeme | 1.275 | 0.000 | 1.254 | 0.000 | |
| Vidzeme | 0.858 | 0.000 | 0.695 | 0.000 | |
| Latgale | 0.861 | 0.000 | 0.852 | 0.000 | |
| −2 Log likelihood | 129,127.080 | 117,087.907 | |||
| Nagelkerke R2 | 0.058 | 0.025 | |||
1 Note: Values reported are β coefficients on the log-odds scale. Corresponding odds ratios are obtained as OR = exp(β); e.g., β = 0.914 corresponds to OR ≈ 2.49, and β = −0.620 to OR ≈ 0.54. Because the data approximate the full resident population, p-values are reported for completeness and should be read as descriptive markers of effect magnitude rather than as inferential tests against sampling error (Mood 2010).
The Nagelkerke R2 values for the logistic regression models range between 2.5% and 6.2%, indicating that the models represent approximately this percentage of variance in migration status for Models 1–8. From a population movement perspective, these relatively low values suggest that demographic and socioeconomic characteristics beyond age and geographic destination play crucial roles in shaping internal migration processes. Notably, modest R2 values are common in logistic regression, particularly when predicting binary outcomes (Kleinbaum et al. 2018). There are three considerations that qualify the interpretation of these values. First, when the dependent variable describes a rare event–annual internal migration affects only about 2.8% of the adult population in our data – pseudo-R2 measures are mechanically constrained to low values regardless of how well the model captures the relevant structure (Hosmer et al. 2013). Second, our analytical aim is comparative rather than predictive: we ask whether the β coefficients on age and geographic destination differ between Latvians and ethnic minorities, not whether individual-level migration can be predicted with high accuracy. For this comparative purpose, pseudo-R2 is not the appropriate diagnostic (Mood 2010). Third, the omitted variables that would plausibly raise explanatory power–such as education, employment status and sector, household composition, housing tenure, marital status, presence and age of children, prior migration history, citizenship, and Latvian-language proficiency – are not available in the linked register and census data used here. Their incorporation in future studies, ideally through linked administrative records, would extend rather than overturn the comparative findings reported.
Discussion and conclusion
This study provides a comprehensive analysis of internal migration patterns among different ethnic groups in Latvia, with particular attention paid to the intersecting influences of age and geography. The findings reveal several important dimensions of ethno-demographic migration that contribute to our understanding of the population redistribution processes characterised by substantial ethnic diversity. The results demonstrate that age constitutes a primary determinant of migration propensity across all ethnic groups, with young adults (particularly those aged 25–29 years) exhibiting the highest mobility rates. This pattern aligns with established migration theories positing that migration likelihood decreases with advancing age as individuals accumulate location-specific capital and social ties (Elshof et al. 2014, Coulter, Scott 2015). The pronounced age selectivity observed in our analysis transcends ethnic boundaries, suggesting that lifecourse transitions and associated opportunities and constraints exert a more powerful influence on migration decisions than ethnicity per se. This finding contributes to the broader theoretical discourse on the relative importance of structural versus cultural factors in shaping migration behaviours (De Haas 2021). Nevertheless, our analysis revealed subtle but consistent differences in migration patterns between ethnic groups when examined through geographical and temporal lenses. The spatial distribution of internal migration flows indicates distinct preferences in destination selection between Latvian and ethnic minority populations. While Latvians demonstrate a stronger propensity to migrate towards Riga’s suburbs, ethnic minority groups exhibit a higher likelihood of relocating to regions with established minority communities and corresponding ethnocultural infrastructure, particularly Kurzeme. This pattern resonates with findings from other European contexts, where ethnic minorities often migrate towards areas with pre-existing co-ethnic communities (Stillwell, Hussain 2010, Finney, Catney 2016). The Kurzeme region, excluding the major cities of Liepaja and Ventspils, was predominantly inhabited by Latvians, rendering these findings unexpected. Our findings can be productively compared with the parallel evidence from neighbouring Estonia, the closest analogue case in the post-Soviet Baltic context. Kulu and Billari (2004) document strong age-selectivity in internal mobility in Estonia, with peaks in young adulthood that mirror the age profiles reported here. Leetmaa and Tammaru (2007) describe an early phase of suburbanisation around Tallinn in which ethnic Estonians initially dominated the suburban inflow. Tammaru et al. (2013) extend this picture and show that ethnic Russians in Estonia have been less likely than ethnic Estonians to suburbanise, although the gap is narrowing as economic integration progresses. The Latvian pattern documented here is consistent with this trajectory but appears to be at a more advanced stage: by 2019, suburbanisation around Riga had become a shared cross-ethnic process, with minority populations participating at rates comparable to those of the Latvians. This suggests that the Baltic post-Soviet transition is producing a gradual convergence of intra-metropolitan mobility behaviour across ethnic lines, mediated by labour-market and housing-market integration rather than by changes in ethnic identification per se.
The temporal comparison between 2011 and 2019 reveals an evolving migration landscape with important implications for understanding post-crisis mobility patterns. The shift in migration propensity from younger (20–24-year-old) to slightly older (30–34-year-old) adults suggests a potential delayed effect of the global economic crisis, with individuals postponing migration decisions until greater economic stability was achieved. Additionally, the increased migration propensity among pre-working-age minority residents in 2019 indicates a transition from individual to family migration, contrasting the crisis-period pattern of adults migrating without dependents. This temporal evolution underscores the dynamic nature of migration systems and their responsiveness to macroeconomic conditions (Rowe et al. 2019). The urban system analysis reveals another dimension of ethno-demographic redistribution, with both Latvian and minority populations increasingly participating in suburbanisation processes around Riga. This trend represents a departure from the historical settlement patterns established during the Soviet period, which were characterised by ethnic concentration in urban centres, particularly for minority populations. The convergence of suburbanisation tendencies across ethnic groups suggests that socioeconomic factors and housing preferences may supersede ethnicity-based residential choices in the contemporary Latvian context. This finding contributes to ongoing scholarly discussions on the evolution of ethnic residential patterns in post-socialist urban environments (Nemeth, Dövényi 2019). Regional analysis further illuminates the complex interplay between ethnicity, economic opportunities, and migration decisions. The limited attractiveness of economically disadvantaged regions, such as Latgale, despite their substantial minority populations, indicates that economic considerations frequently outweigh ethnocultural factors in migration decision-making. This pattern aligns with research from other European contexts, demonstrating the primacy of economic drivers in internal migration, even among ethnic minority populations (Darlington-Pollock et al. 2019, Bernard, Perales 2022). The accelerated demographic ageing observed among minority populations in Latvia presents challenges for regional development and service provision. Because Slavic minorities constitute an increasingly older demographic segment, their limited geographic mobility may contribute to the entrenchment of ethnically distinct age structures across regions. This phenomenon parallels patterns documented in Western European countries regarding immigrant population ageing (Warnes et al. 2004, Nguyen 2011) but occurs within the distinctive historical context of Soviet-era immigration and post-independence demographic transitions.
Several implications for policy and planning follow from these findings. The persistent concentration of ethnic minorities in the structurally weakening eastern region of Latgale, combined with their accelerated demographic ageing and limited geographic mobility, points to a growing need for place-based service provision in health, social care, and minority-language education that does not assume residential redistribution will resolve regional imbalances. The cross-ethnic convergence of suburbanisation around Riga raises a different set of issues for metropolitan governance, particularly around the coordination of housing supply, transport, and school capacity across the municipalities of the suburbs of Riga, where rapid in-migration from both ethnic groups places increasing demand on local infrastructure. The minority-led growth of Liepaja and Ventspils, together with selective suburbanisation in peri-Riga Kurzeme, suggests that ethnic-minority mobility is not simply a story of decline in peripheral regions but also of selective concentration in a small number of secondary urban centres – a pattern that warrants targeted investment in those cities rather than uniform peripheral support. Finally, the differential ageing trajectories observed across ethnic groups argue for disaggregated demographic projections at regional level, since aggregate national figures mask the rapid ageing of historically established minorities in particular places.
This study examined the ethnic dimension of internal migration in Latvia, with particular attention to the influences of age and geography. Our analysis of individual-level data from the 2011 Population Census and 2019 Population Register reveals that while age constitutes the primary determinant of migration propensity across all ethnic groups, subtle but consistent differences exist in the spatial patterns and temporal evolution of migration flows between Latvian and ethnic minorities. The findings demonstrate that internal migration in Latvia exhibits stronger age selectivity than ethnicity-based selectivity, with young adults demonstrating the highest migration rates, regardless of ethnic background. Nevertheless, destination preferences differ between ethnic groups, with Latvians showing a greater propensity to migrate towards Riga’s suburbs, while ethnic minorities exhibit a higher likelihood of relocating to regions with established minority communities and corresponding infrastructure. A temporal comparison between 2011 and 2019 indicates an evolution from crisis-period individual migration to family migration patterns, particularly among minority populations. Additionally, both Latvian and ethnic minority groups increasingly participate in suburbanisation processes around the capital city of Riga, suggesting a convergence in residential preferences that transcends ethnic boundaries. Taken together, these findings speak to the three theoretical strands introduced earlier: (1) they confirm the life-course perspective on age-selective mobility, (2) partially support the co-ethnic concentration thesis (most clearly in Liepaja and Ventspils), and (3) align with the structural-economic perspective in showing that economic considerations and metropolitan housing dynamics increasingly override historical ethnic-residential divides. The results underscore the complex interplay between life-course transitions, economic opportunities, ethnocultural considerations, and geographic context in determining migration behaviour. In conclusion, this study advances our understanding of ethnic internal migration dynamics in the post-Soviet context, demonstrating both commonalities and distinctions in migration patterns across ethnic groups. The findings suggest that while ethnicity continues to influence spatial mobility patterns in Latvia, its effects have been moderated by age, economic considerations, and evolving residential preferences over the past decade.
Acknowledgements
The authors are grateful to both anonymous reviewers for their constructive and valuable comments on an earlier version of the manuscript and to the editorial team for the guidance throughout the review process and remarks that helped to improve the quality of this paper.
Notes
[5] Contributed by Authors’ contributions
MB: conceptualisation, methodology, formal analysis, investigation, writing – original draft, writing – review & editing; JK: methodology, visualisation, investigation, writing – original draft, writing – review & editing.
[6] Conflicts of interest Conflict of interest
The authors declare no conflict of interest.