
Introduction
The building height in cities is a key issue in urban geography and, more importantly, in urban planning, where it is the focus of intensive theoretical and practical research worldwide. As cities become increasingly overpopulated and availability of land for development diminishes, architects and urban planners are compelled to seek innovative solutions to maximise the use of available space (Pacione 2009, Lang 2017).
The building height in cities not only shapes the urban skyline but also influences social interactions, sustainability, and urban ecosystems. Tall buildings can alter urban microclimates by affecting ambient temperature, humidity, and energy use efficiency. However, excessive building heights may also lead to challenges such as increased shading, reduced access to natural light, and elevated noise levels – factors that raise concerns about residential comfort and liveability (Słodczyk, Klimek 2004, Zielonko-Jung, Marchwiński 2007, Sosnowski 2022, Cai et al. 2025).
The socio-economic context plays an important role in determining building height. In many cities, height restrictions are influenced not only by aesthetic concerns but also by goals related to sustainable development and the preservation of historic urban fabric (Januchta-Szostak et al. 2023). Additionally, evolving social preferences – such as mobility, access to green spaces, and the availability of diverse services – affect decisions regarding the design of tall buildings (Lamprecht 2016). As a result, variations in the average height of buildings across cities within the same country reflect more than just architectural or regional traditions. They also embody a complex interplay of socio-economic and political factors that shape urban spaces (Cieślińska 2019). Ultimately, building height is the product of multifaceted urbanisation processes that respond to local needs, land availability, and spatial planning regulations (Kostrzewska 2013, Stawasz 2016, Andrzejewska 2021, He et al. 2024).
In Poland, the diversity of building heights is often apparent in cities with differing histories and functions. For example, towns with a well-preserved traditional urban structure, such as Zamość, are characterised by low-rise buildings, whose modest scale facilitates the preservation of historical architectural features. In contrast, major metropolitan areas that serve as administrative and cultural roles typically feature taller buildings, reflecting both dynamic growth and the need to make more intensive use of space. Differences in building heights may also result from urban policies shaped by distinct local or regional priorities (differentia specifica), including historical and contemporary environmental conditions, social legacy of historical experiences, cultural attitudes, and the intellectual capital of local communities (Dembicka-Niemiec 2017).
A distinct category of urban centres in Poland consists of former provincial capitals that lost their administrative status following the 1999 administrative reform (Fig. 1). The factors influencing the spatial development of these cities, including the form and height of buildings, are both complex and multifaceted. On the one hand, their urban morphology was determined by historical and cultural conditions which differed across regions. On the other hand, a decisive influence on their contemporary development came from the economic policy of the 1970s, when the designation of these cities as provincial capitals intended to mitigate regional spatial disparities (Węcławowicz et al. 2010). In the light of the above, the following research question was posed: What are the spatial, socioeconomic, and historical determinants of building height variation in former provincial capitals in Poland and does the average building height show a systematic east-west gradient?
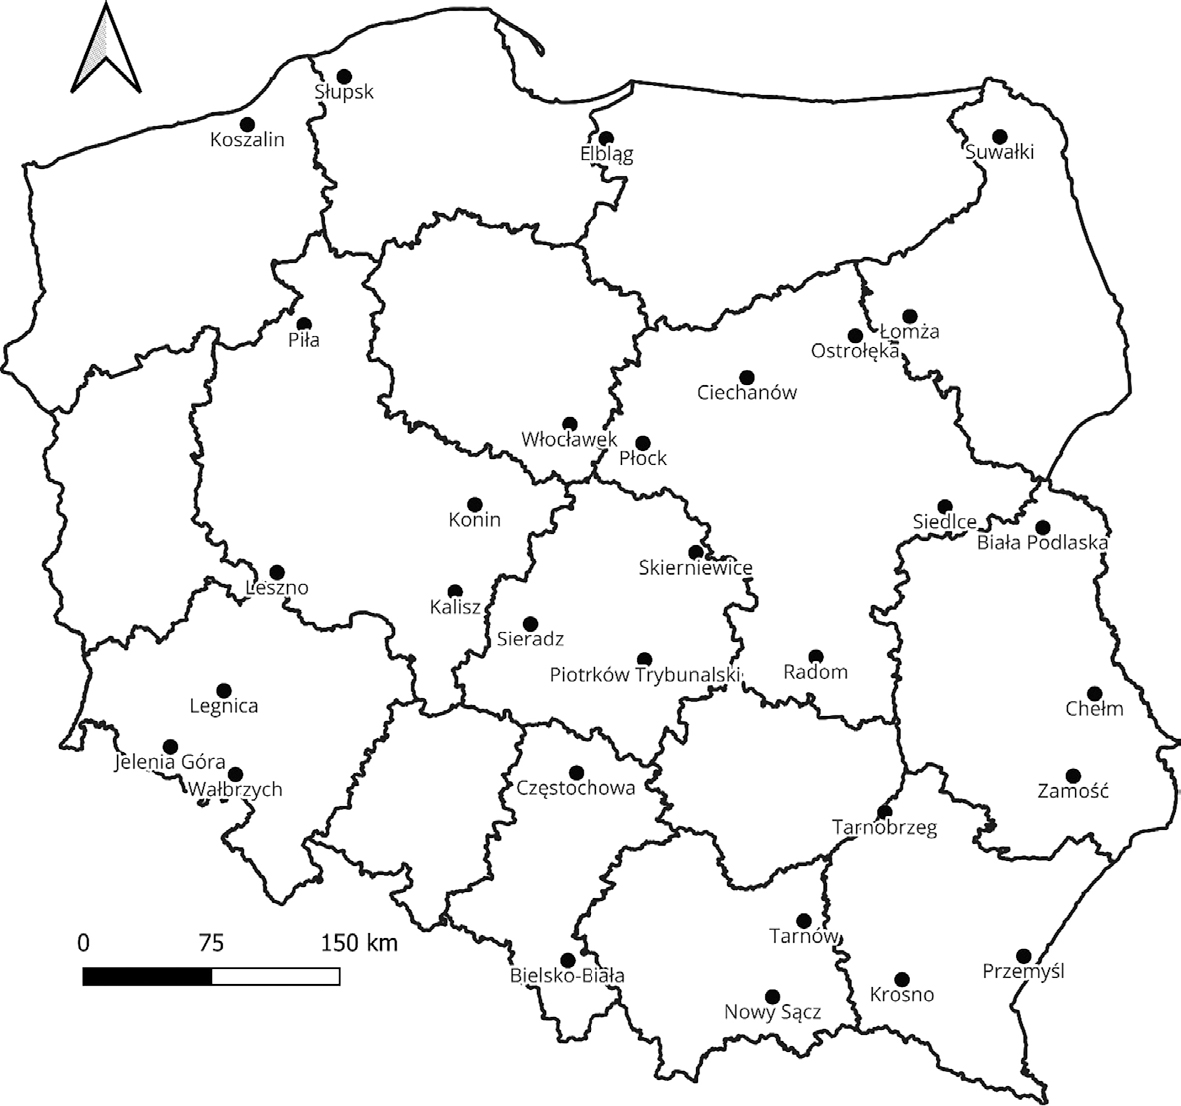
Fig. 1.
Provincial capital cities in 1975–1998.
For most of these medium-sized urban centres – currently with populations between 20,000 and 100,000 (with notable exceptions of larger cities such as Częstochowa, Radom, Bielsko-Biała, Elbląg, Płock, Tarnów, and Koszalin) – administrative promotion served as a significant driver of development (Fonżychowski 2022). However, in most cases, the loss of provincial capital status slowed this momentum when compared to the trajectories of the newly designated regional capitals (Kurniewicz, Swianiewicz 2016). At present, these former provincial cities experience limited urban pressure for vertical intensifcation. This can be largely attributed to the relatively high availability of investment land, limited demand for high-rise construction, and the elevated costs associated with such projects. Additionally, legal regulations – particularly those setting maximum development parameters – constitute a signifcant constraint, effectively curbing vertical growth in the urban centres under study.
Despite numerous similarities in the course of urban development processes and phenomena, key elements of the physical-geographical (natural), socio-economic, and cultural structure of space have had a signifcant impact on building height (Zioło 2011). Based on this premise and walking surveys conducted in 2024–2025, a hypothesis was formulated that the average building height in former provincial cities in Poland may increase along an east-to-west gradient. In the light of this hypothesis, the following algorithm was adopted:
Average building heights in all former provincial capitals were calculated,
The cities were classifed based on average building height profiles,
Spatial analysis was applied to the results, and
Selected variables – which could have influenced the height of buildings – were tested.
Materials and methods
Digital resources
The set of cities selected for analysis includes a group of urban centres in Poland that lost their former status as provincial capitals following the 1999 administrative reform – a total of 31 cities, as indicated in tables (Tables 1, 2, and 4). To examine their urban structure, and in particular to determine the average building height, data from airborne laser scanning (ALS LiDAR) were utilised along with GIS data available from the BDOT10k topographic object database.
Table 1.
Cities covered by the study: number of buildings, location of centres, DSM/DTM resources used.
| City | Number of buildings | Centres coordinates [PUWG1922] | DSM | DTM | |||
|---|---|---|---|---|---|---|---|
| X | Y | Date | Grid | Date | Grid | ||
| Biała Podlaska | 15,099 | 782432.0 | 471095.0 | 2023-09-27 | 1.0 | 2023-09-27 | 0.5 |
| Bielsko-Biała | 34,949 | 503072.0 | 217090.0 | 2024-04-30 | 1.0 | 2024-04-30 | 0.5 |
| Chełm | 11,902 | 812873.0 | 372397.0 | 2023-09-28 | 1.0 | 2023-09-28 | 0.5 |
| Ciechanów | 9954 | 608917.0 | 558612.0 | 2024-08-15 | 1.0 | 2023-09-10 | 0.5 |
| Częstochowa | 48,958 | 507974.0 | 327241.0 | 2024-04-29 | 1.0 | 2024-04-29 | 0.5 |
| Elbląg | 12,779 | 525705.0 | 699419.0 | 2023-09-06 | 1.0 | 2023-09-06 | 0.5 |
| Jelenia Góra | 13,914 | 270472.0 | 342438.0 | 2024-07-06 | 1.0 | 2024-07-06 | 0.5 |
| Kalisz | 19,985 | 437179.0 | 433287.0 | 2024-09-04 | 1.0 | 2024-09-04 | 0.5 |
| Konin | 13,491 | 449103.0 | 483132.0 | 2024-09-01 | 1.0 | 2024-09-01 | 0.5 |
| Koszalin | 14,876 | 316198.0 | 706579.0 | 2024-09-23 | 1.0 | 2024-09-23 | 0.5 |
| Krosno | 11,593 | 699356.0 | 206596.0 | 2024-05-27 | 1.0 | 2023-05-01 | 0.5 |
| Legnica | 12,305 | 301731.0 | 375047.0 | 2024-03-26 | 1.0 | 2024-03-26 | 0.5 |
| Leszno | 13,804 | 332962.0 | 444684.0 | 2024-09-04 | 1.0 | 2024-09-04 | 0.5 |
| Łomża | 9073 | 705858.0 | 594847.0 | 2024-06-27 | 1.0 | 2023-10-03 | 0.5 |
| Nowy Sącz | 19,009 | 622104.0 | 196668.0 | 2024-06-21 | 1.0 | 2023-05-01 | 0.5 |
| Ostrołęka | 9834 | 671859.0 | 582960.0 | 2024-07-20 | 1.0 | 2023-10-03 | 0.5 |
| Piła | 10,567 | 348636.0 | 589686.0 | 2024-09-17 | 1.0 | 2024-09-17 | 0.5 |
| Piotrków Trybunalski | 16,758 | 548400.0 | 393745.0 | 2024-04-09 | 1.0 | 2024-04-09 | 0.5 |
| Płock | 18,033 | 546460.0 | 520109.0 | 2023-09-12 | 1.0 | 2023-09-12 | 0.5 |
| Przemyśl | 9518 | 771263.0 | 219576.0 | 2024-06-16 | 1.0 | 2023-09-05 | 0.5 |
| Radom | 41,120 | 648989.0 | 395108.0 | 2023-09-09 | 1.0 | 2023-09-09 | 0.5 |
| Siedlce | 14,560 | 724350.0 | 483060.0 | 2023-09-08 | 1.0 | 2023-09-08 | 0.5 |
| Sieradz | 10,664 | 481865.0 | 414249.0 | 2024-04-27 | 1.0 | 2024-04-27 | 0.5 |
| Skierniewice | 12,131 | 578483.0 | 455118.0 | 2024-03-31 | 1.0 | 2024-03-31 | 0.5 |
| Słupsk | 10,096 | 372448.0 | 735424.0 | 2024-10-12 | 1.0 | 2024-10-12 | 0.5 |
| Suwałki | 10,633 | 756659.0 | 700035.0 | 2024-05-28 | 1.0 | 2023-09-16 | 0.5 |
| Tarnobrzeg | 10,427 | 689165.0 | 304200.0 | 2024-06-30 | 1.0 | 2023-05-01 | 0.5 |
| Tarnów | 19,605 | 642418.0 | 240254.0 | 2024-06-15 | 1.0 | 2023-09-06 | 0.5 |
| Wałbrzych | 13,297 | 308432.0 | 325626.0 | 2024-04-08 | 1.0 | 2024-04-08 | 0.5 |
| Włocławek | 16,478 | 504877.0 | 532766.0 | 2024-09-07 | 1.0 | 2024-09-07 | 0.5 |
| Zamość | 11,158 | 800071.0 | 325303.0 | 2023-09-04 | 1.0 | 2023-09-04 | 0.5 |
Table 2.
Average building heights in former provincial cities in Poland.
| City | Average building height within radius Z from traditional city centre | ||||
|---|---|---|---|---|---|
| 1 km | 2 km | 3 km | 5 km | Total | |
| Legnica | 14.20 | 11.59 | 10.87 | 10.44 | 10.40 |
| Bielsko-Biała | 13.07 | 10.97 | 10.40 | 9.31 | 9.09 |
| Częstochowa | 12.07 | 10.39 | 9.50 | 8.84 | 8.83 |
| Elbląg | 11.73 | 11.07 | 10.60 | 10.22 | 9.99 |
| Wałbrzych | 11.72 | 10.68 | 10.21 | 9.66 | 9.88 |
| Kalisz | 11.69 | 9.40 | 9.00 | 8.52 | 8.31 |
| Przemyśl | 11.58 | 10.15 | 9.48 | 9.06 | 9.05 |
| Słupsk | 11.26 | 9.36 | 9.18 | 9.06 | 9.06 |
| Tarnów | 11.26 | 10.04 | 9.37 | 8.95 | 8.93 |
| Koszalin | 11.11 | 9.60 | 9.27 | 8.83 | 8.71 |
| Płock | 10.94 | 10.26 | 9.45 | 9.57 | 9.16 |
| Jelenia Góra | 10.86 | 10.12 | 10.01 | 9.62 | 9.28 |
| Piła | 10.79 | 9.43 | 8.73 | 8.49 | 8.45 |
| Włocławek | 10.50 | 9.44 | 9.16 | 8.90 | 8.73 |
| Tarnobrzeg | 10.48 | 9.36 | 8.53 | 7.86 | 7.68 |
| Siedlce | 10.25 | 8.89 | 8.86 | 8.79 | 8.79 |
| Radom | 9.99 | 9.90 | 9.50 | 8.80 | 8.45 |
| Ciechanów | 9.91 | 8.74 | 8.49 | 8.32 | 8.31 |
| Leszno | 9.87 | 8.41 | 7.92 | 7.88 | 7.88 |
| Suwałki | 9.73 | 8.38 | 8.83 | 8.75 | 8.84 |
| Łomża | 9.70 | 9.70 | 9.28 | 8.92 | 8.92 |
| Ostrołęka | 9.61 | 9.01 | 9.16 | 9.13 | 9.10 |
| Chełm | 9.43 | 8.28 | 8.00 | 7.99 | 8.16 |
| Piotrków Trybunalski | 9.36 | 8.63 | 8.57 | 8.38 | 8.37 |
| Zamość | 9.30 | 8.57 | 8.29 | 8.18 | 8.18 |
| Nowy Sącz | 9.29 | 9.02 | 8.64 | 8.34 | 8.10 |
| Krosno | 8.87 | 8.57 | 8.26 | 7.90 | 7.87 |
| Skierniewice | 8.41 | 7.80 | 7.74 | 7.63 | 7.71 |
| Sieradz | 8.13 | 8.15 | 8.05 | 7.73 | 7.70 |
| Biała Podlaska | 7.85 | 8.22 | 7.81 | 7.62 | 7.62 |
| Konin | 7.41 | 7.82 | 8.24 | 7.82 | 8.70 |
Two datasets derived from ALS LiDAR were used in the study: the digital surface model (DSM) and the digital terrain model (DTM). Both DSM and DTM are point clouds structured on a regular XY grid, with the Z-coordinate representing height above sea level. The DSM provides a comprehensive representation of the urban spatial structure, including buildings, tall greenery, and infrastructure. In contrast, the DTM reflects only the bare terrain surface. In addition, the BDOT10k database was used to obtain the geometric outlines of built-up areas within each city.
A summary of the digital resources used in the study is presented in Table 1. The BDOT10k data were obtained in 2025, while DSM and DTM datasets were generated through aerial scanning conducted between September 2023 and October 2024. For all cities analysed, the grid sizes for DSM and DTM were 0.5 m and 1.0 m, respectively. The vertical measurement error was approximately 15 cm.
The listed resources represent the most accurate currently available 3D representation of the structure of all the studied cities. The model includes the geometry of buildings along with architectural forms and roof shapes. The height measurement errors of ALS LiDAR are sufflcient for large-scale urban analyses.
To support the visualisation of the cities, orthophotos from 2023 to 2024 were used, each with a ground pixel resolution of 25 cm. The number of buildings and the geographic coordinates of the city centres are also summarised in the table. The total dataset amounts to 0.56 TB. The study used custom software developed in C++, previously used in landscape studies of tall buildings (Czyńska, Rubinowicz 2019, Czyńska et al. 2024). An example of Zamość visualisations developed using the compiled data is shown in Figure 2.
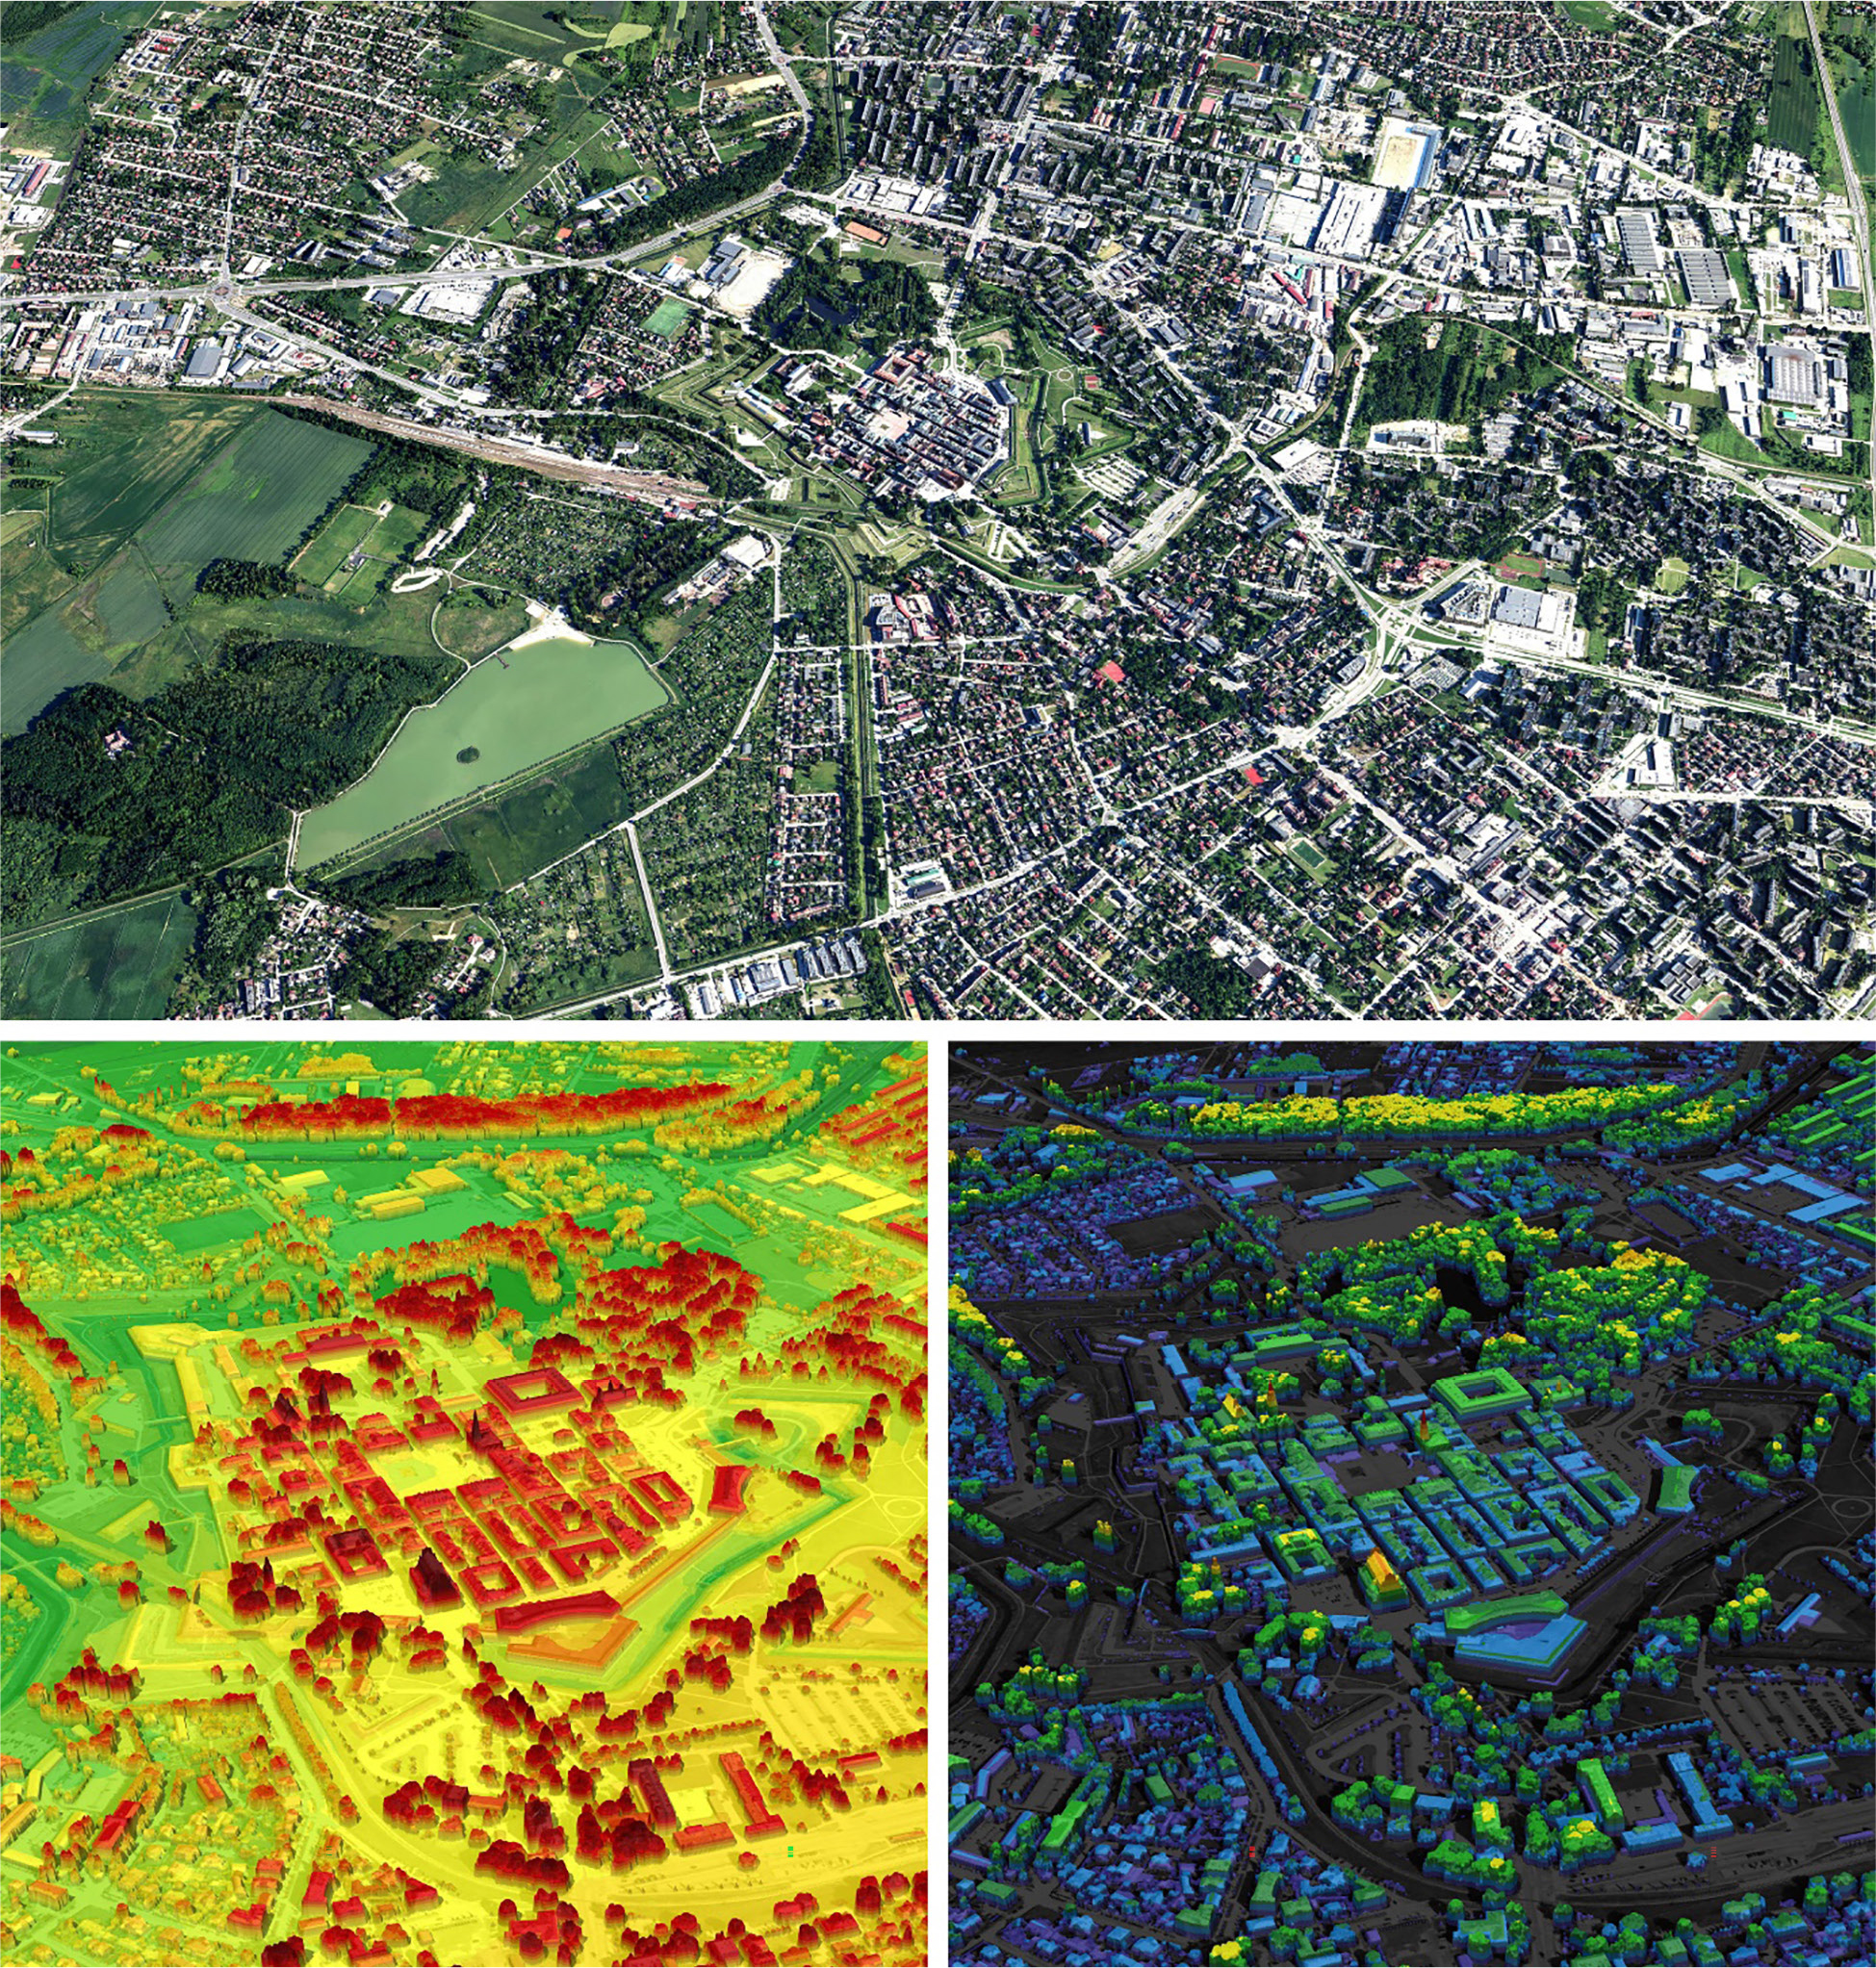
Fig. 2.
Visualisations of Zamość developed using the compiled data.
Calculation of cities’ average building heights
The calculation of the average building height for each city was based on data derived from DSM and DTM models. The differences in the heights between these models enabled the determination of the relative heights of land cover – comprising anthropogenic components (i.e., buildings and infrastructure) and natural features (primarily tall greenery). To isolate buildings, geometric outlines from the BDOT10k database – specifically the BUBD class – were used. For each city, raster models were generated using a 50 cm grid, in line with the resolution of the DSM. Subsequent stages of model development are presented in the accompanying figure (Fig. 3) and the example of Jelenia Góra. The scope of each model was first limited to the administrative boundaries of the city and then further refined to include only built-up areas. On this basis, the approximate average building heights for each city were calculated. The study accounts for building geometry, including roof shapes. However, certain inaccuracies in calculations may arise due to the fact that the 2D building footprints in BDOT10k represent the ground floor outline, which in some cases, may deviate from the actual building envelope.
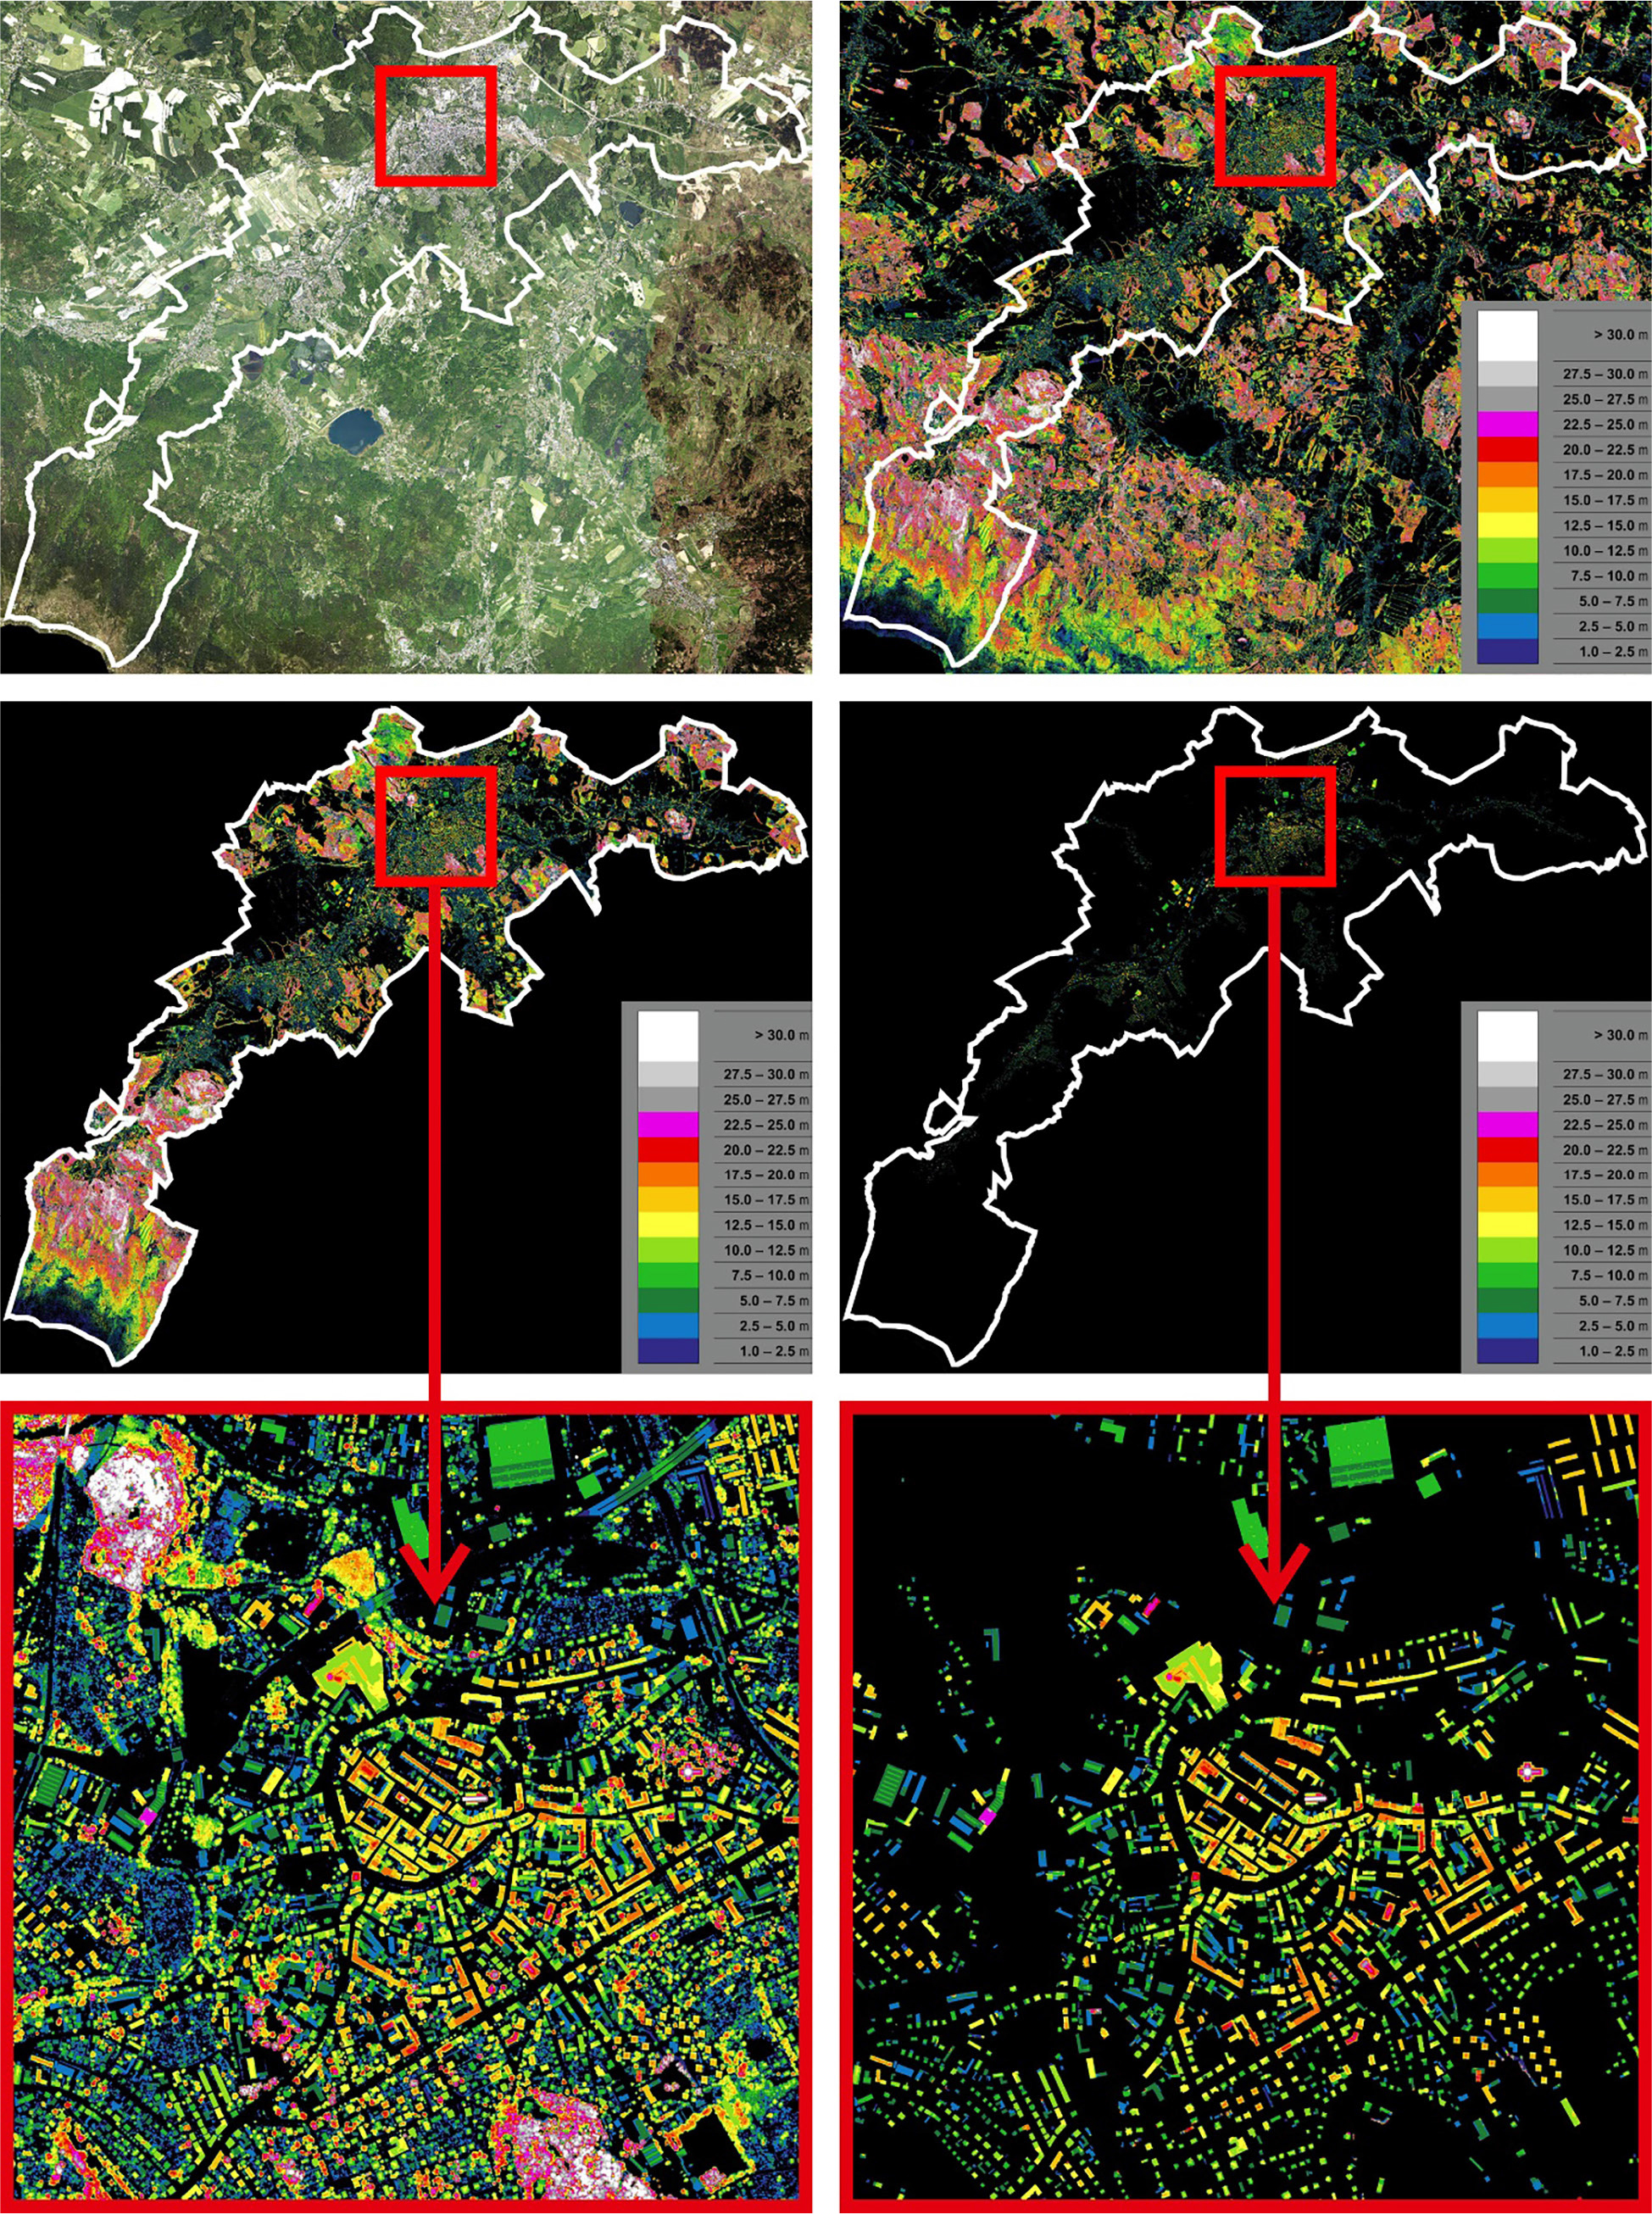
Fig. 3.
Jelenia Góra – subsequent stages of model development.
Identification of city centres
The calculation of average building height for each city was carried out in several methodological variants. The basic survey encompassed the entire area within each city’s administrative boundaries. This was supplemented by an analysis of inner-city zones defined by radii of 1 km, 2 km, 3 km, and 5 km from designated focal points. The focal points were established through an assessment of the existing urban structure and its historical development. In most cities, the geometric centre of the market square was adopted as the focal point. The coordinates of the focal points for all 31 surveyed cities are presented in Table 1.
Results
Based on the calculations, the average building heights within 31 former provincial cities were determined at varying distances from their respective centres (Table 2). Several patterns emerge from the analysis. The first relates to the relationship between building height and distance from the city centre. In many cities, such as Legnica and Bielsko-Biała, the average building height peaks within a radius of 1 km from the centre, indicating taller development in central areas. As the distance from the centre increases, building heights generally decline, though this trend is not universal (Fig. 4). The most notable exception is Konin, where the pattern is reversed. A similar, albeit less pronounced, tendency is also observed in several cities of comparable population size, such as Biała Podlaska and Sieradz. It may be assumed that in cities with larger populations, the average building height declines with the increase in measurement radii.
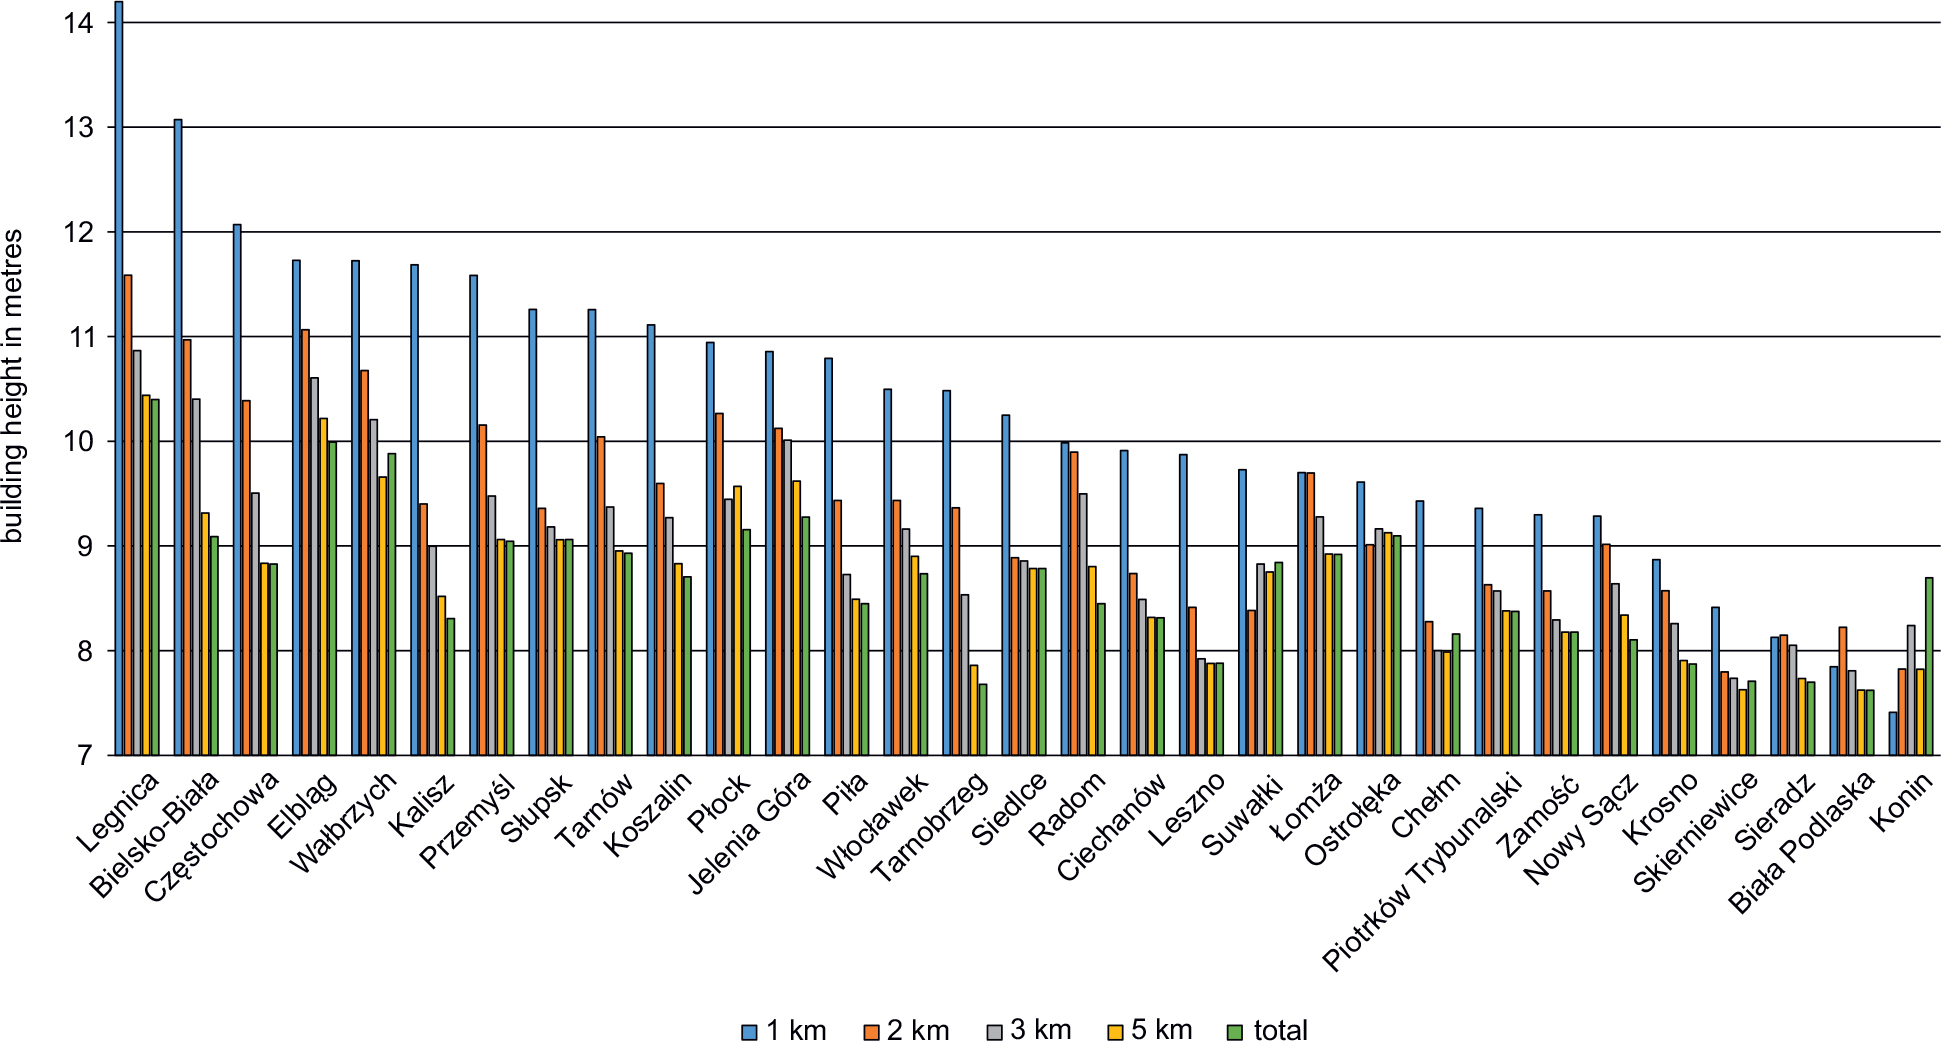
Fig. 4.
Average building heights in former provincial cities in Poland in relation to distance from the city centre.
The largest average building heights across the entire urban area were recorded in Legnica (10.40 m) and Elbląg (9.99 m). In contrast, the lowest values were observed in Sieradz (7.70 m) and Skierniewice (7.71 m). The resulting difference of 2.78 m corresponds approximately to the height of a single storey. Even greater disparities became evident when focusing on city centres, defined here as the area within a 1 km radius of the designated central point. In this zone, the average building heights reach 14.2 m in Legnica and 13.07 m in Bielsko-Biała compared with 7.4 m in Konin and 7.85 m in Biała Podlaska. This produces a difference of 6.79 m, which translates into more than two storeys. For the remaining zones (2 km, 3km, and 5 km radii), the maximum differences in average building height were 3.79 m, 3.13 m, and 2.8 m, respectively. Although less pronounced, these are still quite significant from an urban planning perspective.
Many cities exhibit a tendency to concentrate taller buildings near the centre, aligning with general urban development trends. However, notable exceptions exist. Cities such as Ostrołęka, Sieradz, and Biała Podlaska display minor differences in average building heights across various distances from the centre, indicating a more homogeneous development pattern. In this case, the average deviations from the mean building height in the designated measurement zones are minimal – only 0.21 m, 0.22 m, and 0.24 m, respectively. By contrast, the greatest variation is observed in Legnica, Bielsko-Biała, Częstochowa, and Kalisz, where differences exceed 1.25 m. The reduction in the average building height can follow different trajectories: in some cities, such as Krosno, Nowy Sącz, and Elbląg, the decrease is gradual and consistent, whereas in others – like Legnica, Kalisz, and Słupsk – it is abrupt and pronounced. The most signifcant declines in average building height typically occur between 1 km and 2 km from the city centre.
Despite the observed statistical variations, the overall analysis reveals a consistent pattern: building heights tend to be greater in city centres and gradually decrease with distance from the core. This trend reflects typical urban planning strategies.
Following the determination of average building heights in all former provincial cities, the cities were grouped based on their average building height profles. To achieve this, the k-means clustering method was used (Hartigan, Wong 1979). This method falls within the family of cluster analysis algorithms, which aim to identify and group similar objects (clusters) based on their shared characteristics. Using the k-means method, two distinct clusters were identified (Table 3, Fig. 5).
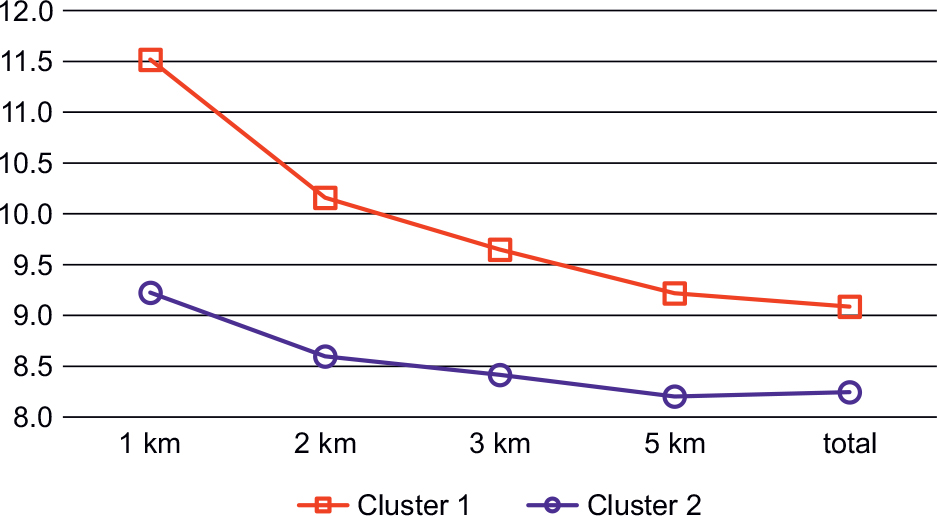
Fig. 5.
Clustering by average building height profile of former provincial cities based on the k-means method.
Table 3.
Classification of cities into clusters.
| Cluster 1 | Cluster 2 |
|---|---|
| Biała Podlaska | Bielsko-Biała |
| Chełm | Częstochowa |
| Ciechanów | Elbląg |
| Konin | Jelenia Góra |
| Krosno | Kalisz |
| Leszno | Koszalin |
| Łomża | Legnica |
| Nowy Sącz | Piła |
| Ostrołęka | Płock |
| Piotrków Trybunalski | Przemyśl |
| Siedlce | Radom |
| Sieradz | Słupsk |
| Skierniewice | Tarnów |
| Suwałki | Wałbrzych |
| Tarnobrzeg | Włocławek |
| Zamość |
The results indicate that, although a downward trend in building height from the city centre to the periphery is evident in both clusters, the rate of decline differs. This divergence is particularly pronounced within each cluster, especially in the 1 km to 2 km range from the centre. It is also noteworthy that Cluster 2 exhibits significantly higher average building heights than Cluster 1. At a distance of 1 km from the city centre, the difference exceeds 2 m, but it gradually decreases to less than 1 m at greater distances.
The spatial distribution of cities within each cluster can be examined from a spatial perspective (Fig. 6). The results of the analysis highlight the difficulty of establishing an unambiguous classification based on an east-west or north-south division of the country. Nonetheless, certain general trends can be observed. Cities in Cluster 1 are predominant across the entire eastern belt of Poland, with the notable exception of Przemyśl, and – slightly further west – Radom and Tarnów. In central Poland, cities from this cluster are less common, while in the west, only Leszno falls into this category. By contrast, Cluster 2 encompasses the majority of cities located in the western part of the country, including both southern and northern regions. However, the division between eastern and western Poland does not follow a strict boundary but rather reflects a fluid and context-dependent distinction. As such, the classification proposed here should be treated with caution and warrants further investigation. Future research would benefit from expanding the scope beyond the current sample to include a broader range of urban centres, both large and small, to avoid overly simplistic generalisations.
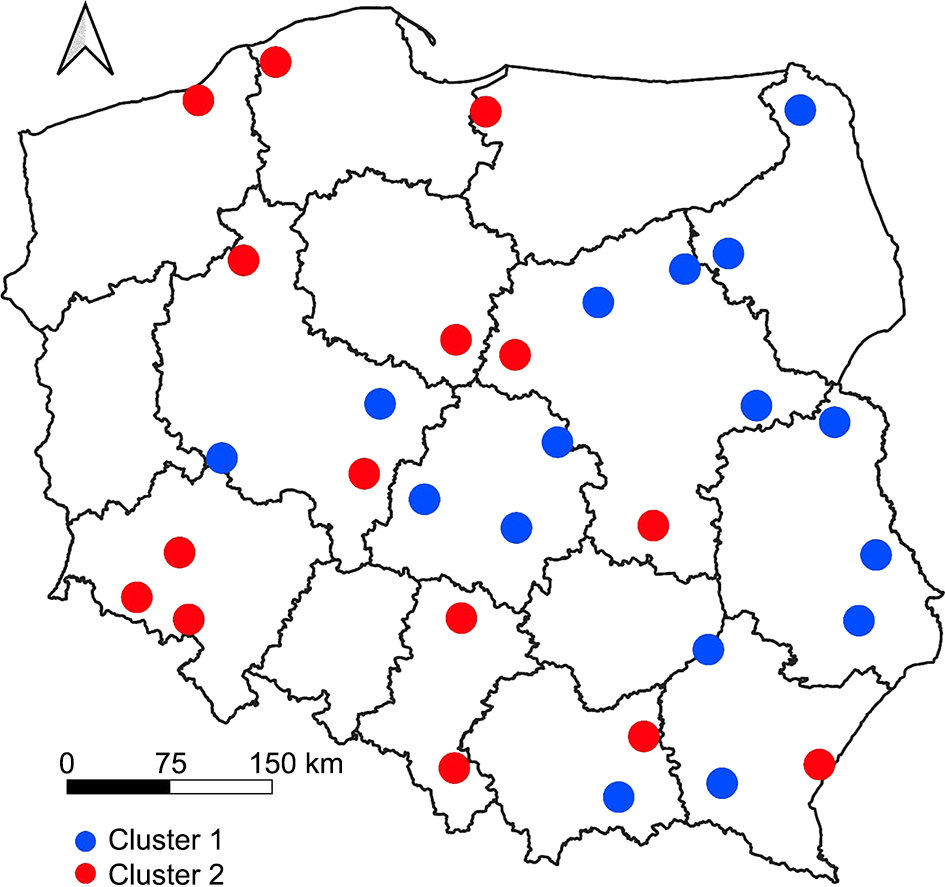
Fig. 6.
Spatial distribution of former provincial cities based on cluster analysis.
In the context of spatial analysis, identifying the underlying causes of variation in building heights is critical, and this can be achieved through the use of appropriate measures and indicators. While spatial analysis provides a map of visible patterns and relationships, a deeper understanding of urban dynamics requires an exploration of factors affecting building height in different locations. Variation in building heights may result from a range of economic, social, cultural, and regulatory influences. As such, a broader analytical approach is needed – one that incorporates a diverse set of indicators and metrics, such as population size, population density, population outflow, urban wealth, and land value. This multifaceted perspective is intended to offer a more comprehensive understanding of the mechanisms shaping urban form and building heights in cities. The process of selecting indicators and metrics for the study was guided by the research team’s informed judgement, drawing on both professional experience and subjective insights (Table 4).
Table 4.
Selected measures and indicators used to assess former provincial cities based on Statistics Poland Local Data Bank.
| Cities | 2024 | 2024 | 2023/2024 | 2024 | 2023 |
|---|---|---|---|---|---|
| 1 | 2 | 3 | 4 | 5 | |
| Indicator/measure | |||||
| Biała Podlaska | 53.89 | 1090.9 | 98.97 | 2363.87 | 5676 |
| Bielsko-Biała | 164.32 | 1320.4 | 99.13 | 3472.70 | 6783 |
| Chełm | 56.43 | 1411.9 | 98.64 | 2159.48 | 5412 |
| Ciechanów | 41.47 | 1265.2 | 99.35 | 2605.48 | 4913 |
| Częstochowa | 203.63 | 1274.8 | 98.86 | 2755.99 | 6165 |
| Elbląg | 112.05 | 1403.8 | 99.23 | 2260.65 | 6282 |
| Jelenia Góra | 74.19 | 678.8 | 98.76 | 2482.03 | 5515 |
| Kalisz | 91.96 | 1325.5 | 98.73 | 3031.36 | 5795 |
| Konin | 66.10 | 803.2 | 98.55 | 3105.66 | 5222 |
| Koszalin | 105.26 | 997.1 | 99.73 | 2728.05 | 6723 |
| Krosno | 43.59 | 975.0 | 98.93 | 2704.86 | 5849 |
| Legnica | 90.82 | 1613.5 | 98.77 | 2790.33 | 5352 |
| Leszno | 59.52 | 1868.2 | 99.12 | 2911.35 | 5639 |
| Łomża | 59.26 | 1814.0 | 99.25 | 2353.31 | 6227 |
| Nowy-Sącz | 79.82 | 1385.8 | 99.33 | 3085.63 | 6233 |
| Ostrołęka | 47.70 | 1425.5 | 98.90 | 3257.25 | 5868 |
| Saw | 69.38 | 765.7 | 99.04 | 2789.20 | 5523 |
| Piotrków Trybunalski | 66.02 | 981.9 | 99.25 | 2759.79 | 5639 |
| Płock | 110.02 | 1249.6 | 98.95 | 5845.95 | 6276 |
| Przemyśl | 55.29 | 1197.6 | 98.64 | 2088.54 | 5030 |
| Radom | 193.78 | 1733.2 | 98.86 | 2482.73 | 6271 |
| Siedlce | 74.78 | 2347.1 | 103.43 | 2925.97 | 7703 |
| Sieradz | 38.30 | 747.7 | 98.89 | 2709.07 | 5474 |
| Skierniewice | 45.12 | 1304.1 | 99.87 | 2873.80 | 6636 |
| Słupsk | 84.77 | 1607.3 | 99.15 | 2357.74 | 5693 |
| Suwałki | 68.14 | 1040.2 | 99.87 | 2466.38 | 6500 |
| Tarnobrzeg | 43.22 | 506.1 | 98.88 | 1988.25 | 5418 |
| Tarnów | 102.12 | 1411.1 | 99.02 | 2781.23 | 5877 |
| Walbrzych | 98.75 | 1166.1 | 98.46 | 2055.25 | 4161 |
| Włocławek | 99.47 | 1169.0 | 98.67 | 2994.53 | 5403 |
| Zamość | 57.52 | 1896.3 | 98.78 | 2185.77 | 6555 |
1 Note: 1 – Population in thousands, 2 – Population per 1 km2, 3 – Decline/growth in population (in %), 4 – Wealth per capita (G-index of basic tax revenue per capita of the municipality adopted for the calculation of the compensatory subsidy for 2024), 5 – Average price per 1 m2 of dwellings sold under market transactions.
Following the collection of statistical data from the Local Data Bank (Statistics Poland), a statistical analysis was carried out, taking into account the distributional properties of the variables. While the Pearson correlation coefficient is commonly employed in such analyses due to its ability to measure linear relationships, itsapplication relies on the assumption of normality in the data. In this study, it was observed that not all of the variables exhibited a normal distribution – rendering the use of Pearson’s coefficient inappropriate in certain cases.
Consequently, the Spearman correlation coefficient was employed, as it is a rank-based measure that does not require the assumption of normality in the distribution of the variables (Wiśniewski 2012). This approach enabled more robust and reliable results, given that the Spearman coefficient is better suited to non-linear relationships and ordinal-scale data. As a result, the correlations obtained are more relevant to the specific characteristics of the variables examined (Table 5).
Table 5.
Relationship between building height of former provincial capitals in Poland and selected socio-economic indicators in 2024 – based on the Spearman rank order correlation.
| Indicator/measure | Average city height within administrative borders [W1] | Average city height within 1 km radius from conventional central point [W2] |
|---|---|---|
| Population in thousands [Z1] | 0.597 | 0.706 |
| Population per 1 km2 [Z2] | 0.205 | 0.158 |
| Population decrease/growth in % [Z3] | –0.053 | –0.085 |
| Wealth per capita [Z4] | 0.074 | 0.005 |
| Average price per m2 of dwellings [Z5] | 0.047 | 0.024 |
The analyses conducted lead to the following conclusions: A statistically significant correlation was identified only for the first variable, i.e., the number of inhabitants, both in relation to the average building height within administrative boundaries of the city (0.597) and within a 1 km radius from the designated central point (0.706), with the latter showing a stronger association. This indicates that the average building height in former provincial cities is directly proportional to population size: as the number of inhabitants increases, so does the average height of buildings.
With respect to the remaining variables – such as net migration, residents’ wealth, and residential property prices [Z2, Z3, Z4, Z5] – only weak and statistically insignificant correlations were observed with the building height indicators W1 and W2. These results suggest that there may be no direct relationships between these socio-economic variables and the indicators of building height. However, it is important to note that the process of urban development, particularly in terms of building construction, is long-term in nature and not subject to rapid change. This temporal lag complicates the interpretation of correlations based on current socio-economic data. Nevertheless, it is worth emphasising that the trends reflected in these variables tend to be stable and persistent over time.
Discussion
The results of the analyses allow for the identification of several general trends regarding spatial variations in building height across medium-sized Polish cities that formerly held the status of provincial capitals. The most clear-cut and statistically supported fnding is the positive correlation between population size and average building height. This may point to a functional relationship between the size of a city – measured by its number of inhabitants – and the demand for vertical densification. Spearman’s rank-order correlation coefficient (ρ = 0.706 for the 1 km radius from the city centre) indicates that larger cities are signifcantly more likely to feature taller buildings in their central areas.
The second notable correlation is the tendency for building height to decrease with increasing distance from the city centre, a pattern consistent with classical urban planning models, such as Burgess’s concentric zone theory or the building density gradient. This spatial distribution reflects the economic logic of urban development: in central areas, where land values are highest, compact, multi-storey residential and commercial buildings dominate, whereas in peripheral zones, lower-density forms, such as single-family housing, industrial facilities, and green spaces are more common (Heffner 2023). However, it is important to note that this pattern is not universally applicable. Local spatial, historical, and economic conditions can lead to signifcant deviations. The case of Konin exemplifies such divergence. Here, factors including the city’s industrial legacy (e.g., the impact of opencast mining on dispersed development), spatial planning strategies (such as the intentional creation of isolated housing estates with varying building heights), and geographical constraints (e.g., river valleys or areas prone to mining-related subsidence) may have influenced the atypical vertical structure of the urban landscape. Moreover, in some cities, contemporary development projects – such as new apartment complexes on the outskirts – or the presence of special economic zones can give rise to pockets of high-rise development far from the city centre. These cases underscore the importance of incorporating contextual variables – such as local planning policy, topography, and historical settlement patterns – into urban analyses to avoid oversimplifed generalisations (Lipińska 2022).
The results of the spatial analysis also warrant cautious interpretation. While the initial hypothesis – suggesting an increase in building height from east to west – is partially supported by the cluster analysis (which shows a predominance of ‘high’ clusters in western Poland), it is important to emphasise that this pattern is not strictly spatial in nature. As previously noted, there are notable exceptions, such as Przemyśl, and the observed variation may be shaped by a range of local factors. These include historical circumstances, investment costs, and spatial planning policies (Liszewski 2008, Węcławowicz-Bilska 2012, Kostrzewska 2013, Lorens et al. 2021, Lechowska 2022).
At the same time, current calculation methods – although based on advanced LiDAR data and DSM/DTM models – still require further refinement (Bac-Brojowicz et al. 2015, Czyńska, Rubinowicz 2019). The use of a raster model with a 50 cm grid enables the representation of many urban features in detail but does not fully eliminate the impact of boundary-related errors, which may reach up to 15 cm. Therefore, it is worth considering the adoption of more precise 3D building models, such as CityGML at Level of Detail 2 or 3 (LoD2, LoD3), or the use of object-based photogrammetry, which is increasingly recognised in urban research (Cai et al. 2025).
It is also important to note that the current analysis treats all buildings uniformly, which constitutes a significant simplification of urban reality. In its present form, the model does not account for differences in building function, construction type, or intensity of use, potentially leading to inaccuracies in the results. Incorporating building function (e.g., residential, commercial, industrial), as classified in the BDOT10k database, could offer several advantages. First, industrial buildings typically differ from residential ones in terms of volume, energy consumption, and traffic generation – factors that influence noise modelling, pollution levels, and infrastructure demand. Second, categorising buildings by function would enable separate analyses for distinct building types, thereby improving the precision of spatial models. Third, such a classification could enhance the usefulness of the data for informing spatial development plans or strategies for adapting to climate change (Biljecki et al. 2016).
Although the selection of socio-economic indicators for the correlation analysis was well justified, the findings suggest that the current parameters – such as wealth, property prices, and population density – do not exhibit a clear influence on building height. However, this may be attributed to the inherently inertial and longterm nature of urbanisation and high-rise development processes (Szymańska, Biegańska 2011). The present-day building height structure may reflect urban dynamics and planning decisions made several decades ago, which is particularly relevant in the context of former provincial capitals, many of which experienced intensive infrastructure development in the 1970s and 1980s (Kurniewicz, Swianiewicz 2016, Fonżychowski 2022). This underscores the need to continue exploring appropriate quantitative measures and indicators capable of explaining the spatial variation in building height. These should not be limited to socio-economic dimensions but should also encompass broader factors. Moreover, future analyses should aim to apply these variables within a process-based, longitudinal framework rather than rely solely on cross-sectional data, ideally covering the longest possible time span (Twardoch, Piotrowska 2024).
Finally, two additional comments are worth mentioning. The territorial scope of the study was limited to former provincial capitals. However, the observed patterns may not apply to cities with a different administrative or settlement history (Szymańska 2009). Therefore, it is reasonable to extend further analyses to a sample covering medium-sized and smaller cities, which will allow for the verification of hypotheses in a nationwide context (Lisowski, Grochowski 2009).
The data aggregation method employed in this study – based on averaging building heights without accounting for their physical attributes (e.g., the building footprint or the number of usable storeys) – may lead to simplifications that distort the true character of the urban fabric. The literature suggests that such an approach can introduce errors in the assessment of land use density and development intensity (Batty 2013). To improve the accuracy of measurement, it is advisable to employ weighted statistics (e.g., area-weighted averages) or alternative indicators, such as the average number of storeys, which may offer a more nuanced representation of urban structure diversity (Gauthier, Gilliland 2006).
The next phase of the research will involve extending the analysis to a broader range of Polish cities. In line with the methodological assumptions of the project, expanding the sample to include urban centres that vary in size, function, and historical development will allow more reliable and nationally representative generalisations.
There is also potential to apply a similar methodology to international datasets – in other EU member states, enabling comparative studies across nations with analogous urban structures. The ALS/LiDAR data used in the study, along with the derived DSM/DTM, represent the primary, most cost-effective, and most frequently updated resource for 3D city representation. This provides a promising perspective for applying the proposed methods in other EU countries.
Furthermore, future research will incorporate the functional classification of buildings using BDOT10k data. Functional segmentation will provide insights into how different types of land use influence building height and will support the development of combined functional-height profiles for individual cities. Finally, more advanced spatial modelling techniques are planned to be adopted, shifting from the current 2.5D models to full 3D representations (e.g., using LoD2 or LoD3 standards). This advancement will facilitate more detailed analyses, including assessments of shading, energy efficiency, and airflow within the urban environment.
Conclusions
The study identified significant correlations related to variations in building height across former provincial capitals in Poland. The results reveal a clear tendency in most of the analysed cities for taller buildings to be concentrated in central areas, with average building height decreasing progressively with distance from the centre. This pattern aligns with classical models of urban development and supports the notion of a functional hierarchy within urban space, although the manifestation of this trend is not uniform across all cases. Marked differences were observed in the degree of vertical variation, ranging from cities with an almost homogeneous building height structure (e.g., Sieradz and Biała Podlaska) to those with highly differentiated spatial layouts (e.g., Legnica, Kalisz, and Bielsko-Biała).
The strong positive correlation between population size and average building height – particularly within city centres (ρ = 0.706) – suggests that larger cities tend to exhibit more intensive vertical development. This relationship likely reflects both spatial constraints and the functional demand to increase the availability of residential and service space in central urban areas. In contrast, other socio-economic indicators examined – such as wealth, property prices, and population density – did not demonstrate statistically signifcant correlations with building height. This may be attributed to the long-term and inertial nature of urban development processes, which are not always captured by current socio-economic data.
The hypothesis positing the existence of a spatial gradient in building height ‘from east to west’ in Poland was partially confirmed by the results of the cluster analysis. However, the spatial distribution of building types does not support a clear delineation of this division. Instead, the observed pattern suggests a gradual transition between urban morphological types rather than a sharply defned regional boundary. This highlights the need for further research based on a broader sample of urban centres to validate the findings and avoid oversimplification.
It is important to note that the calculation methods employed – based on the difference between DSM and DTM models and the geometric outlines from the BDOT10k database – yielded approximate rather than fully precise results. The assumption of homogeneity across all buildings introduces simplifcations that may lead to interpretative distortions, particularly in functional and spatial analyses. Incorporating data on building function and adopting more advanced 3D modelling techniques (e.g., LoD2 or LoD3) represent valuable directions for future research.
Given the limited territorial scope of the study – focused exclusively on former provincial capitals – it must be acknowledged that the observed patterns may not be applicable to cities with different origins, sizes, or administrative histories. Consequently, extending the analysis to a larger and more diverse sample of urban centres, including those abroad, represents a logical and valuable direction for future research. Further work should also incorporate a longitudinal, process-based approach, enabling the tracking of indicator variability over an extended period. Such an approach would allow a more comprehensive understanding of the dynamics of morphological transformation in response to social, demographic, and economic change.
In summary, the findings of this study offer valuable empirical insights for spatial planners, urban designers, and local decision-makers. They underscore the importance of adopting an analytical approach to assessing urban structure and highlight the need to consider both morphological and functional dimensions in the management of urban space. This is particularly relevant in the context of promoting sustainable development.
Notes
[3] Contributed by Authors’ contributions
PC (30%): conceptualisation, formal analysis, supervision, validation, visualisation, writing – original draft, writing – review & editing; PR (30%): data curation, formal analysis, methodology, project administration, supervision, validation, writing – review & editing; OG (20%): investigation, data curation, formal analysis, methodology, resources, software, visualisation; KB (20%): investigation, data curation, formal analysis, methodology, resources, software, visualisation.