
The phenomenon of lightning has captivated the human imagination for thousands of years, long before the dawn of civilisation. Initially considered as an act of a higher power, it soon became an object of scientific interest. In modern times, lightning riveted the concern of engineers as a very hazardous event bringing economic losses of over 35 mld € in Western Europe alone in a single decade (Mäkelä et al. 2014, MunichRe 2019). Also, lightning is listed among the most prolific causes of weather-related death and injury in Europe, including Poland (Różdżyński 1996, Groenemeijer et al. 2004, Dotzek et al. 2009) and the USA (Curran et al. 2000). The weather observations conducted by the trained observers in the meteorological stations were the principal information on the Cloud-to-Ground (CG) lightning events since the beginning of the climatological records. However, observations carried out in this manner were burdened with errors of a limited radius of human perception (sight and hearing) and also interpretation for further record. It needs to be stated that lightning observations were predominantly recorded for the sole purpose of thunderstorm detection. Nevertheless, the thunderstorm is a far more complex phenomenon encompassing a series of multiple meteorological occurrences, not just lightning itself. Based on the lightning flashes (often single lightning flashes), climatological records of days with thunderstorms were created and used for decades (Changnon, Changnon 2001, Wang et al. 2010), also in Poland (Bielec-BąKowska 2003, Kolendowicz 2006, Taszarek et al. 2015, Sulik 2022). The lightning flash, however, consists of several electrical charge-related components, among which a stroke plays a fundamental role. Each lightning flash can accommodate several strokes, and each of the strokes lowers a significant electric charge to the ground (Rakov, Uman 2003). The climatological indicator of days with thunderstorms cannot describe the physical intensity of thunderstorms, partially because it does not use the information on the number of lightning strokes in each geophysical flash and consequently in each thunderstorm and partially because it does not measure the lightning power unit (Ampere [A]) that describes the intensity itself.
Recent decades have brought significant progress in the technology of lightning remote sensing. The regional range ground-based systems designed for the detection and localisation of the lightning pulses within the Earth–ionosphere spherical cavity gained on accuracy and became more common in medium and well-developed countries. Most of them are based on the VHF/LF electromagnetic spectra, which gives a relatively good detection efficiency of up to 100 km of radius (Bodzak 2006, Pohjola, Mäkelä 2013, Mäkelä et al. 2014, Nag et al. 2014).
Using information derived from different lightning detection and localisation systems installed and run in Europe, several studies were conducted, delivering some congenial results. A 10-year-long dataset derived from the Austrian Lightning Detection and Information System (ALDIS) was used (by Schulz et al. 2005) to calculate flash density of up to 4 flashes · km−2 · year−1 for Austria using 1 km × 1 km grid cells. Similar results were obtained in Czechia by Novák, Kyznarová (2011), using a slightly different calculation method (20 km × 20 km grid cells): 1–3 flashes · km−2 · year−1 and in Poland by Taszarek et al. (2015) average of 3.1 flashes · km−2 · year−1 and Sulik (2022) up to 3.5 flashes · km−2 · year−1 using the PERUN system data (10 km × 10 km grid cells) were detected. Higher values were derived in southern Germany by Wapler (2013), reaching >30 flashes · km−2 · year−1 (1 km × 1 km grid cells). The congeniality of the above-mentioned depends largely on the common results derived by Diendorfer (2008), proving that reliable accuracy of flash density is achieved when an average of >80 flashes fall in a grid cell.
This work aims to assess the risk of intense Cloud-to-Ground (CG) lightning stroke danger in Poland. For this, it is essential to recognise the spatial density of CG lightning events and the intensity of the phenomenon. Furthermore, a mutual ratio of frequency per area unit and intensity in the form of a novel index is established to mark the areas of the country with the highest and the lowest danger to human life and the economy. To achieve that, a specially created homogeneous database consisting of 22 years of information on the electricity of the atmosphere is utilised. Also, long-term trends defined by the directional coefficient of the linear regression function of stroke events according to their polarity are presented to highlight the impact of changing climate conditions on the intensity and, therefore, increasing risk.
This paper’s study area is Poland, representing Central European conditions in terms of physiography, atmospheric circulation, and climate within its administrative borders. The territory is situated between a large body of water in the north (the Baltic Sea) and a mountain barrier (the Sudetes and the Carpathian Mountains) in the south. It consists mainly of lowlands in the country’s central and northern parts, while in the south, a large area of highlands can be found. It fully reflects the relief of Central Europe and, consequently, the environmental conditions of the climate in this part of the continent. Poland’s land cover relates to the underlying geological and geomorphological structures and is dominated by agricultural land (Sulik 2022). In winter, the prevailing zonal (western) circulation direction dominates, while in summer, the weather is shaped by radiative factors.
The investigation was conducted using the Polish lightning detection and localisation system PERUN data (initially named SAFIR 3000), run and maintained by the Institute of Meteorology and Water Management – National Research Institute (IMWM-NRI).
The system commenced in January 2002 and, after a few months of calibration for local conditions, started its routine work supporting the operational duties of IMWM-NRI. PERUN included sensors located at synoptic and meteorological stations in Gorzów Wielkopolski, Częstochowa, Kalisz, Toruń, Sandomierz, Warszawa, Olsztyn, Białystok and Włodawa, which allowed (according to Vaisala) to reach the detection efficiency of ~95% over the whole territory of the country with lightning location precision of <1 km (Fig. 1). However, Taszarek et al. (2015) found that only 38.3% of the country reaches such a precise value and the location accuracy of <2 km covers almost 76.6% of its territory. Since then, the system has been subjected to several modernisations and upgrades, including the installation of a new total lightning processor (TLP) in April 2012 with its later upgrades in the following years, and in November 2022 installation of a new TLP Central Processor Unit. Simultaneously, all the sensors contributing to the system Vaisala SAFIR 3000 sensors in Poland were replaced with new-generation Vaisala TLS 200 (Vaisala documentation). The initial spatial configuration of sensors in the country favoured the region of the Central Mazovian Lowland. Therefore, the system was equipped with additional receiving stations in Legnica, Kozienice, Chojnice (November 2014) (Gajda 2021) and later in Lesko (November 2022). The above-mentioned changes to the initial layout of the system increased the location precision to <1 km in 88% of the surface area of the country and >1 km in the remaining 12% of Poland. Also, the central region of the Mazovian Lowland now has a lightning flash location accuracy of ~0.5 km (Sulik 2022). It needs to be stated that international cooperation between the National Weather Services of neighbouring countries in Central Europe resulted in a lightning data exchange between corresponding systems, increasing the overall efficiency of regional systems. Nowadays, PERUN also ingests data from sensors located in Görlitz, Greifswald and Berlin (Germany), Prague, Olomouc (Czechia), Visby and Vitemölla (Sweden), Košice (Slovak Republic), Budapest (Hungary), Varèna and Šilutè (Lithuania) (Fig. 1). It is essential in Poland due to the spatial configuration of the system’s sensors resulting in a fall below 6 km in the location accuracy in the northwest part of the country (Taszarek et al. 2015).
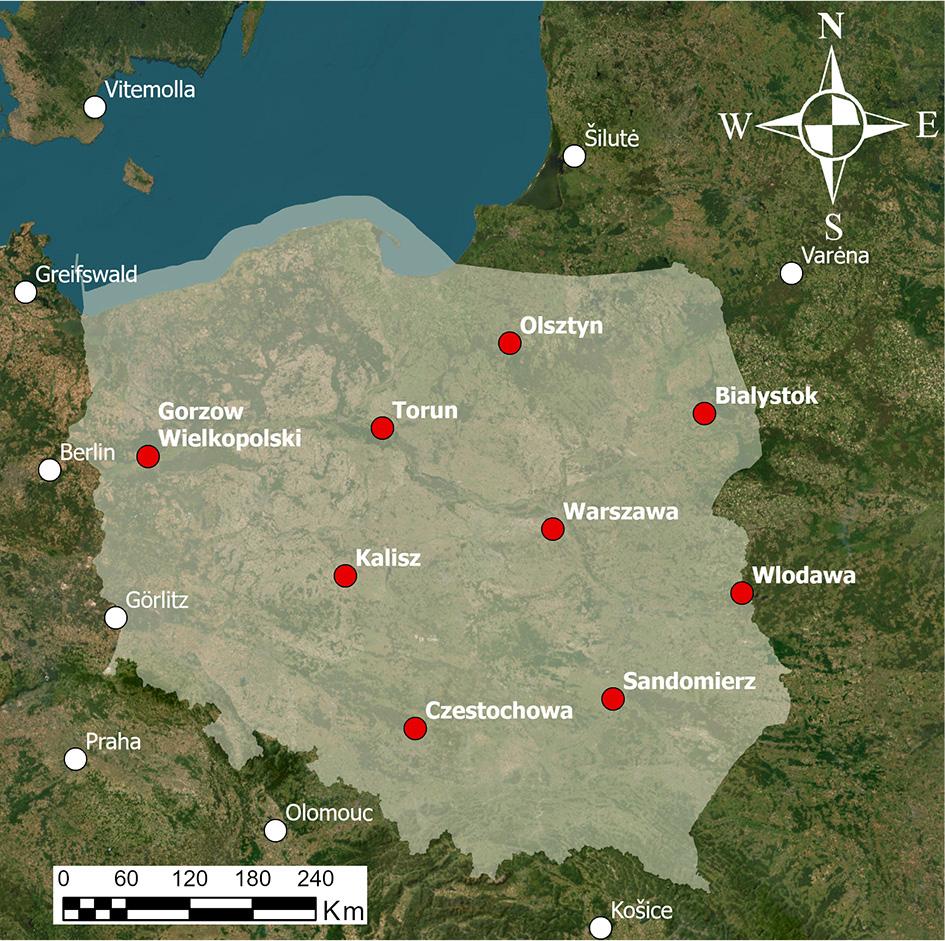
The broad PERUN sensor’s layout in Poland (red dots) and neighbouring country sensors that contribute to the PERUN detections analysed in this paper (white dots). Please note that this map does not present all the changes in the locations of the receiving stations within the country during the network’s history.
The PERUN system uses an interferometry direction-finding (DF) technique (Krider et al. 1980) within the VHF band; its sensors are capable of detection and localisation of lightning events for both Cloud-to-Ground (CG) and Intra-Cloud (IC) strokes. Basic electrical discharge parameters and discrimination between CG and IC types of events are also calculated using low-frequency (LFs) information. According to previous studies (Betz et al. 2009), PERUN can detect up to 100 events per second. Rakov, Uman (2003) provide more information on lightning detection techniques.
In this study, the PERUN data from the years between 2002 and 2023 were used. The primary detection unit in this work is a lightning stroke, including its exact time and geographical location, peak current and polarity. This implies that all the statistics and mapping are based on lightning strokes in contrast to previous works that include whole flashes (Taszarek et al. 2015, Sulik 2022). Earlier works primarily focused on lightning flashes as an indicator or trigger to calculate ‘thunderstorm days’ or ‘days with thunderstorms’ for classical climatological studies. This work focuses on the danger that each lightning stroke can pose to the life and health of humans and their economy, only indirectly referring to the classical climatology of thunderstorms. Thus, the lightning flash as a whole and complex geophysical event had to be abandoned for the lightning stroke to estimate the danger mentioned above.
Since the PERUN system delivers peak current estimations for each lightning stroke (lighting strokes among other transients build up to create the lightning flash geophysical phenomenon reaching sometimes up to 26 subsequent strokes within one flash (Rakov et al. 2003)), each one of them needs to be considered to estimate the intensity of the lightning discharges properly lowered to the ground. Not only is lightning density a driving factor of the posed threat, but lightning intensity plays an equally important role here. This intensity is measured here in units of electrical current [A], as provided by the system. Similarly to earlier studies (Feudale et al. 2013, Mäkelä et al. 2014, Taszarek et al. 2015, Sulik 2022), only CG lightning events were considered. The IC spherics were removed from the database due to their relatively low quality (especially in the early stage of the PERUN system operational work).
The CG data used in this study were compiled from various sources and data formats. The system itself generated different data formats and data outputs throughout its history. To make the dataset as complete as possible, all the accessible data formats were used to build the final database. The data were recompiled and reformatted to create a homogeneous data series for further calculations. The Vaisala Data Analysis Module (DAM) was used to fill in the gaps where necessary. Finally, all the information was put into text format to make it seamlessly identical to the original text output from the beginning of the system’s work (before all the upgrades and alterations). Some inconsistencies, like an artificial limitation of the current measurement in the first 5 months of the PERUN work, were detected in the process. The main computations were made using R software (R Core Team 2014) and ArcGIS Pro (ESRI ArcGIS Pro, Redlands, California, USA) for mapping. However, a series of specially developed Python (Python documentation) and Delphi codes were also utilised to foster data management.
In this paper, all CG lightning strokes recorded by the sensors in Poland were considered (regardless of the current number and location of the receiving stations within the country during the network’s history). To foster the spatial analyses in the border regions (triangulation shortcomings due to geometric displacement of the sensors in Poland) also data from the neighbouring countries were included but limited to those coming from the marked in white sensors (Fig. 1). All the CG lighting stroke records were put in grid of 0.2° × 0.2° to make the study results comparable to the previous papers mentioned above.
In the first step, spatial analyses and computations were done to highlight regions of the country with the highest concentrations of CG lightning strokes, including their density and intensity. A novel and aggregating index was proposed to get comprehensive and easier-to-interpret information, combining both information in one. Heat maps using ArcGIS Pro software and additional density and intensity maps (utilising the Python codes) were created to visualise the spatial distribution of analysed characteristics. Heat Maps were designed to present relative densities using the weight of each lightning stroke for overall results in density representation of gravitating groups (contrary to the calculated densities, which rely only on the strokes falling within the grid boxes). This method displays the relative density of points as a dynamic raster visualisation using a colour scale to indicate density values. It works very well when there are many lightning strokes (point features) close by. The calculated density is based on the feature count. A non-parametric method of kernel density estimation (KDE) mathematical function was applied to estimate the probability density function. The surface value is highest at the exact location point of the lightning stroke and fades down to zero at the search radius with distance from the point.
Additionally, Heat Maps were supplemented with the Convex Hull Function centroids to pinpoint the exact grid cell with the densest CG lightning occurrence (Devados, O’Rourke 2011). The convex hull is a polygon produced by a rubber band contracting on all the strokes (point features) constituting the lightning. This hull has the interesting property that it creates the minimum area that gathers all point features without any assumptions about the degree of permissible concavity, and it allows the feature to define the geometry instead of forcing an assumed form (Bruning, MacGorman 2013). The density, intensity and index maps were drawn using Python codes that were written especially for this purpose. Both methods show the areas of interest in the aim of this study.
The work used a 0.2° × 0.2° grid network for all the map calculations following an often-utilised primary field of ~20 km × 20 km. Each grid centre was checked to fall within the boundaries of Poland. In doubtful cases (at the country’s borders), grid cells whose surface area on Polish territory was calculated below 50% of their total surface area were excluded. For each grid cell, a lightning stroke density (number of strokes per time per km2) and lightning stroke intensity (estimated maximum current charge lowered to the ground) were calculated with a spatial resolution of 20 km × 20 km. As a result, two matrices representing density and intensity in the respective units were created.
Then, both fields were normalised. For each maximum recorded value (dmax and Imax, respectively) of the given field in the function of time (analysed period), value 1 was given. All the lower values in that field were linearly classified between 0 and 1. Next, both normalised matrices were multiplied by one another, creating a matrix of the index of lightning stroke danger for each grid cell on the map. Thus, the index value fits between 0 and 1, where 0 is the lowest possible threat, and 1 is the highest possible threat of lightning touchdown within the matrix. The proposed Lightning Danger Index (LDI) equation is:
- –
d is density [#/t × km−2],
- –
# is an integer number of CG lightning strokes,
- –
t is a given time span (period taken into account)
- –
- –
i is intensity [kA],
- –
dmax is a maximum recorded value of d,
- –
imax is a maximum recorded value of i.
In the studies quoted above, conducted by Taszarek et al. (2015) and Sulik (2022), the problem of average CG lightning flash densities was mentioned in both annual and monthly representations. Also, the topic of average peak current records (Sulik 2022) derived from the PERUN system was referred to. In this work, the maximal peak current and the total monthly number of CG touchdowns were taken up to better relate to the seasonal changes in the parameter.
The monthly drawn Heat Maps present the seasonal relative densities of lightning strokes for a PERUN system domain (Fig. 2). They have been expanded by the Convex Hull Function centroids to give additional information on the precise centroids of the lightning stroke’s position within the dense blob shape.
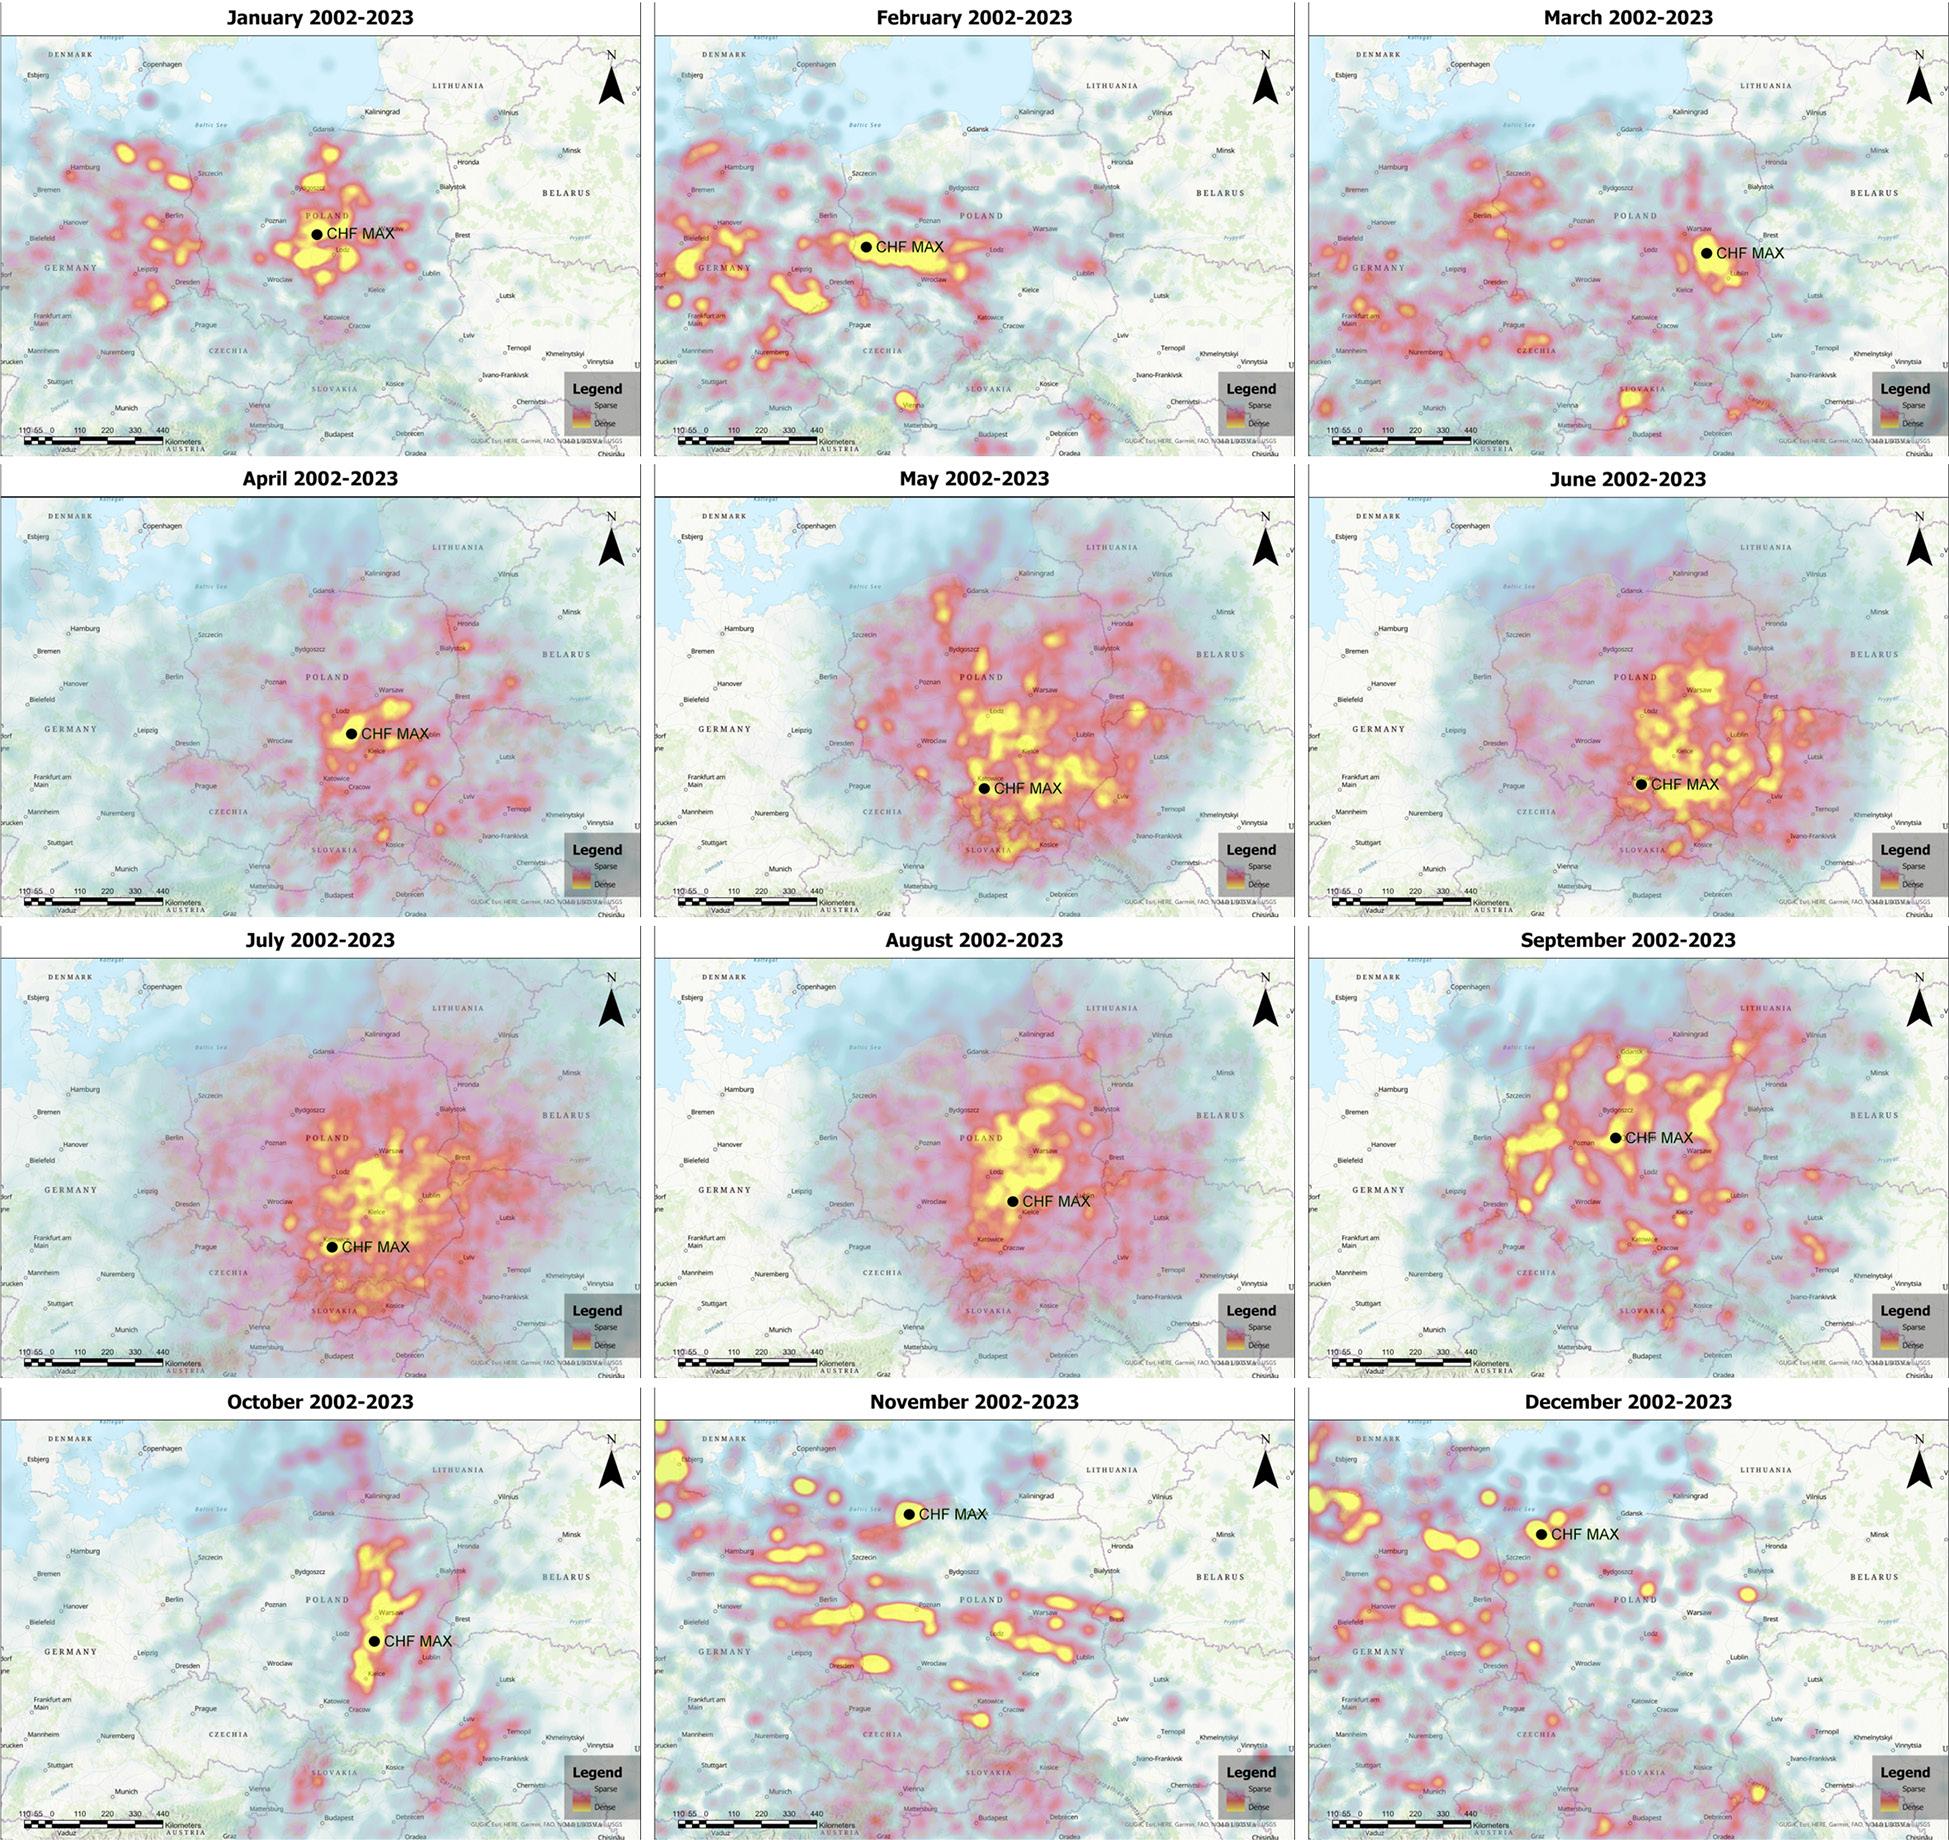
The monthly total CG Heat Maps with Convex Hull Function centroids during 2002–2023. Based on CG lightning stroke data derived from the PERUN lightning detection and localisation network and compatible sensors located in the neighbouring countries.
In the first 4 months of the year, the long-term gravity centroid (CHFmax) of the CG lightning in Poland is located in the centre of the country, where the geometry of the detection stations layout provides the shortest baselines between sensors and the effectiveness of the network is the best (Fig. 1). It is worth mentioning that almost all cold season months (January, February, March, November and December) present visible latitudinal thunderstorm paths originating in Germany and ending in Poland as the isolated thunderstorm cells travel from Western Europe to the East. In May, June, July and August, the centroids appear on the southern highlands, indicating the dominance of the orography and anthropogenic factors in the development of the CG lightning events. In the first case, the breakdown path of the individual lightning seems to be a driving factor. In contrast, in the second, the presence of the large and productive emitters of the condensation nuclei (industrial pollution) gains importance. In September and October again, the geometry of the network appears to have the driving role. In November and December, however, the winter dominance of the warm waters of the Baltic Sea and their leading role in CG discharge generation can be seen. This phenomenon can also be seen and compared in Figure 3. Strong heat radiation increases coastal water surface layer temperature, allowing local convection initiation and thus charging mechanism incorporation (Poelman et al. 2016). In general, the late spring and summer months are characterised by more visual concentrations of the lightning events in the centre and southeast, while autumn and winter in the lowlands and coastal areas of the country. Also, in the winter months, the densities seem to track the thunderstorm paths (westerly circulation) quite accurately.
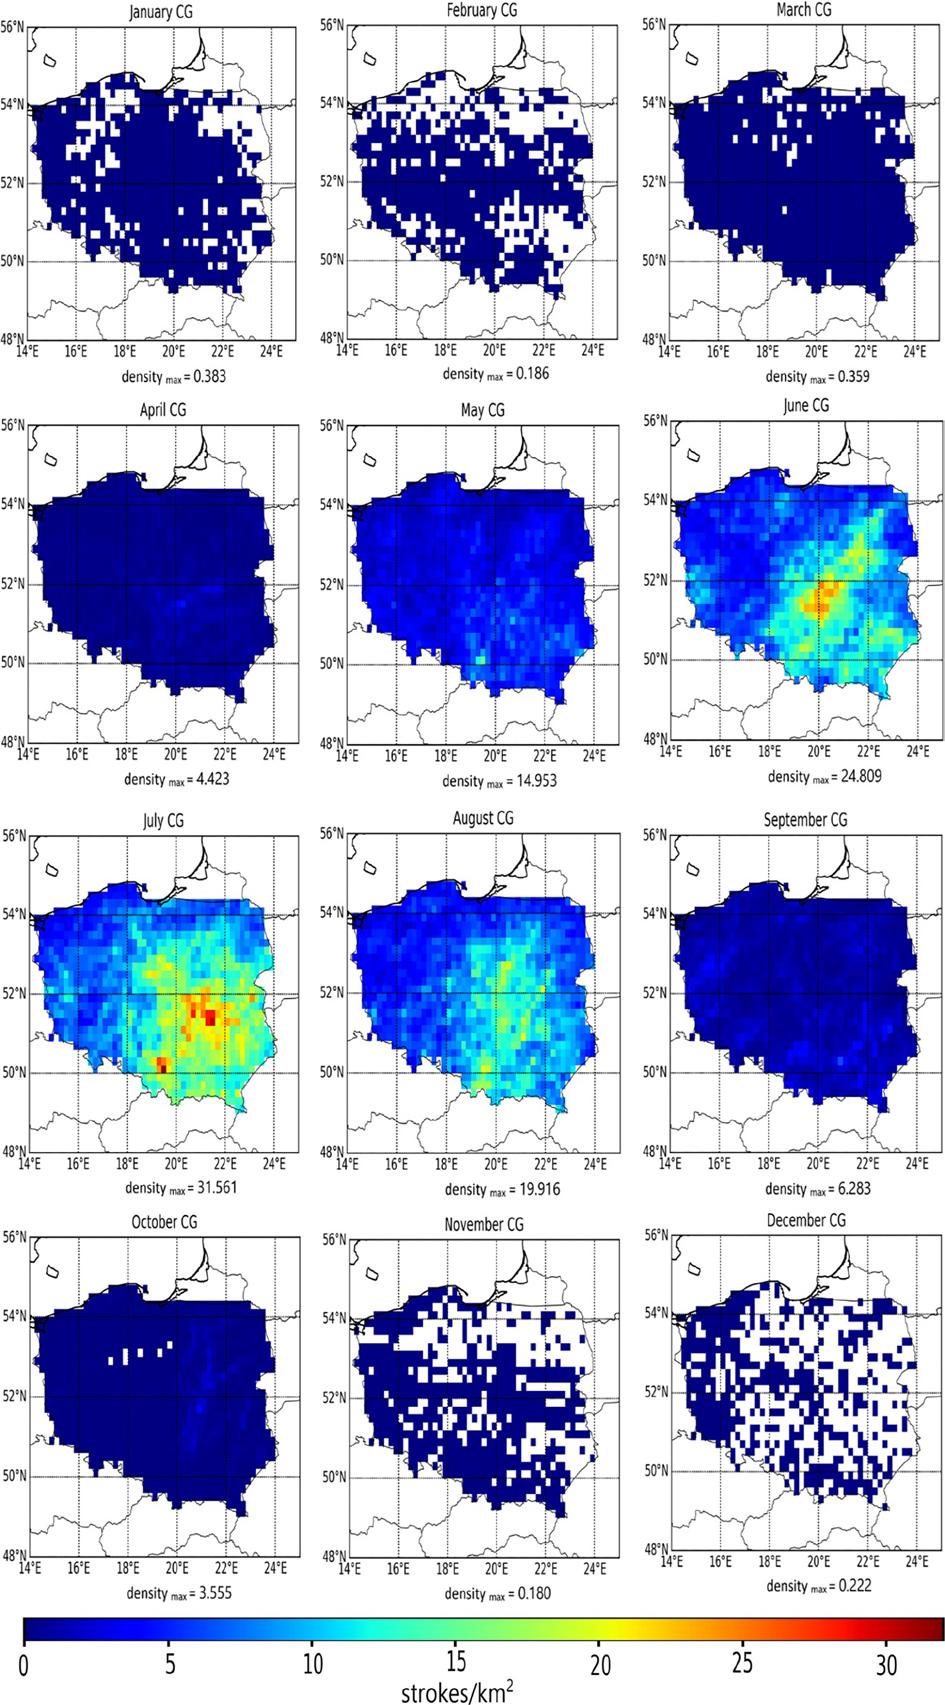
The monthly total CG lightning stroke density spatial variability in km2. Computed for 0.2° × 0.2° grid cells during 2002–2023. Based on CG lightning stroke data derived from the PERUN lighting detection and localisation network and compatible sensors located in the neighbouring countries.
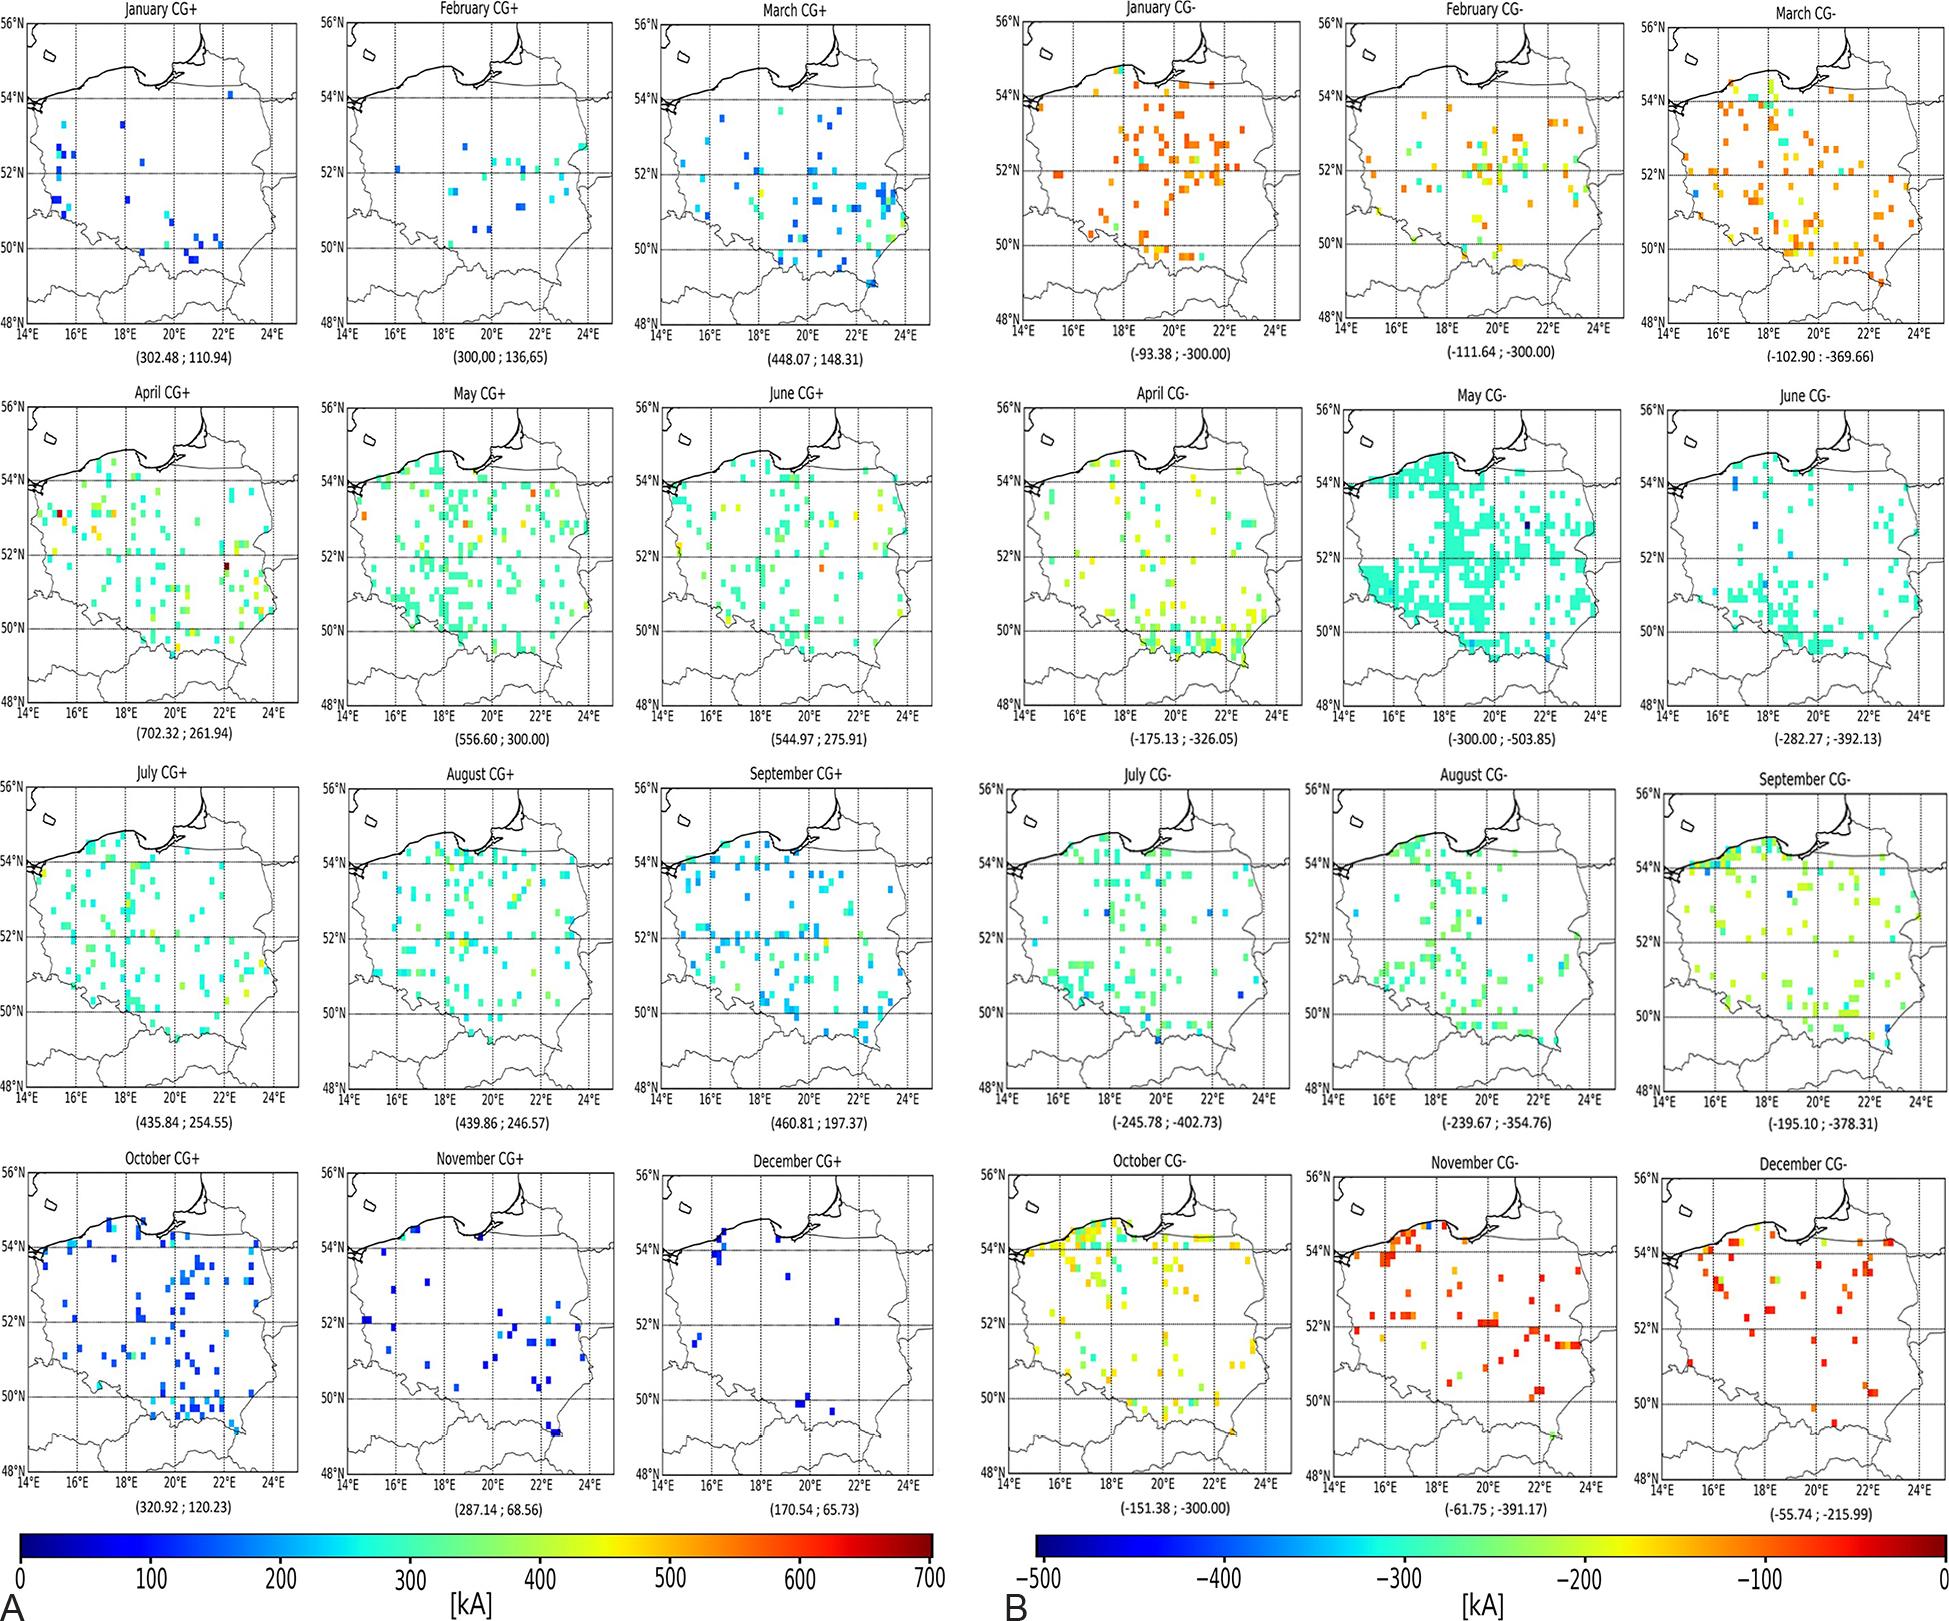
Also, the absolute estimated peak current recorded by the PERUN system in each month was considered to designate the regions of the country that induce the highest current transfers. Both parameters (density and intensity) were mapped within the administrative territory of Poland between 2002 and 2023, excluding the areas of the neighbouring countries (Figs 3 and 4).
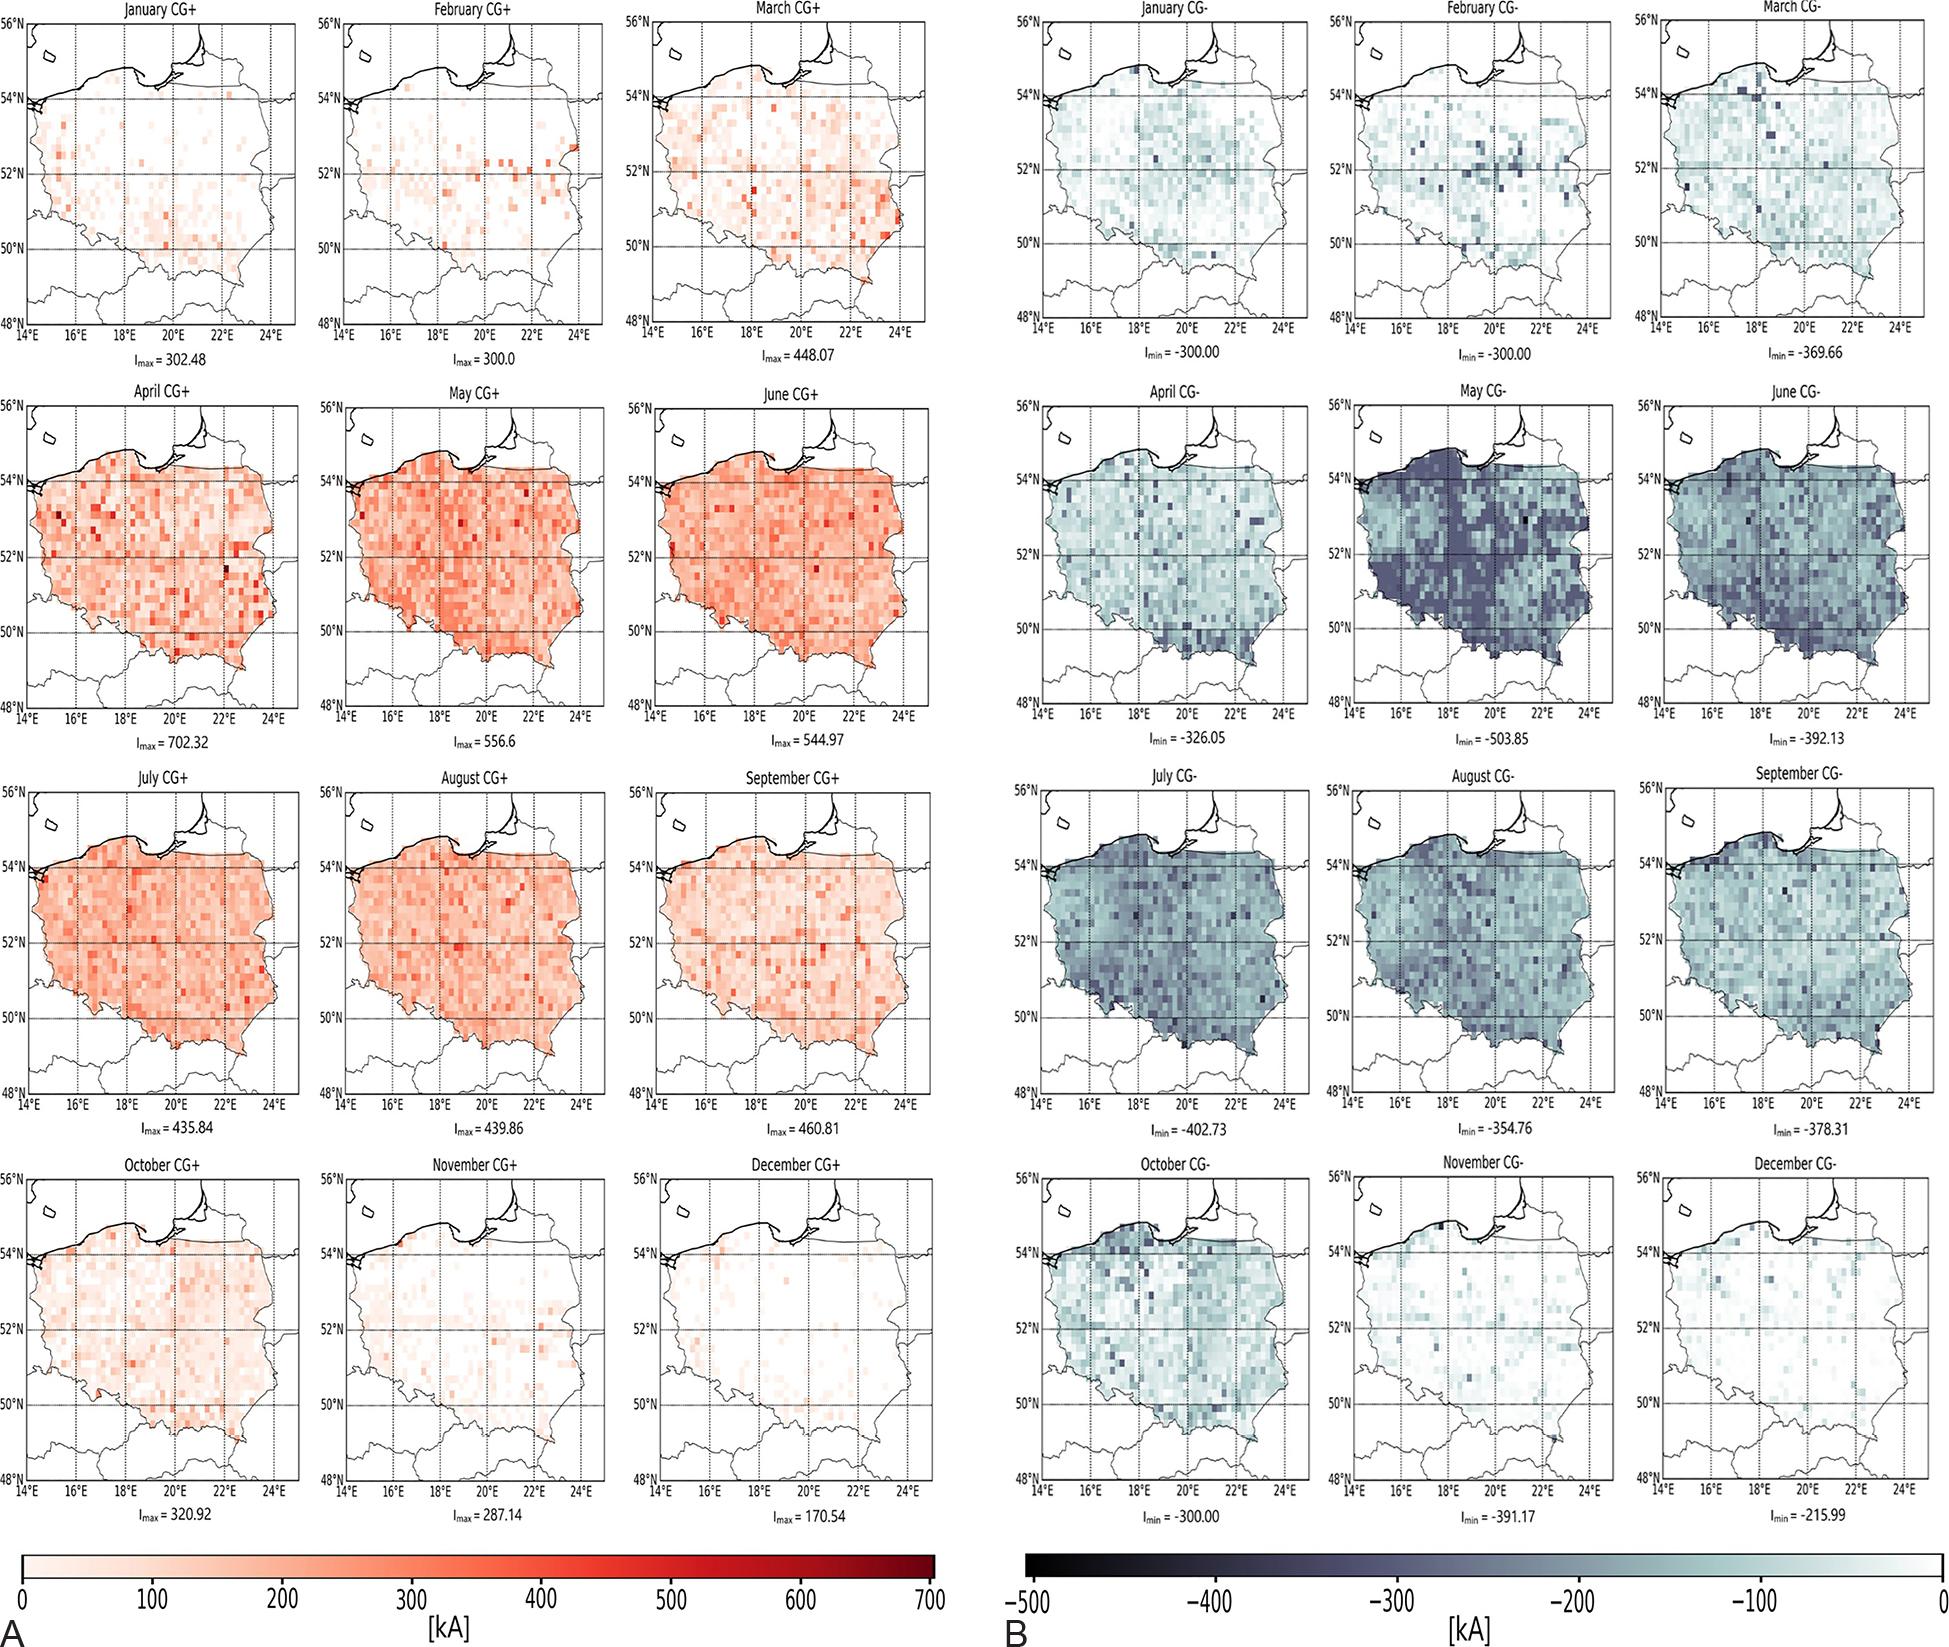
A – The monthly total CG+ intensity spatial variability in km2. Computed for 0.2° × 0.2° grid cells during 2002–2023. Based on CG lightning stroke data derived from the PERUN lightning detection and localisation network, and compatible sensors located in the neighbouring countries. B – The monthly total CG-intensity spatial variability in km2. Computed for 0.2° × 0.2° grid cells during 2002–2023. Based on CG lightning stroke data derived from the PERUN lightning detection and localisation network, and compatible sensors located in the neighbouring countries.
The differences in spatial distribution of the CG lightning strokes presented by the Heat Maps (Fig. 2) and density maps (Fig. 3) result from the calculation methodology. Heat maps consider all population records to define the heat centres of the phenomenon. At the same time, densities calculated here are based only on the lightning events that fall into appropriate grid cells of the matrix. The dual approach makes both mutually complementary and supportive.
Particularly, in the cold season months (November, January and February), spatial differentiation on these two sets of spatial presentations reassembles one another in terms of CG lightning stroke density. During the warm months (May, June, July, August and October), the similarities in the presented densities are even more pronounced, while in March, April, September and December, there are no clear density resemblances, which can be attributed to the gridding techniques applied. The monthly maximal lighting stroke densities show a gradual increase of max densities (Fig. 3) starting in the cold season (November with the lowest record of 0.18 strokes · km−2, through February, December, October, March and January) up to the warm season (through April, September, May, August, June till July with the highest record of 31.56 strokes · km−2).This increase and overall layout of the values are in relatively good agreement with the average lightning flash densities presented by Taszarek et al. (2015) and (Sulik 2022), reassembling most of the densities presented above. The similarities are especially striking in the warm part of the year (April– September) when the densities (however, calculated using data describing different phenomena [lightning flash ≠ lightning stroke]) are in very good agreement, supporting the current findings. It should be noted that the study utilises many more lightning records than previous authors for density calculations (6.91 times more than Taszarek et al., 2015) and intensity (3.47 times more than Sulik 2022). Despite the huge difference in the sheer number of events considered, the similarities are clear, especially during the season when lightning strokes are more abundant as part of storm events. During the cold part of the year, the smaller number of lightning events results in an overall less pronounced likeness in the presented spatial distribution of the densities (which can be partially attributed to the mathematical function of the density itself and partially to the total densities presented in this paper while the previous authors choose the average densities for their work).
The minimal values in November and the maximal values in July can be logically explained by the amount of solar radiation reaching the Earth’s surface, and thus, weaker convection-driven lightning in November, in opposition to the maximal values in July, when the situation is different by the dipole.
The monthly total lightning stroke intensities present similar tendencies as densities (Figs 3 and 4). The lowest maximal intensity for CG+ events was recorded in December at 170.54 kA × km−2, while the highest was in April at 702.32 kA × km−2. In the case of CG– events, the lowest maximal intensity was also recorded in December at –215.99 ka × km−2, while the highest in May, at the beginning of the thunderstorm season, was at –503.85 ka × km−2. The lack of charging mechanisms in the thunderclouds in December is responsible for the low intensities of lightning strokes in this month. However, the maximal intensities in April and May, right at the beginning of the thunderstorm season in Poland, are very interesting. It is agreed, notwithstanding, that lightning in and close to strong updrafts tends to be smaller in terms of power, while events far from strong vertical updrafts have the opposite tendency (Bruning, MacGorman 2013). Thus, in April and May, when the updraft cores are weak and charges in the clouds tend to build in power. When at last the charge is lowered to the ground, in such specific conditions, the intensity of the current is very high.
The spatial differentiation of the CG+ lightning stroke intensity is visible in January (the strong CG+ strokes are located in the western and southern parts of the country), February (the latitudinal storm paths mentioned previously are visible in strong CG+ touchdowns along the storm ways) and in March the majority of the strokes locates in the highlands, south to the 52 parallel. The mentioned regularities are visible again in November (again, south of the 52 parallel and the western part of the country are prolific in powerful CG+ touchdowns) and December (highlands in the south and the western Pomeranian region are pronounced). In the remaining months, there is no clear regularity in the spatial variability of the CG+ lightning strokes. In the case of more numerous CG– lightning strokes, January is a good example of better performance of the PERUN system in the central regions of the country (due to the geometry of the sensor’s displacement). The network detects sparse events more efficiently in areas where the system has better triangulation efficiency. In February and November again, the latitudinal storm paths are visible in the CG– touchdowns. In May, there are some similarities to Heat Map densities in the prevalence of lightning events in central Poland. In October, November and December, there are groups of CG– strokes located in the western Pomerania region due to the warming action of the water of the Baltic Sea in autumn and early winter. The remaining months do not show any strong spatial variability of the CG– lightning strokes.
The proposed LDI uses high records of the lightning stroke energy transfer to calculate the danger of a lightning touchdown in space. It is understandable since it is designed to provide information on lightning’s threat to human life and the economy. The intensity data exceeding the 90th percentile of the whole dataset (dichotomised by the recorded polarisation) were used to visualise the highest intensity variability marking the areas of the country where danger is the most striking (Fig. 5). In the atmosphere influenced by the progressive climate change, the extreme values of 702.32 kA and 503.85 kA (for CG+ and CG–, respectively) recorded in the analysed period can be reached again and exceeded. As a result, the danger of high-energy lightning stroke lowered to the ground is getting higher and requires to be constantly monitored.
A – The monthly total CG+ 9th decile spatial variability in km2. Computed for 0.2° × 0.2° grid cells during 2002–2023. Based on lightning stroke data derived from the PERUN lighting detection and localisation network and compatible sensors located in the neighbouring countries. B – The monthly total CG– 9th decile spatial variability in km2. Computed for 0.2° × 0.2° grid cells during 2002–2023. Based on lightning stroke data derived from the PERUN lighting detection and localisation network and compatible sensors located in the neighbouring countries.
In the part of the year characterised by limited convection (October–April), strong/intense CG+ lightning is sparse and thus visibly corresponds with the total intensity spatial variability, evoking similar conclusions. In the warm season, the abundant population of the CG+ events make such observation impossible. Despite that, it is worth mentioning that in the first 2 months of the year, the northern part of Poland is almost strong CG+ lightning stroke free. However, in the case of CG– lightning strokes mentioned above, strong similarity in spatial variability can be traced throughout the whole year. The difference between polarisations here lies in the abundance of the populations. CG+ lightning strokes are far less numerous than CG–, which strongly influences the spatial variability presented. However, it can be stated that powerful (reaching and exceeding 702.32 kA) CG+ lightning strokes are far more frequent in the first part of the cold season than in the second part in the coastal areas of the Western Pomerania region (which again supports the conclusion about the influence of the warm Baltic Sea waters on the lightning occurrence on the seashore). Also, the long continuous current characterising the CG+ lightning stroke discharge is far more dangerous in terms of industrial and economic safety due to its longtime of transfer, thus causing, e.g., electrical network overvoltage and more frequent fires caused by lightning strokes (Rakov et al. 2003).
The information on lightning stroke localisation and its power (electrical current) is crucial to properly understand the danger that lightning events pose to human life and industry. Climate change brings energy increases in the atmosphere. The comprehensive approach of the Lightning Danger Index utilisation provides a tool for assessing that threat. The proposed LDI is a simple linear relation between densities and intensities of measured lightning strokes. It delivers a piece of essential information on ‘where’, ‘how strong’ and ‘when’ the danger of lightning stroke is greatest (Fig. 6). This knowledge is and will be critical as climate change progresses. It is expected to reach even higher levels.
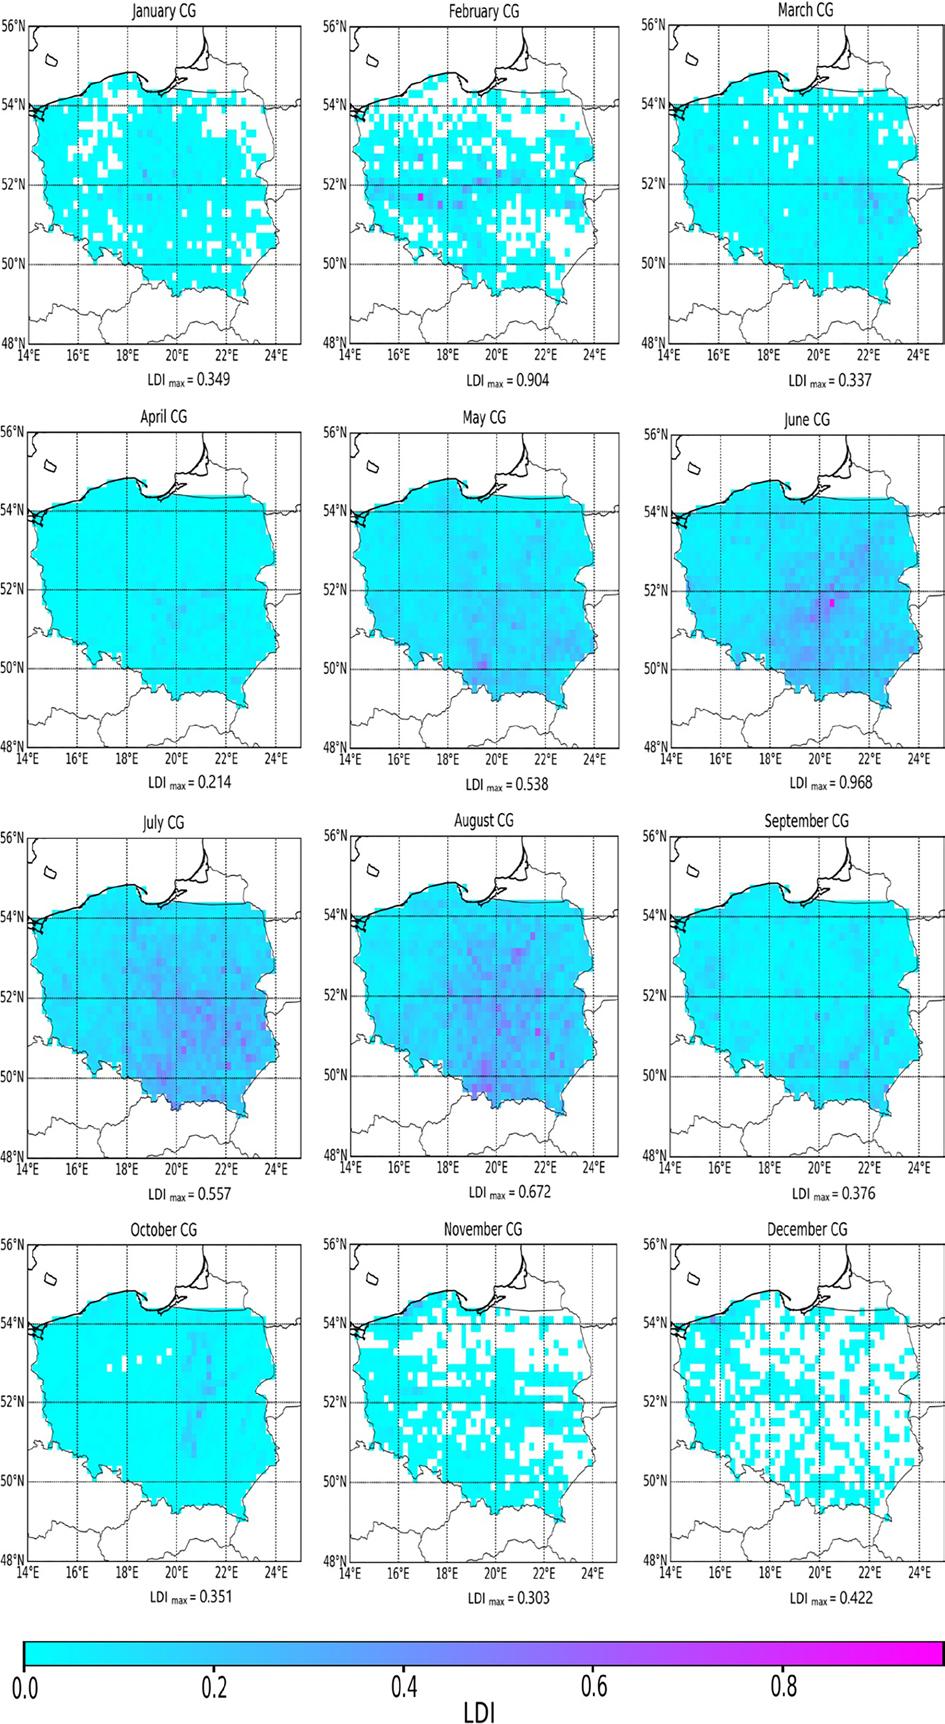
The monthly total CG LDI spatial variability in km2. Computed for 0.2° × 0.2° grid cells during 2002–2023. Based on lightning stroke data derived from the PERUN lighting detection and localisation network and compatible sensors located in the neighbouring countries.
The highest point values of LDI in the period of 2002–2023 were calculated in February, May, June, July and August (Fig. 6). All of these months fit in the climatological ‘thunderstorm season’ in Poland, except for February. In February LDI value of 0.904 was reached South of Poznań in gostyń city. The location is on the typical path of winter thunderstorms, yielding powerful CG+ lightning strokes, coming into Poland from Germany (Fig. 2) and being prolific in numerous and powerful lightning discharges. Also, the latitudinal storm paths are visible in the LDI spatial variability representation in January, February and even March. The average of the remaining ‘thunderstorm season’ months is 0.684. In May, the peak value of 0.538 is connected with the city of Katowice’s urban heat island and prolific air pollutant emissions from the Katowice Ironworks. Here, the lightning stroke density takes the leading role in the LDI calculation (as can be compared with Fig. 3). The vast number of air pollution nuclei (of various sizes and chemical composition) makes the vertical air column more prone to electrical current transfers (lightning strokes) as the pollutants reduce the natural air resistance to the static electricity, increasing at the same time the efficiency of the electric charging mechanism of the storm (Rakov et al. 2003). The presented effect was also visualised by Sulik (2022), however, it was not explained nor discussed.
June, July and August also present high threat values in central and SE Poland, where lightning stroke densities are the driving force in the index calculations. During the cold season, the highest danger defined by LDI is located in the Western Pomerania region on the seashore of the Baltic Sea, leaving the northeast part of the country relatively safe in terms of lightning stroke danger.
It must be stressed that LDI strongly depends on the calculated densities (multiplicand factor in the proposed equation). However, the equation assumes a linear relation between the factors of the equation; it is clear that lightning stroke density has a substantial impact on the result of the equation (Fig. 7). The LDI can be used to calculate the lightning flash danger too, by simply substituting into the equation the parameter variable of the lightning flash. In this case, however, the calculated LDI index spatial analysis result will be pretty different as the lightning flash yields many times smaller multiplicity (sometimes by order of magnitude); thus its impact on the result will be accordingly smaller, shifting the fragile balance of the factors to the multiplier (intensities) part of the equation.
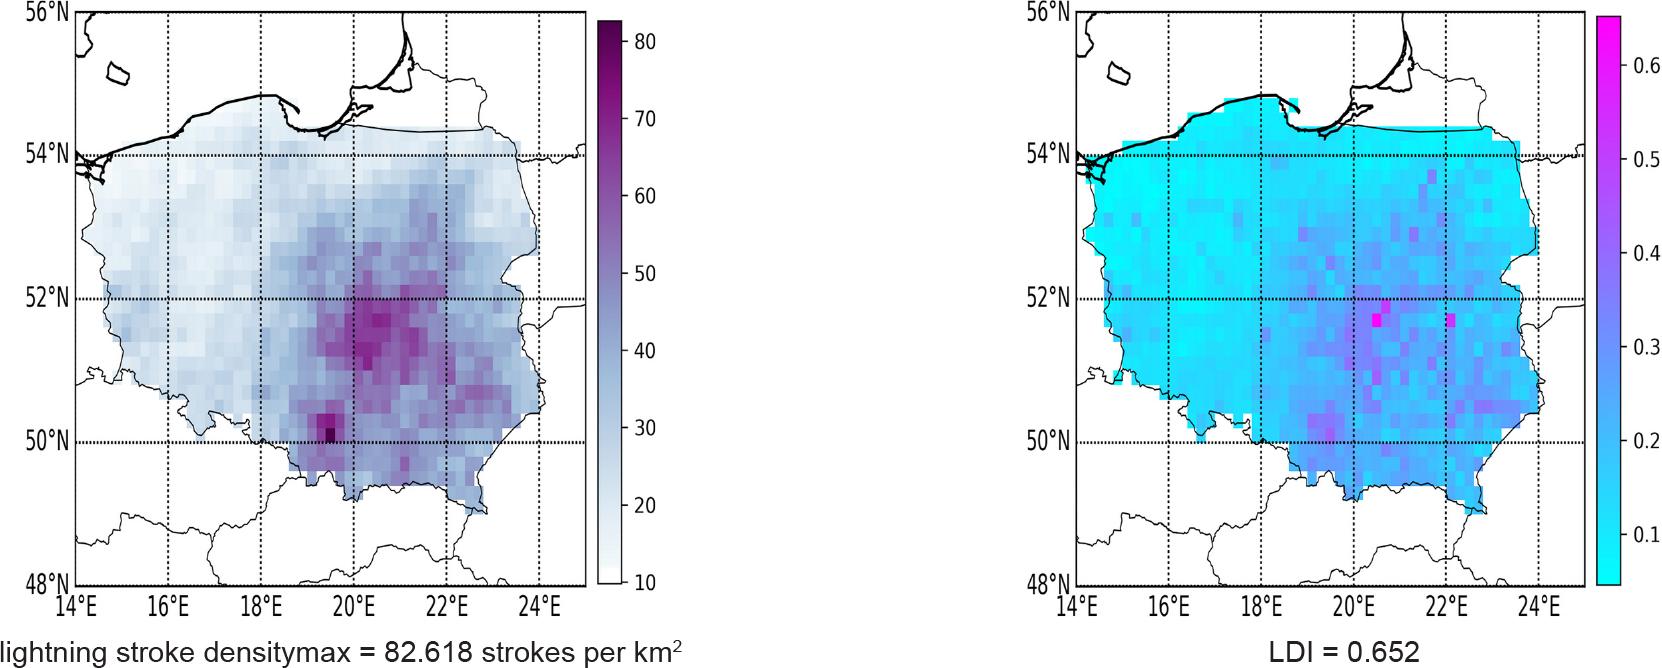
The mutual relation between 2002 and 2023 CG lightning stroke density (left panel – both lightning stroke polarities]) and LDI (right panel) of the same period.
During the analysis of the study period, it became apparent that the number of lightning strokes has a rising trend (Fig. 8). This is because climate warming processes are influencing constantly increasing convection forcing (especially deep convection), which in turn is responsible for the electrification processes within the thunderstorm clouds (Rakov, Uman 2003). The growing trend in the number of lightning strokes of both polarities in Poland indicates that shortly, a further rise in those numbers is to be expected.
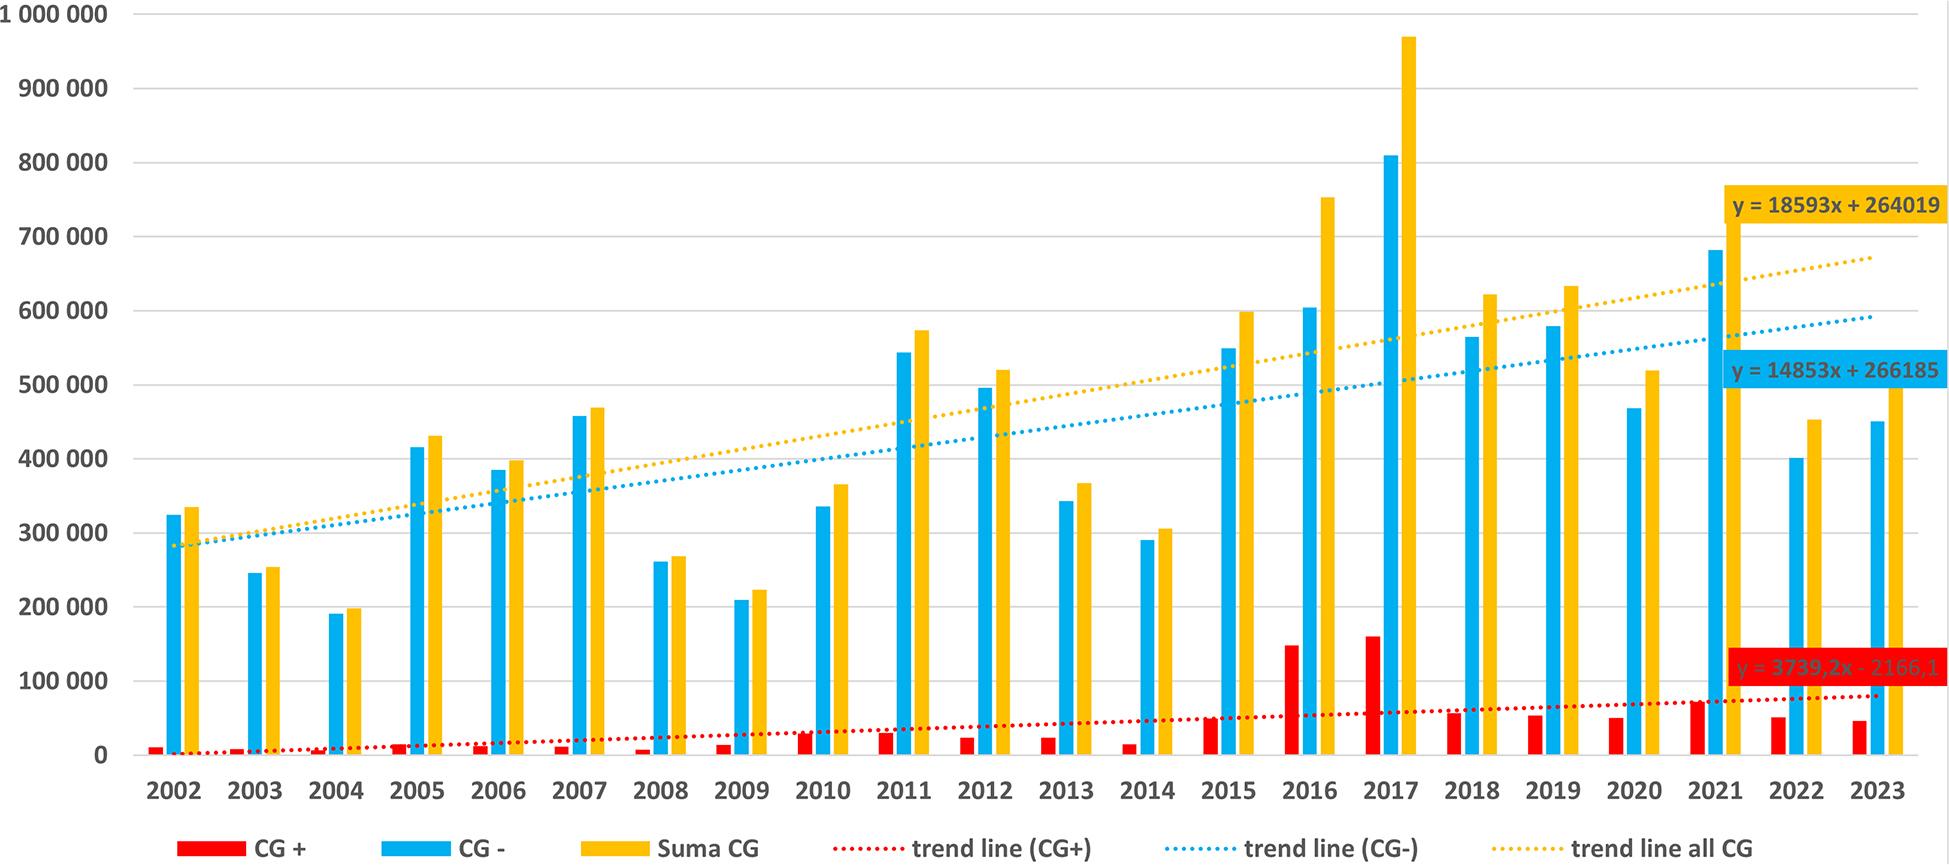
Annual sums of lightning strokes acc. to types for Poland in the 2002–2023 period.
The variability of the phenomenon (maximal modulus current records of both polarities) is consistent in presenting the stable increase in the power (current) of the lightning strokes throughout the analysed period (statistical significance calculated on the level α = 0.05 of Student’s test is present except for CG– March and October [see Table 1]). Similarly, as in the case of the sheer number of lightning events, this power (intensity) trend seems to be stable and should be treated as a predictor for future environmental changes as climate change progresses. It is worth mentioning that an especially strong increase in the current power is seen before the beginning of the traditionally understood thunderstorm season in Poland (May–August) and after it ends. This trend in the positive polarity CG lightning strokes is visible in January, February, April, June, July, September and December (regression slope a >12), reaching its maximum in April, while in negative polarity CG events in July, November and December (also a >|12|), with a maximum in November.
Linear regression equation (y = ax + b) and determination coefficient (R2) calculated for both CG lightning stroke polarities throughout all analysed periods.
| Month | Lightning stroke polarisation | |||
|---|---|---|---|---|
| CG+ | CG– | |||
| y = ax + b | R2 | y = ax + b | R2 | |
| January | y = 13.879x + 3.66 | 0.6181 | y = –11.31x – 64.467 | 0.2391 |
| February | y = 14.863x + 13.61 | 0.3034 | y = –10.373x – 30.107 | 0.2824 |
| March | y = 11.839x + 147.99 | 0.4005 | y = –6.4458x – 164.47 | 0.1545 |
| April | y = 22.99x + 148.22 | 0.4399 | y = –7.3853x – 226.65 | 0.4459 |
| May | y = 12.473x + 233.57 | 0.6575 | y = –5.1407x – 270.09 | 0.2713 |
| June | y = 15.614x + 216 | 0.5637 | y = –8.3806x – 247.83 | 0.3875 |
| July | y = 13.932x + 221.91 | 0.6835 | y = –12.032x – 227.91 | 0.6370 |
| August | y = 10.588x + 241.13 | 0.5576 | y = –6.3636x – 259.84 | 0.4303 |
| September | y = 13.974x + 206.04 | 0.6347 | y = –7.6922x – 238.83 | 0.6388 |
| October | y = 7.1687x + 210.76 | 0.3345 | y = –4.3605x – 245.87 | 0.1555 |
| November | y = 9.7656x + 94.167 | 0.3599 | y = –16.427x – 49.258 | 0.5741 |
| December | y = 13.813x + 31.565 | 0.5812 | y = –12.436x – 67.113 | 0.3457 |
Bolded notations are statistically significant at the level α = 0.05 of the Student test.
As the lean in the lightning stroke regression slopes is clear, the further utilisation of LDI seems recommended.
The intensifying climate change observed worldwide impacts Poland’s regional climate. The growing number of extreme meteorological phenomena influences human outdoor activities and industry. The analysis of almost 30 million cases of proven CG lightning strokes (intense current connections of both polarities from the cloud base to the ground) led to the following conclusions:
The annual number of lightning strokes, as well as for all months and both polarities of lightning strokes shows a constant increase in the current power and lightning number during the analysed period, which can be noted as a tendency that will be continued in future.
However, different by order of magnitude from flashes, the maximal lightning stroke densities calculated for Poland present clear similarity to the lightning flash densities analysed by Taszarek et al. (2019) and Anderson and Klugmann (2014). There, densities reached their lowest values along the coast of the Baltic Sea, while the highest were in the centre and southeast of the country. However, acquired for a much shorter period still supports the results obtained in this study.
The analysis of the lightning stroke power (especially in April, November and December) led to the conclusion of slowly extending the length of the thunderstorm season in Poland.
The proposed Lightning Danger Index (LDI) is a simple, fast computing and useful indicator of the danger posed by the lightning stroke. It combines two different pieces of information on density and intensity and merges them, providing blended information that is easy to interpret by all users. The detailed/separate analysis of both individually requires certain knowledge on the way the system works, what densities are, what intensities are and finally, how they interact with one another. This knowledge is not widespread. That is why LDI was created – to make the interpretation easy and fast for the end user. However, it can be easily turned to compute the danger level posed by lightning flashes also. The LDI computation can be run in the operational mode too, utilising near-real-time information delivered by any ground-based lightning detection and localisation system that is capable of recording basic parameters in any area. Thus, it can be used in the everyday work of the synoptic forecasting offices of the National Weather Service.
The LDI can be utilised for monitoring the lightning stroke threat in the vicinity of crucial industrial plants, areas of National Parks (e.g. Tatrzański National Park, where the risk of lightning stroke is big) and large outdoor events (musical concerts, military exercises, airports, etc.) improving the decision-making within critical procedures of health and safety. LDI can be utilised to calculate short-term/Near Real Time danger for lightning occurrence on an arbitrary given territory.
The LDI shows its highest values in the central and South East parts of Poland within the analysed 22-year period. It is especially pronounced South West of the capital city of Warszawa, reaching a top point value of 0.968 in June. Also, high point values are mapped West from Radzyń Podlaski. Another region with high indices is the area of Katowice city in the Upper Silesia region of the country.
The lowest values of LDI are visible in the Western Pomerania region of Poland on the seaside, reaching only 0.1 and lower.
The average LDI value within the 22 years for the whole of Poland is 0.652; however, this value will rise in the future due to an increase in both the density and intensity of detected lightning stroke events.