
The accelerating rise in average global air temperature associated with a warming climate brings with it implications of increasingly extreme weather events (IPCC 2021). In Europe, a particularly intense increase in annual mean air temperature has been observed since the mid-1980s and is described as possibly the greatest warming in the past 2000 years (Luterbacher et al. 2016). In addition to the average temperature, there is an increase in the maximum daily temperature and, to an even greater extent, in the minimum daily temperature, which is considered a descriptor of climate change (Alexander et al. 2006, Davy et al. 2017). The increase in daily minimum temperature during the summer leads to an increasing incidence of tropical nights (TNs) (Dong et al. 2017), also known as hot nights. The threshold values for defining TN vary depending on the location in the world. A daily minimum temperature of 23°C (Nastos, Matzarakis 2008) and sometimes even 28°C (Observatory 2024) is given as a threshold for the occurrence of TN. In most parts of Europe, a TN is defined as a situation when the minimum temperature during the 24 h, in this case night, does not fall below 20°C (Tmin ≥ 20°C) (Fischer, Schär 2010, Gröger et al. 2021), and such a definition was used in this paper. The occurrence of TNs in Mediterranean countries, or in Southern Europe, is a common phenomenon, although a significant increase in their incidence is also observed there (Tasić 2016, Dong et al. 2017, Elizbarashvili et al. 2017, Correa et al. 2024). Also, studies conducted for the entire northern hemisphere (Yeh et al. 2021) as well as globally (Alexander et al. 2006) have shown a systematic increase in TNs. In recent years, the literature has also reported examples of equatorial nights (Tmin ≥ 25°C) (González et al. 2023) and even hot nights (Tmin ≥ 30°C) (Correa et al. 2025).
In Poland, TNs, to date, have not often been analysed in the literature due to their relatively rare occurrence. Chełchowski (1963, 1967, 1968) was the first to describe them, and it was such a rare phenomenon at the time that he focussed on describing each case. As the years passed, TNs became an increasingly common phenomenon. While back in the 1970s and 1980s, TNs were recorded at a given synoptic station once every few years, and at some even less frequently, their number began to increase rapidly in the following decades. Each successive decade brought an increase in the number of TNs, and they also began to appear in locations where they had not previously occurred (Bielec-Bąkowska, Piotrowicz 2013). The occurrence of TNs is also compounded by the presence of the so-called urban heat island (Błażejczyk et al. 2014, Park et al. 2022). For this reason, the phenomenon is far more likely to be observed in highly urbanised areas than in stations located far from large cities (kuchcik 2006, Royé, Ezpeleta 2015, Chapman et al. 2017). The occurrence of TNs also carries negative health consequences for humans because during hot nights and the lag time in the night-time cooling of urban dwellings (Thornburgh 2001), the human body is unable to recover properly (Yavaşli, Erlat 2024), especially since TNs are often preceded by the occurrence of hot (Tmax ≥ 25°C) or scorching (Tmax ≥ 30°C) days (Hajat et al. 2002). TNs are often cited as the cause of a higher number of deaths in an area (Michelon et al. 2005, Royé 2017, Hagen, Weihs 2023, Jaagus et al. 2024) and even an increased number of traffic accidents (Kornus et al. 2017).
The purpose of the analyses was to determine the scale of changes that occurred in the occurrence of TNs in the multiannual period 1951–2024 in 17 cities in Poland, both temporally and spatially, and to determine how the obtained results are affected by the location of a given synoptic station in relation to its immediate surroundings.
Poland is a country located in central Europe, at the interface of the clash of air masses arriving from over the Atlantic and from the interior of the continent (Institute of Meteorology and Water Management, National Research Institute 2013). Hence, Poland’s climate is described as temperate transitional (Woś 2010). The average annual area air temperature in Poland is 8.7°C (Marosz et al. 2023), while the average temperature for the summer season (2000–2023) is 18.3°C (IMGW 2024).
Data on minimum daily temperatures for 17 cities in Poland for the years 1951–2024 were analysed (Fig. 1, Table 1), with the exception of Rzeszów, for which the data are for the years 1952–2024. The data were obtained from the resources of the Polish Institute of Meteorology and Water Management (Pol. Instytut Meteorologii i Gospodarki Wodnej). Minimum air temperatures from May to September were taken into account, since TNs in Poland occurred only during these months. The observed cases of TNs were characterised in terms of their number of occurrences, the length of continuous periods (TNs in a row) during which they occurred, simultaneous occurrence at several stations, and the number of TNs in each decade. It should be noted that to illustrate the extremes of the phenomenon, the period 2021–2024 was compared to full decades.
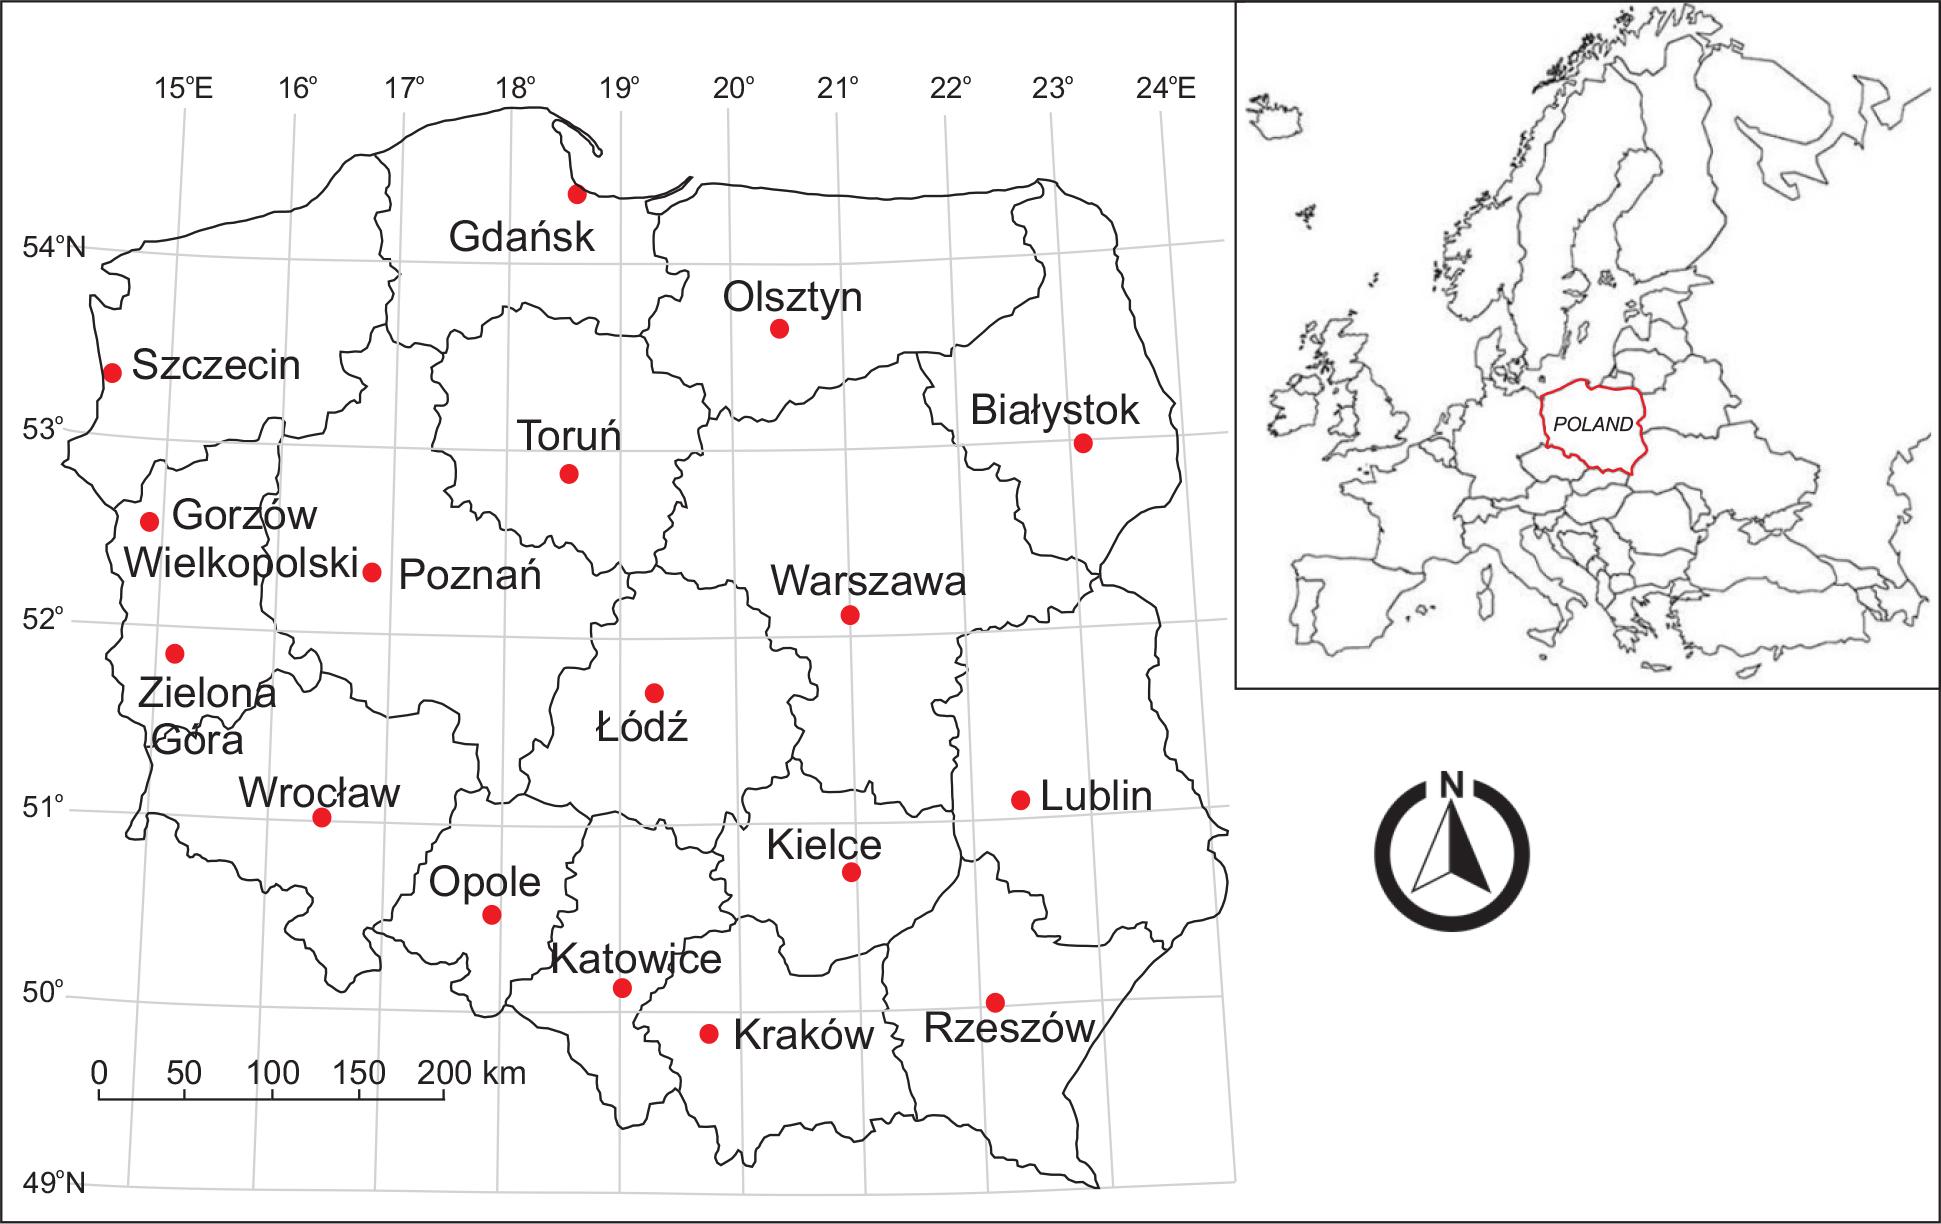
The study area with the analysed synoptic stations marked.
Basic parameters of the analysed research stations which are arranged in the west-east direction; TN – tropical night.
| Station | Longitude | Latitude | Altitude [m a.s.l.] | TN/10 years growth |
|---|---|---|---|---|
| Szczecin | 14°37'22" | 53°23'43" | 1 | 0.12 |
| Gorzów Wielkopolski | 15°16'38" | 52°44'28" | 71 | 0.50 |
| Zielona Góra | 15°31'28" | 51°55'49" | 192 | 0.51 |
| Poznań | 16°50'09" | 52°25'02" | 88 | 0.46 |
| Wrocław | 16°54'00" | 51°06'12" | 120 | 0.25 |
| Opole | 17°58'08" | 50°37'37" | 163 | 0.30 |
| Gdańsk | 18°29'12" | 54°22'16" | 7 | 0.41 |
| Toruń | 18°35'43" | 53°02'31" | 69 | 0.32 |
| Katowice | 19°01'58" | 50°14'26" | 278 | 0.08 |
| Łódź | 19°23'59" | 51°43'24" | 174 | 0.06 |
| Kraków | 19°48'07" | 50°04'49" | 236 | 0.00 |
| Olsztyn | 20°25'22" | 53°46'16" | 133 | 0.06 |
| Kielce | 20°41'32" | 50°48'37" | 260 | 0.03 |
| Warszawa | 20°57'40" | 52°09'46" | 106 | 0.42 |
| Rzeszów | 22°02'32" | 50°06'39" | 206 | 0.34 |
| Lublin | 22°23'37" | 51°13'01" | 238 | 0.02 |
| Białystok | 23°09'44" | 53°06'26" | 148 | 0.11 |
During the entire 1951–2024 period, a total of 787 TN cases occurred at the 17 synoptic stations considered (Fig. 2A). This means that an average of 10.64 TNs per year were recorded in the entire study area during the studied multi-year period. The highest number, 161 TNs were observed in Zielona Góra, which accounts for 20.5% of all such cases in the period under review (2.18 TNs per year). On the contrary, the least, only eight TNs were recorded in Białystok (1% of all cases, 0.11 TNs per year). When broken down by decade, the fewest cases of nights with air temperature ≥ 20°C occurred in 1951–1960, with 27, while the most occurred in 2011–2020, with 258 such situations (Fig. 2B). During the entire 74-year period, there were 11 years in which no TNs occurred (the last such situation occurred in 2008), while in the remaining 63 years, at least one such case was recorded (Fig. 3), with the highest number, 58, occurring in 2010. Broken down by month, TNs occurred mainly in July (Tables 2 and 3), and there were 380, accounting for 48.3% of all cases. There were 277 TNs in August (35.2%), and 113 in June (14.4%). TNs also occurred in September, 15 (1.9%), and even as early as May, 2 (0.3%). On 14 occasions, only one TN occurred in the country during the year. In the remaining years, the time interval in which TNs occurred was longer, with the greatest spread in 2019 and 2024, when 83 days passed between the earliest and latest TN (Fig. 4). In the entire analysed period of 1951–2024, the earliest TN during the year was recorded on May 17 in olsztyn in 1983, while the latest on 17 September in Rzeszów in 2015. The highest minimum temperature in the entire measurement period was recorded in Gdansk on 31 July 1994, and it was 24.4°C. In 89 cases, these were the lower limits for the definition of TN, i.e., 20.0°C. All TNs were divided into time sequences in which they occurred at the stations in question, i.e., a single night, two nights in a row, etc. The TNs occurred as singles 537 times (Table 4). Less frequently, TNs were arranged in multi-night sequences. Sequences of two consecutive TNs were recorded 77 times, 20 of them in Zielona Góra, and 19 times of TNs occurred three in a row. The most extreme situations occurred in Zielona Góra, where up to nine TNs in a row were recorded, and in Gdansk, when TNs occurred seven nights in a row. Both events occurred at the same time, 26 July 1994–3 August 1994 and 29 July 1994–4 August 1994, respectively. The largest spatial extent of TN occurrence took place on 10 July 2024 when minimum temperatures ≥ 20°C were recorded at 10 stations (Fig. 5). In 2022 and 2024, TNs were recorded in a total of up to 16 of the 17 cities analysed (Fig. 6). The highest rate of an increase in the number of TNs is in Zielona Góra, with an increase of 0.51 TNs/10 years. High rates were also recorded in Gorzów Wielkopolski, up 0.50 TNs/10 years, Poznań, up 0.46 TNs/10 years, Warsaw, up 0.42 TNs/10 years, and Gdańsk, up 0.41 TNs/10 years (Table 1).
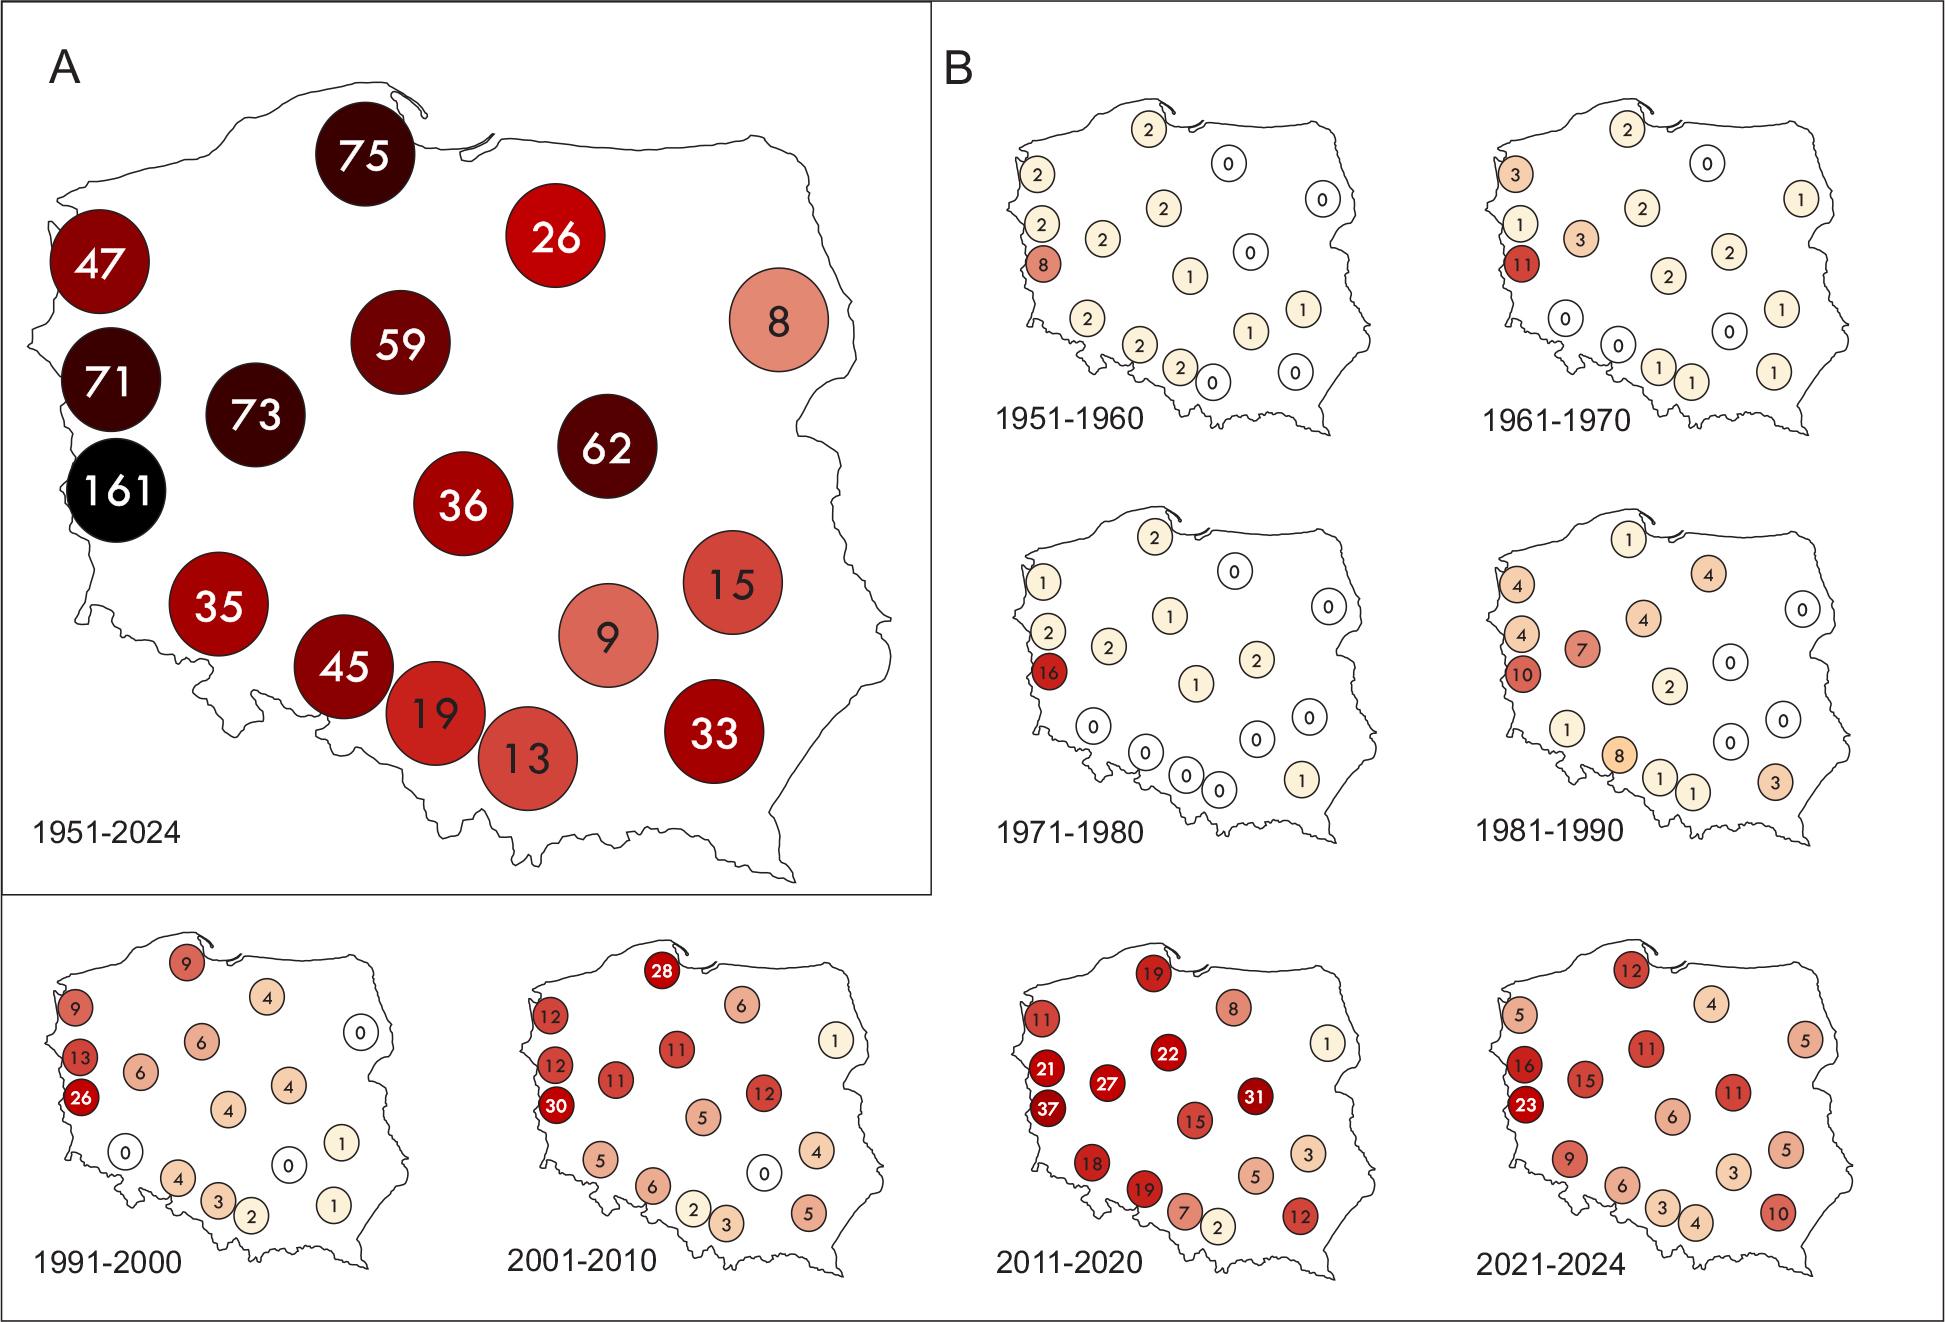
Sum of tropical nights (TNs): A – for the entire period 1951–2024; B – for individual decades (1951–2020) and years 2021–2024.
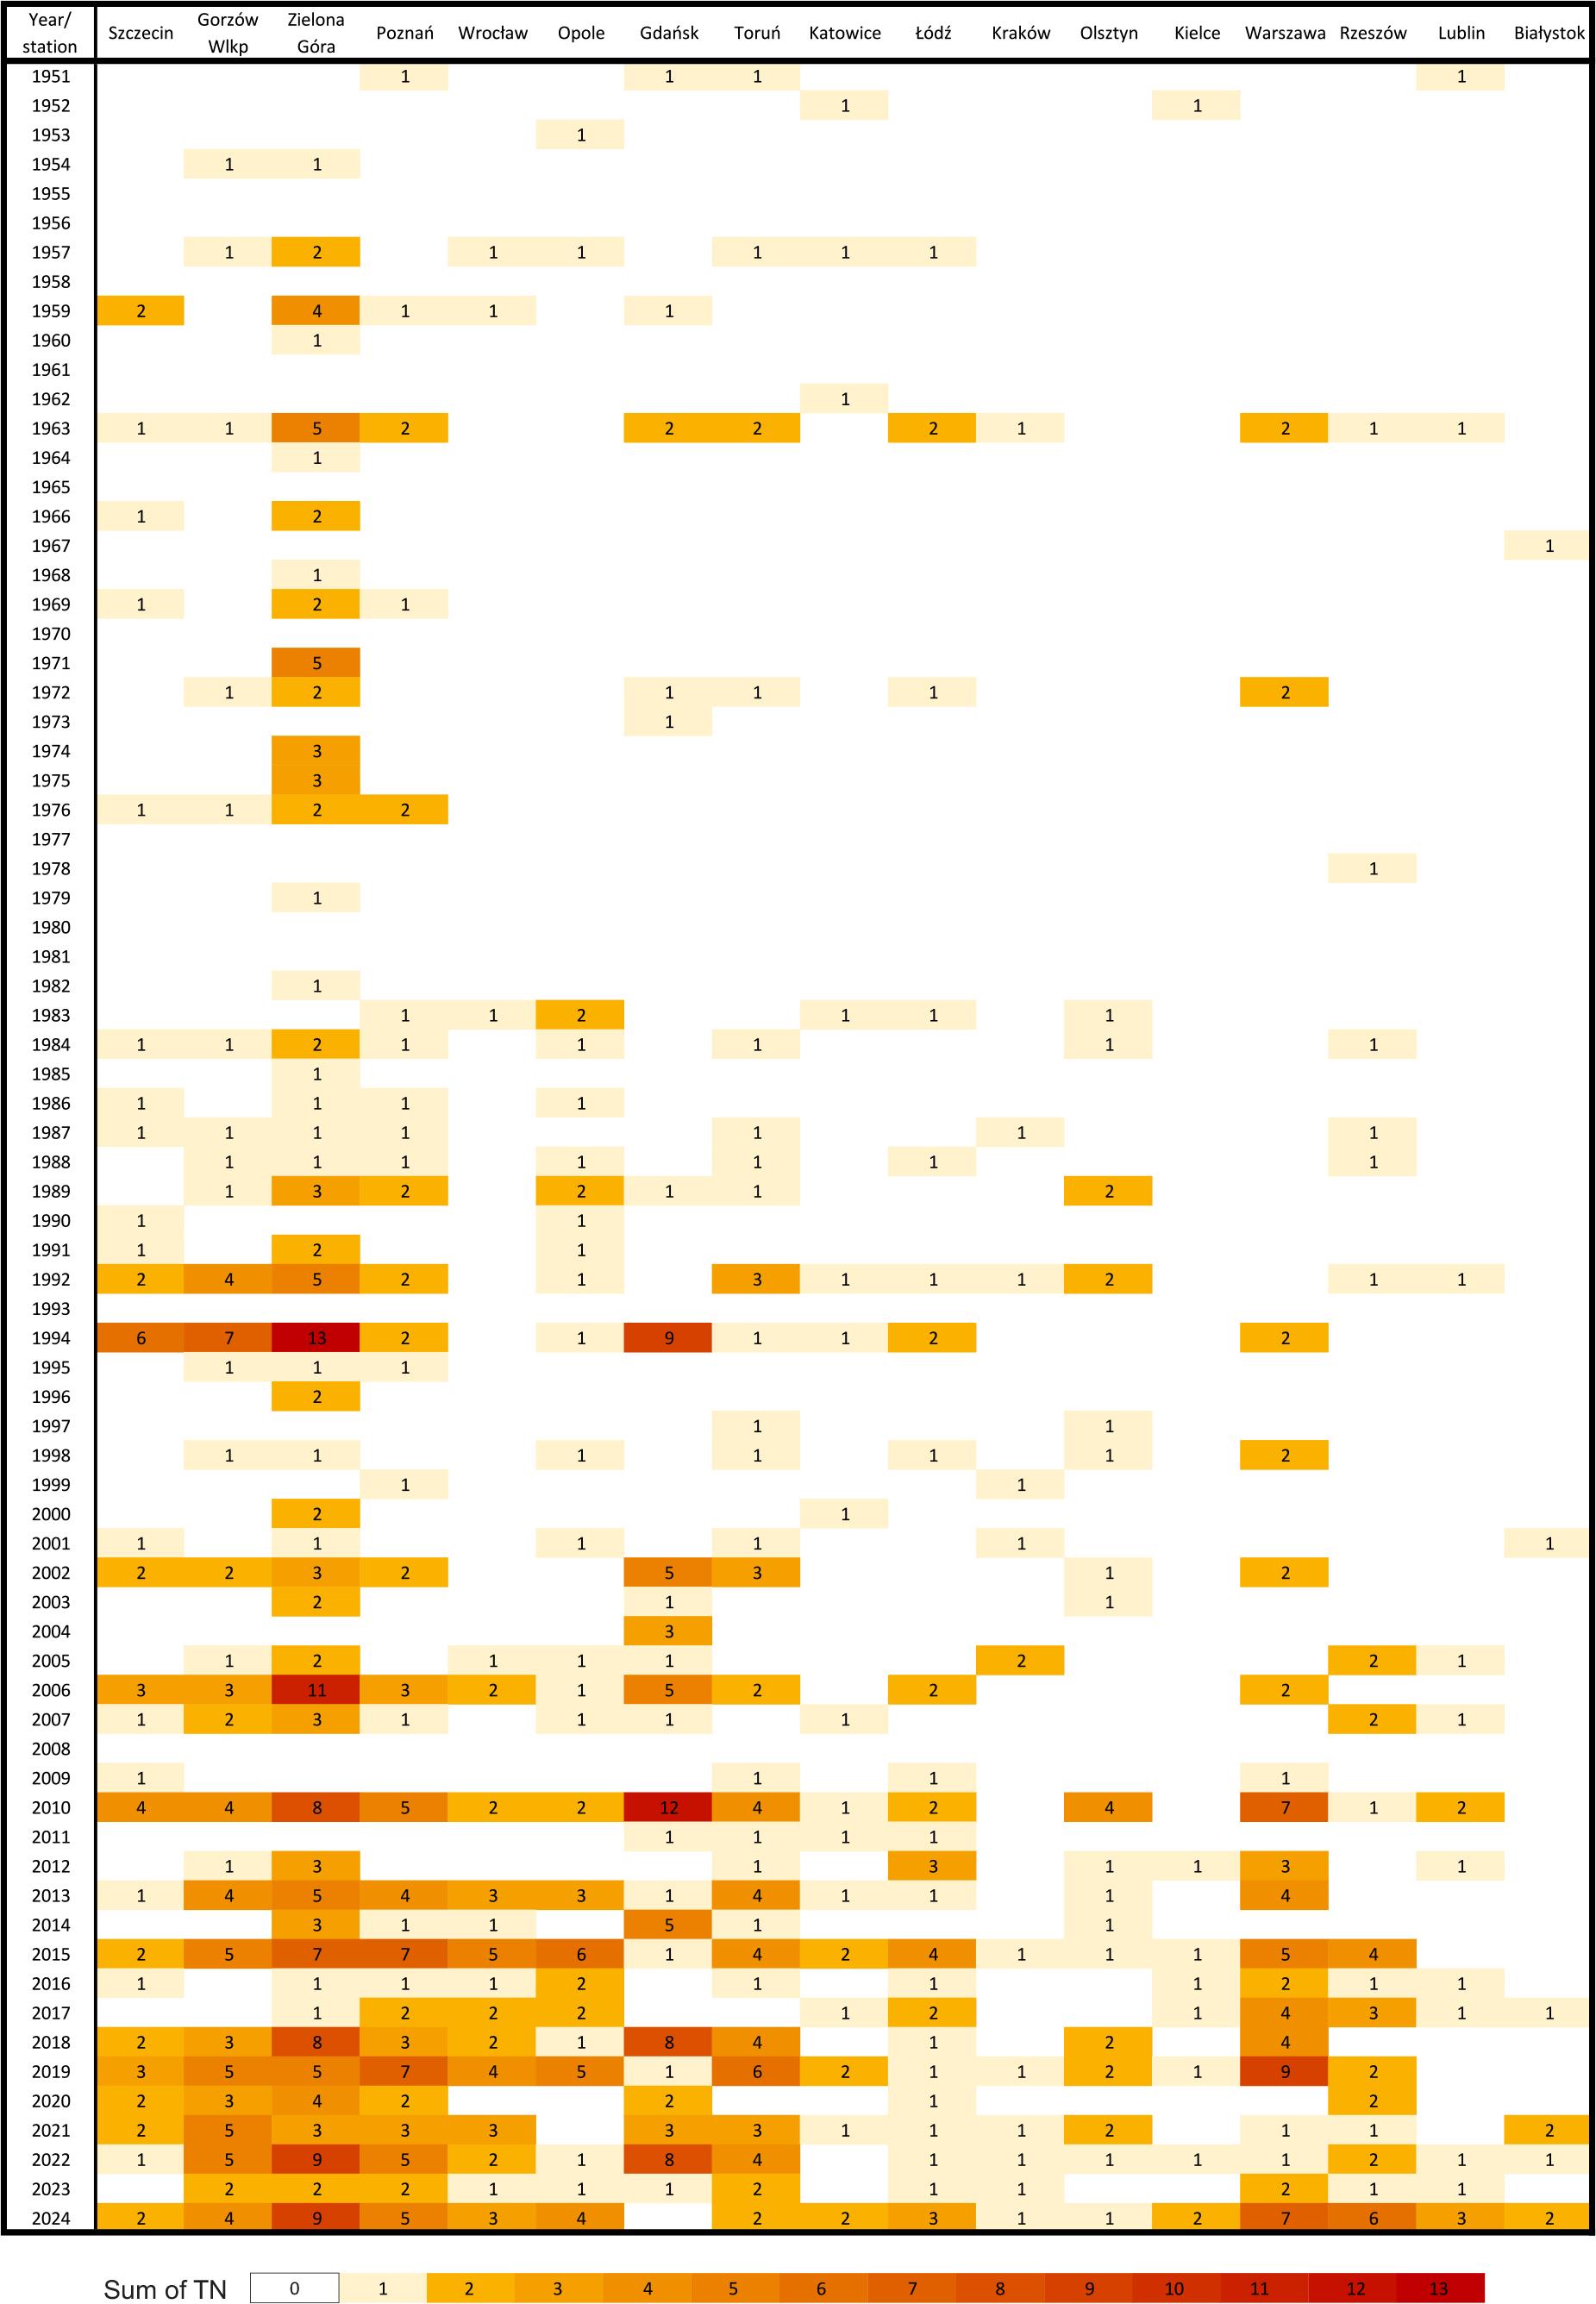
Distribution of tropical nights (TNs) in individual years. Stations are arranged in the west-east direction.
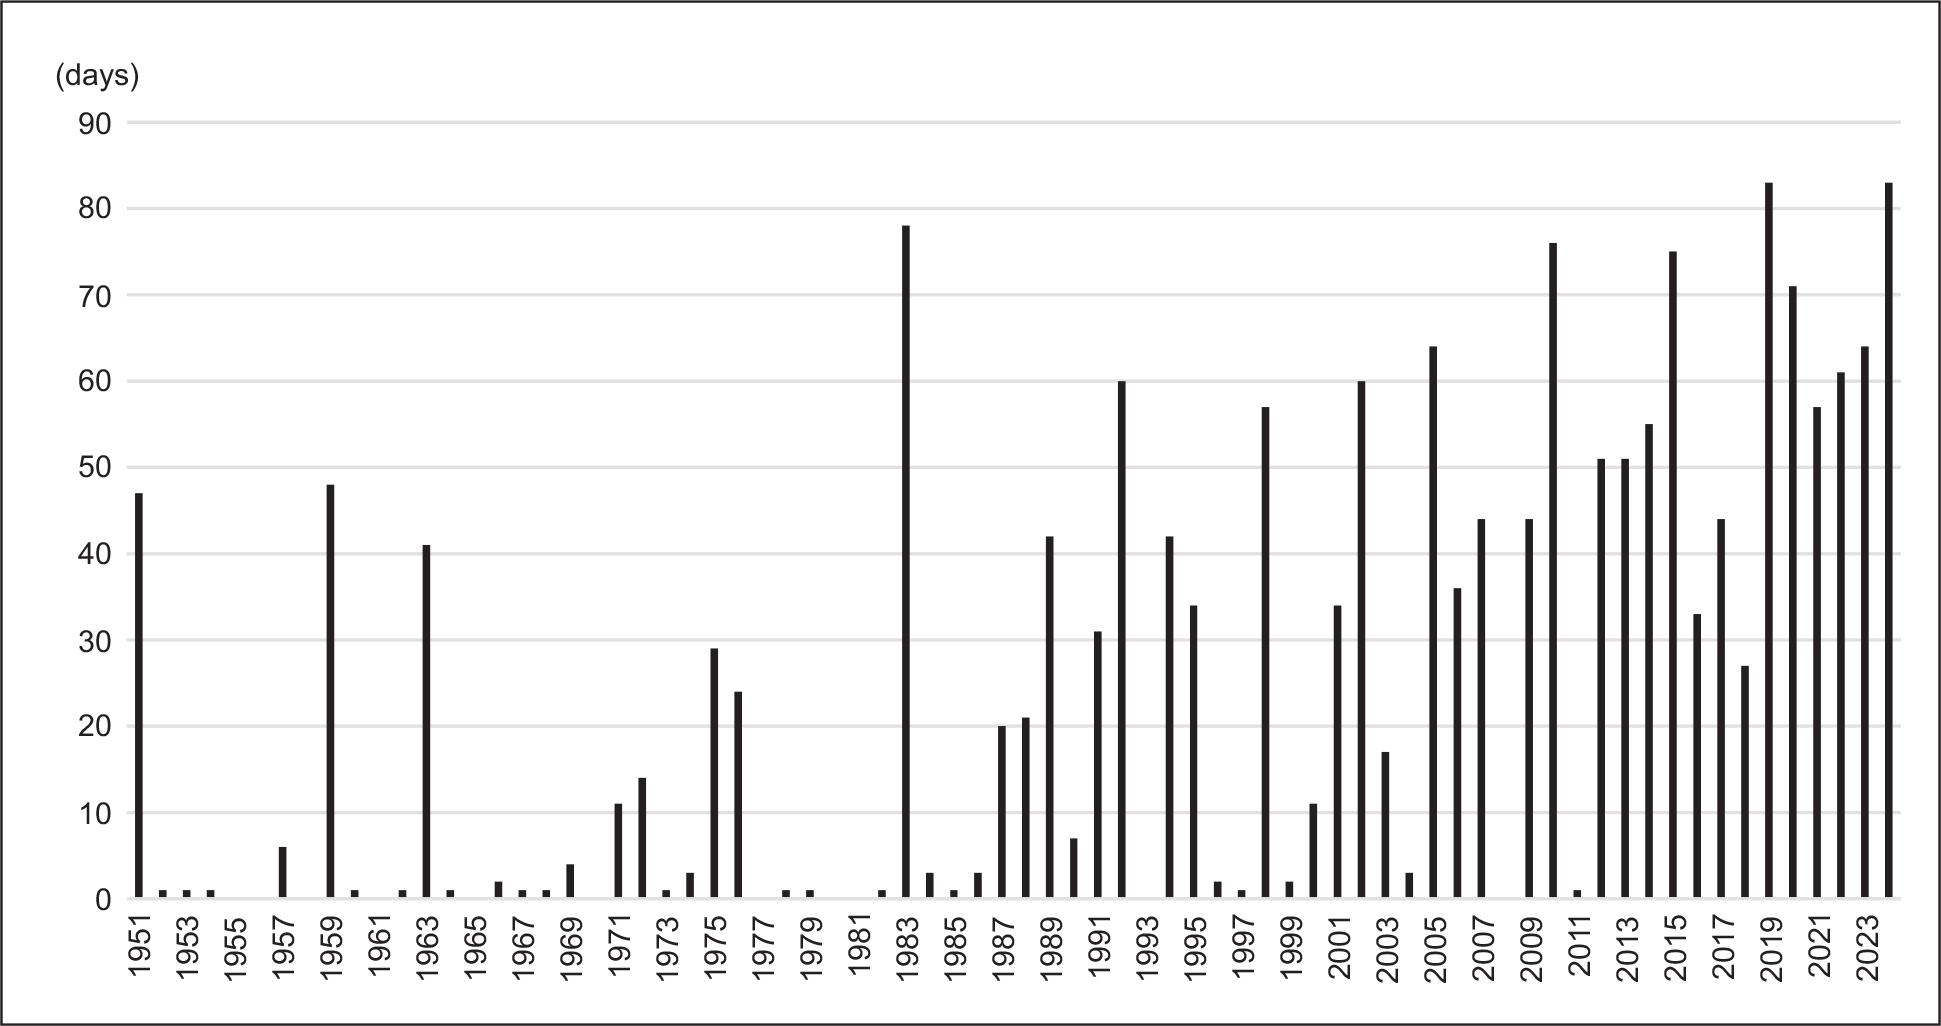
Number of days between the occurrence of the first and last tropical night (TN) in particular years in the analysed area.
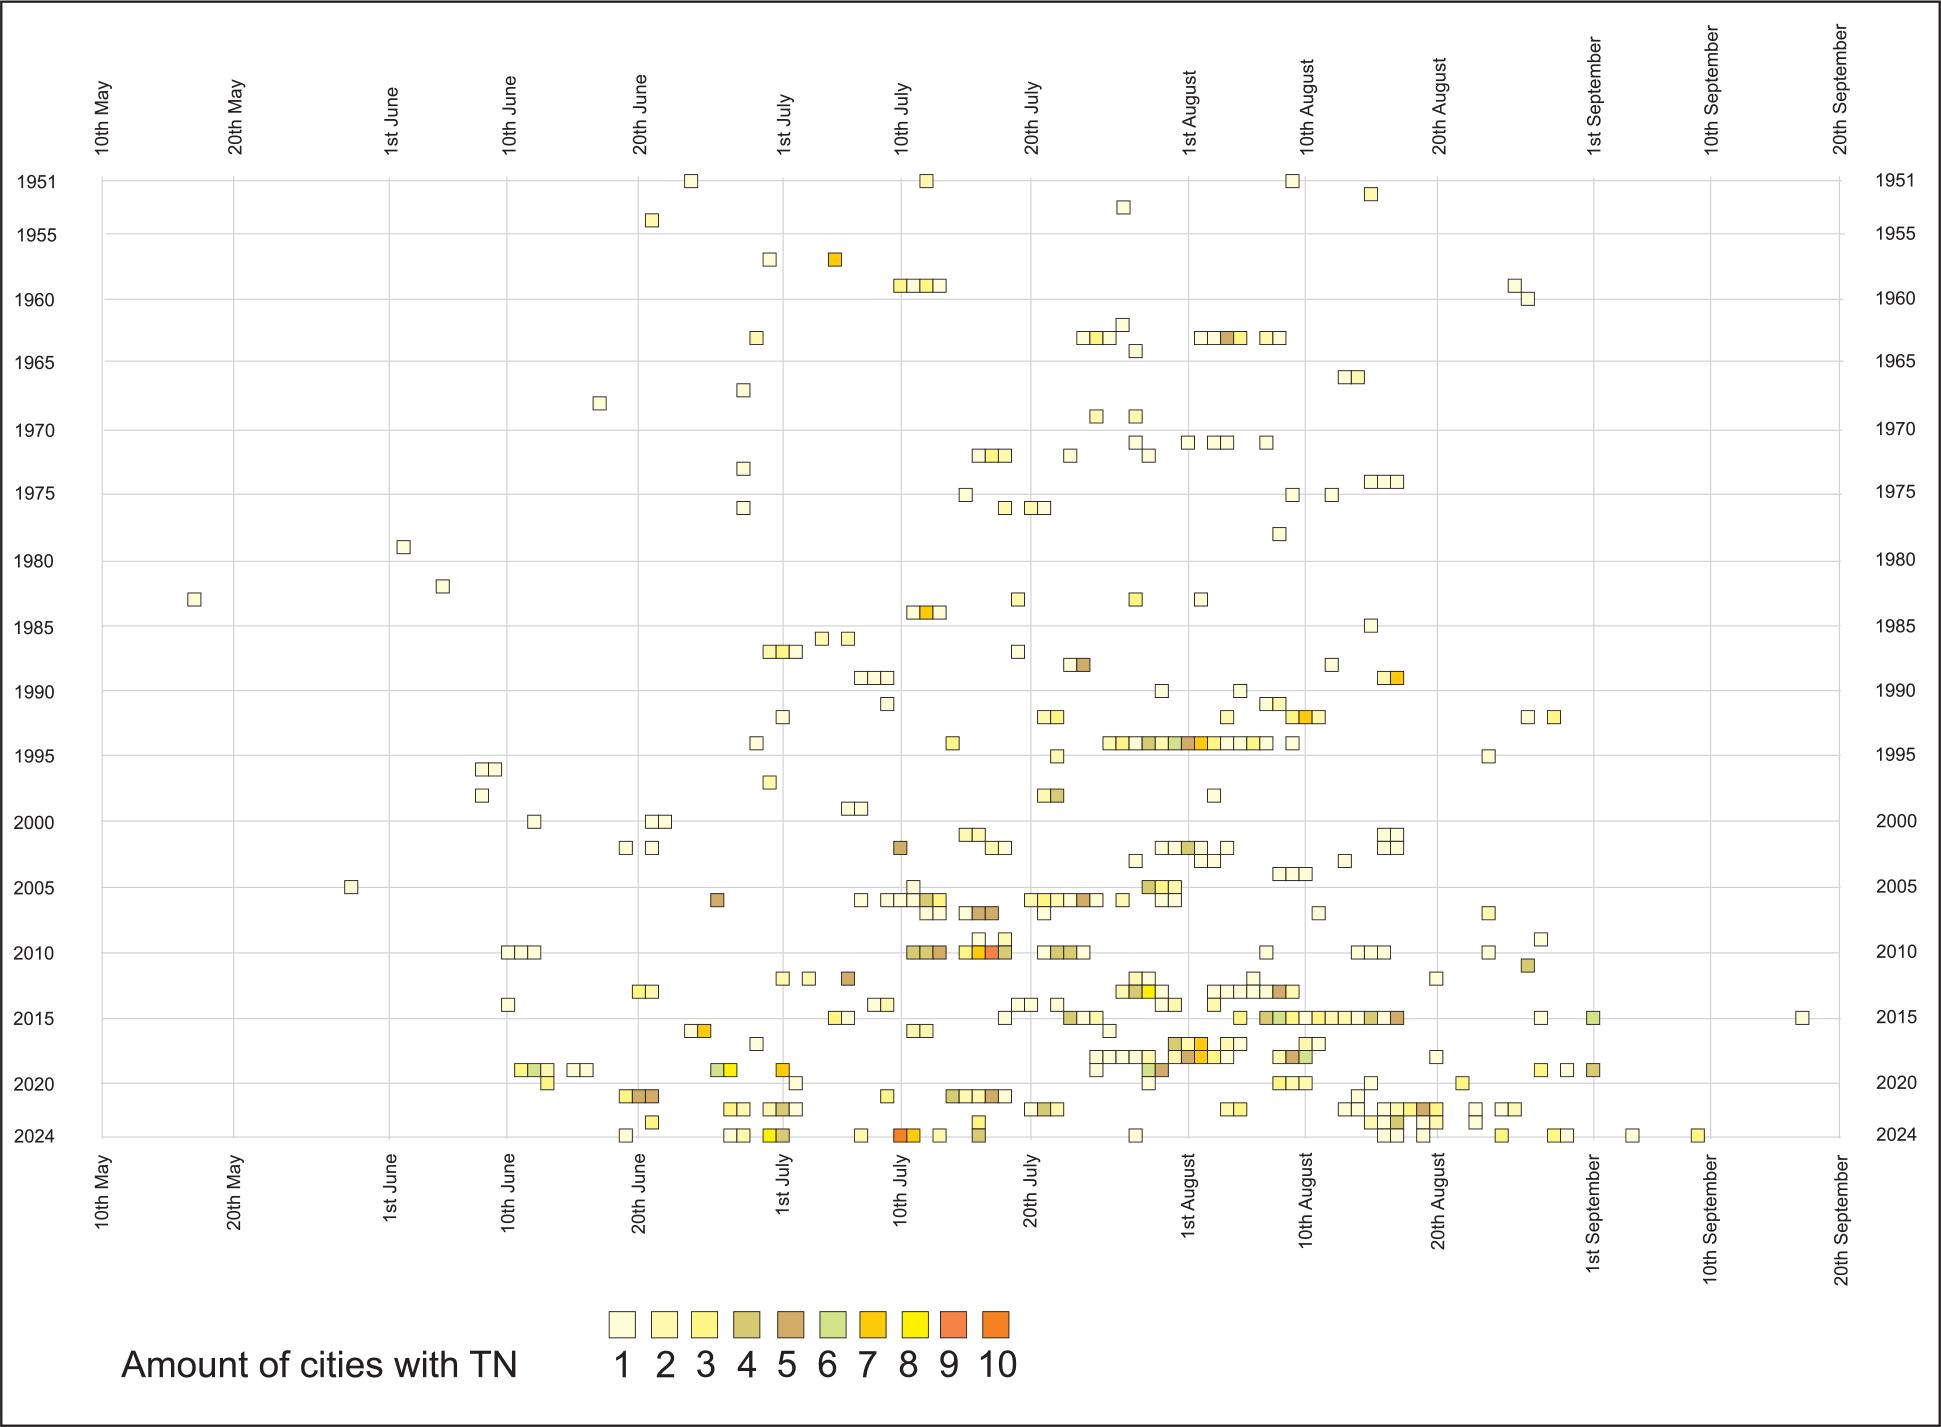
Time range of the occurrence of tropical nights (TNs) in individual years, together with the number of stations at which tropical nights occurred simultaneously.
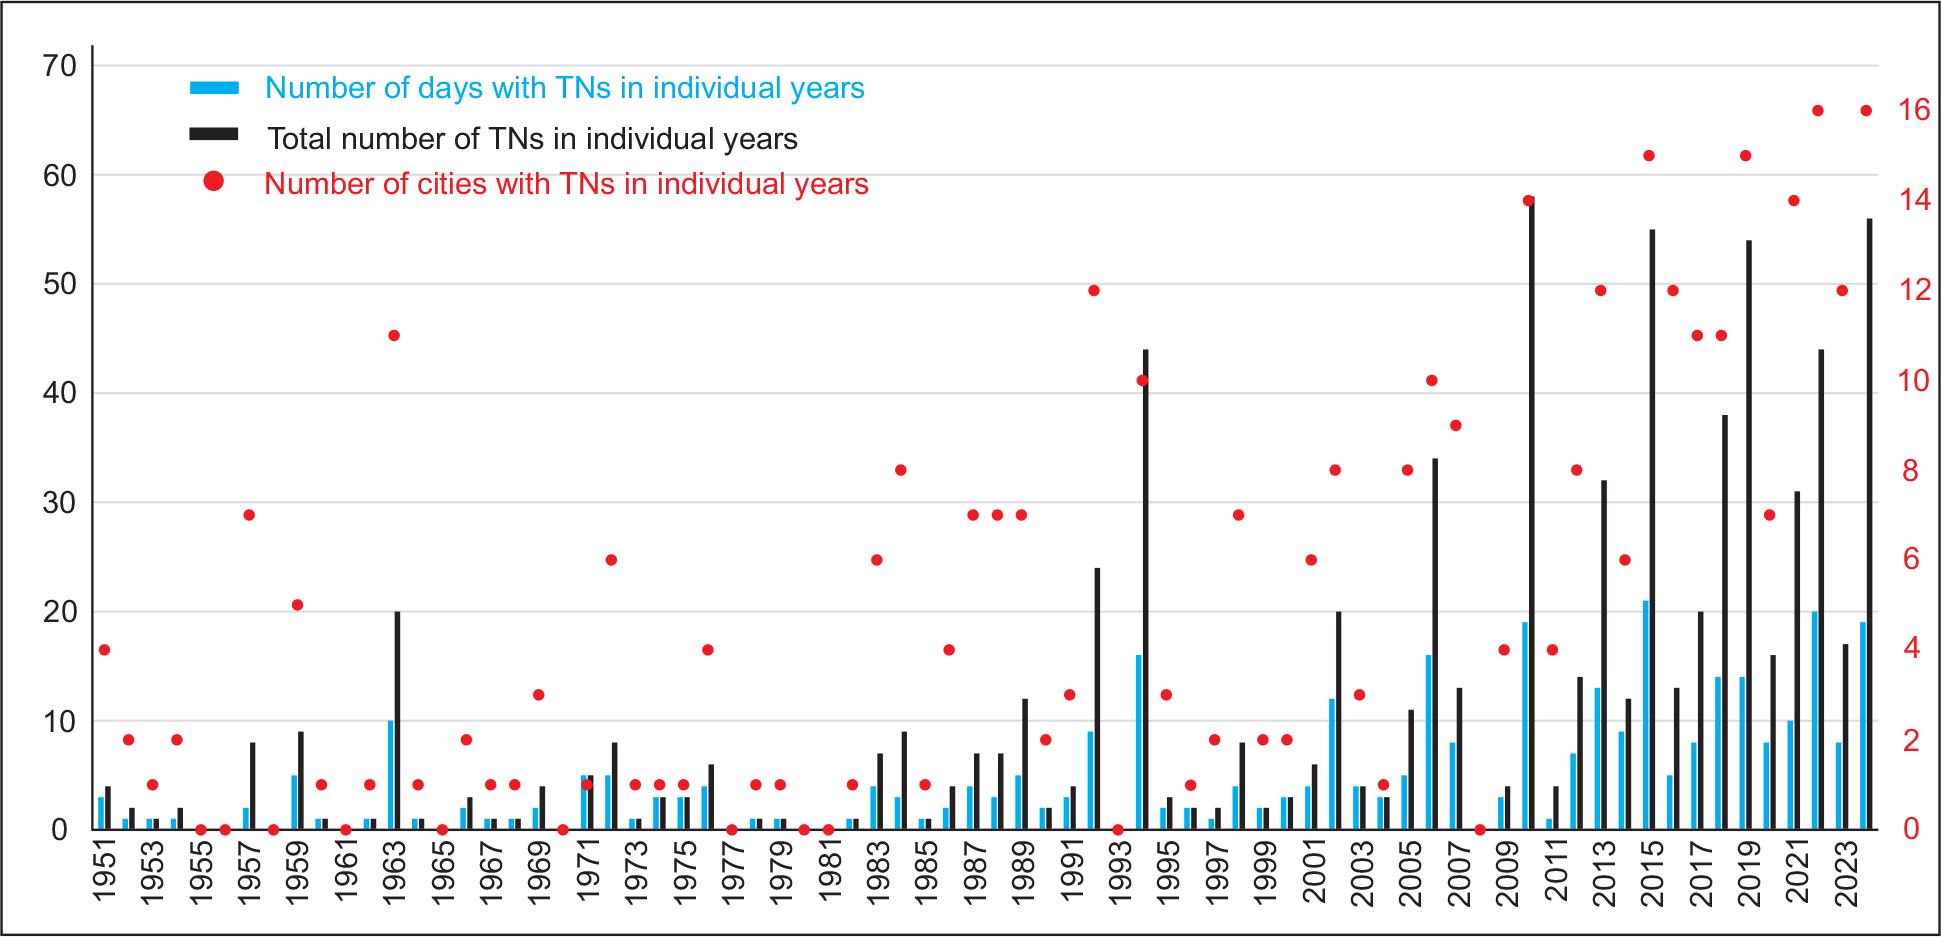
Number of days, total number of tropical nights (TNs), and number of cities where tropical nights (TNs) occurred in individual years.
Tropical nights divided by month at individual synoptic stations.
| Station | Month | |||||
|---|---|---|---|---|---|---|
| May | June | July | August | September | Sum | |
| Szczecin | 0 | 5 | 24 | 16 | 2 | 47 |
| Gorzów Wielkopolski | 0 | 10 | 34 | 25 | 2 | 71 |
| Zielona Góra | 1 | 26 | 73 | 59 | 2 | 161 |
| Poznań | 0 | 13 | 34 | 24 | 2 | 73 |
| Wrocław | 0 | 6 | 13 | 15 | 1 | 35 |
| Opole | 0 | 4 | 23 | 16 | 2 | 45 |
| Gdańsk | 0 | 1 | 38 | 36 | 0 | 75 |
| Toruń | 0 | 14 | 23 | 20 | 2 | 59 |
| Katowice | 0 | 4 | 10 | 5 | 0 | 19 |
| Łódź | 0 | 4 | 20 | 12 | 0 | 36 |
| Kraków | 0 | 2 | 7 | 4 | 0 | 13 |
| Olsztyn | 1 | 5 | 13 | 6 | 1 | 26 |
| Kielce | 0 | 3 | 3 | 3 | 0 | 9 |
| Warszawa | 0 | 10 | 31 | 21 | 0 | 62 |
| Rzeszów | 0 | 3 | 21 | 8 | 1 | 33 |
| Lublin | 0 | 2 | 7 | 6 | 0 | 15 |
| Białystok | 0 | 1 | 6 | 1 | 0 | 8 |
| Sum | 2 | 113 | 380 | 277 | 15 | 787 |
| Percentage | 0.25 | 14.36 | 48.28 | 35.20 | 1.91 | 100.00 |
Tropical nights (TNs) divided by month in individual decades (1951–2020) and years 2021–2024.
| Decade | Month | |||||
|---|---|---|---|---|---|---|
| May | June | July | August | September | Sum | |
| 1951–1960 | 0 | 4 | 18 | 5 | 0 | 27 |
| 1961–1970 | 0 | 4 | 11 | 16 | 0 | 31 |
| 1971–1980 | 0 | 3 | 15 | 10 | 0 | 28 |
| 1981–1990 | 1 | 3 | 33 | 13 | 0 | 50 |
| 1991–2000 | 0 | 9 | 38 | 45 | 0 | 92 |
| 2001–2010 | 1 | 10 | 117 | 25 | 0 | 153 |
| 2011–2020 | 0 | 45 | 86 | 116 | 11 | 258 |
| 2021–2024 | 0 | 35 | 62 | 47 | 4 | 148 |
| Sum | 2 | 113 | 380 | 277 | 15 | 787 |
| Percentage | 0.25 | 14.36 | 48.28 | 35.20 | 1.91 | 100 |
Duration of tropical nights in stations which are arranged in the west-east direction.
| Station | Duration | ||||||||||
|---|---|---|---|---|---|---|---|---|---|---|---|
| 1 day | 2 days | 3 days | 4 days | 5 days | 6 days | 7 days | 8 days | 9 days | Number of periods | Total days | |
| Szczecin | 44 | 1 | 45 | 47 | |||||||
| Gorzów Wielkopolski | 45 | 10 | 2 | 57 | 71 | ||||||
| Zielona Góra | 77 | 20 | 7 | 1 | 2 | 1 | 108 | 161 | |||
| Poznań | 50 | 10 | 1 | 61 | 73 | ||||||
| Wrocław | 33 | 1 | 34 | 35 | |||||||
| Opole | 37 | 4 | 41 | 45 | |||||||
| Gdańsk | 30 | 10 | 3 | 1 | 1 | 1 | 46 | 75 | |||
| Toruń | 41 | 6 | 2 | 49 | 59 | ||||||
| Katowice | 19 | 19 | 19 | ||||||||
| Łódź | 30 | 3 | 33 | 36 | |||||||
| Kraków | 11 | 1 | 12 | 13 | |||||||
| Olsztyn | 20 | 3 | 23 | 26 | |||||||
| kielce | 9 | 9 | 9 | ||||||||
| Warszawa | 41 | 6 | 3 | 50 | 62 | ||||||
| Rzeszów | 27 | 3 | 30 | 33 | |||||||
| Lublin | 15 | 15 | 15 | ||||||||
| Białystok | 8 | 8 | 8 | ||||||||
| Sum | 537 | 77 | 19 | 2 | 3 | 0 | 1 | 0 | 1 | 640 | 787 |
Twelve of the seventeen stations included in the analysis are located on or adjacent to airports and are therefore far from city centres (Fig. 7). The remaining five stations are also located on the outskirts of cities and in the case of Kielce even outside the city. Thus, taking into account that each of the 17 stations is located away from the strict centre of the city, we can speak of a limited influence of the urban heat island, and above all, comparable conditions for all analysed stations.
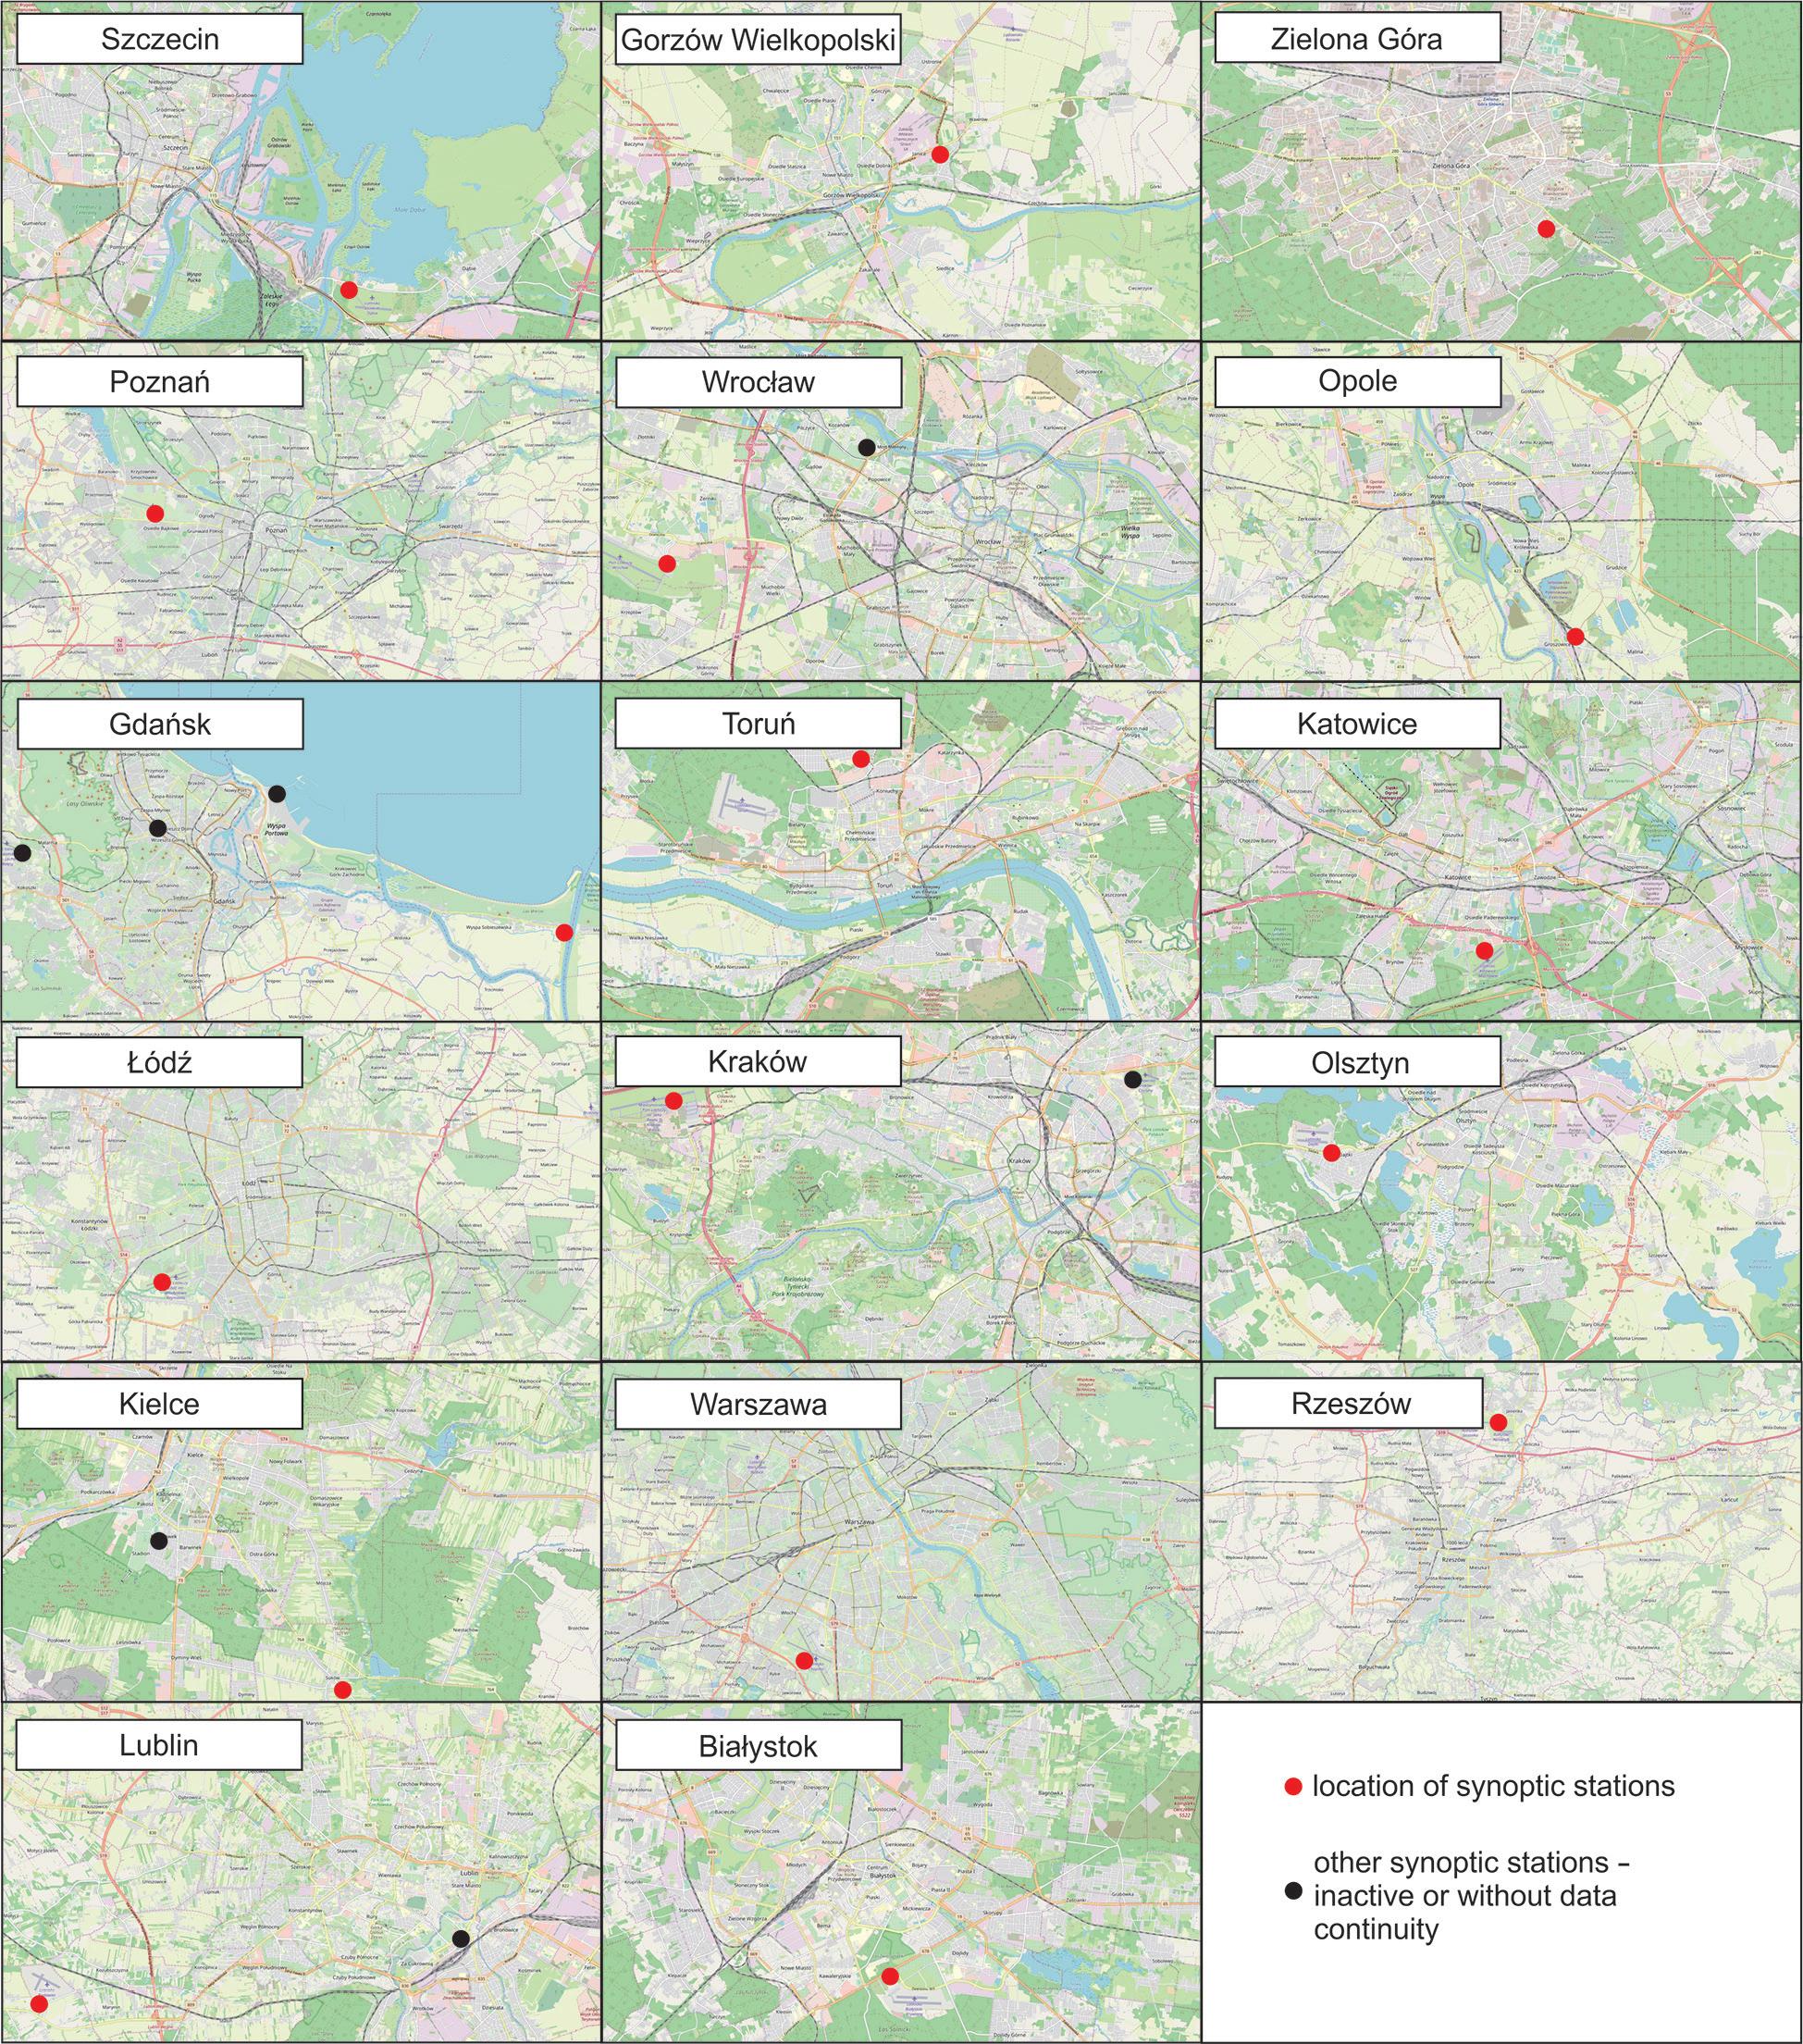
Location of synoptic stations relative to city centres. The figure was made based on maps from website: klimat.imgw.pl/pl/meta-dane/.
Analysing the period 1951–2024 under study, one can clearly see the trend of the occurrence of an increasing number of TNs in Poland’s cities. While in 1951–1980, the total sum of TN cases in all the 17 cities analysed oscillated around 30 in one decade, the following years saw a sharp increase. In 1981–1990, there were already 50 TNs at 17 stations, in 1991–2000, there were 92 cases, in the first decade of the 21st century, there were 153, in the second decade, there were 258, and in the current decade, there are already 148, despite the fact that only 4 years have passed. At this rate of increase, it can be expected that the sum of TNs in the decade 2021–2030 will significantly exceed the result from 2011 to 2020. The increase in the incidence of TN since the mid-1980s (Figs 3 and 6) is similar to the strong upward trend in air temperature for all seasons, both in Poland (Twardosz et al. 2021, Ustrnul et al. 2021, Twardosz 2023) and across Europe (Luterbacher et al. 2016). Long-term climate models predict that TNs will occur in virtually every year across the country in the coming decades, especially by the end of the 21st century (Jędruszkiewicz, Wibig 2019). Analysing individual years, the highest sum of TNs was recorded in Poland in 2010, and there were 58. This also coincides with observations made in Poland at local scales, such as in the Lublin region (Bartoszek et al. 2014). Also in 2015, when there was a strong heat wave (Sulikowska et al. 2016), as well as 2019, when the warmest summer in the history of measurements in Poland was recorded, and 2024, which will probably be the warmest year in the history of measurements worldwide, there were >50, 55, 54 and 56, respectively. While in the study conducted by Graczyk et al. (2017) for 56 stations in Poland for the period 1951–2013, in none of them, the increase in the number of TNs per 10 years exceeded the value of 0.4, and between 1951 and 2024, this threshold was exceeded in up to 5 of the 17 stations, which shows that the problem of increasing heat stress is increasingly covering the entire Polish area.
Analysing the sum of TNs over the entire 1951–2024 period in individual cities, it is clear that the least TNs occurred in locations in the east and southeast of Poland, which is related to the influence of tropical air masses, which decreases as one moves eastward, and is also limited by the orographic barrier of mountain ranges to the south (Więcław 2015). However, this does not change the fact that these parts of the country also show a marked increase in TNs. In Białystok, seven out of eight TNs were recorded in the 21st century, similarly in Kielce (eight out of nine TNs), where the first TN took place in 1952 and another only in 2012. The increasing sum of TNs is also evident in the form of increasing their spatial extent across Poland. In the past two decades, it has become the norm for TN to occur in >10 of the surveyed stations in a given year, and in 2022 and 2024, this coverage extended to up to 16 of the 17 cities analysed (Fig. 6). This is a result of the progressive warming of the climate, and thus, the shifting ranges of climate zones, which is becoming apparent throughout Europe (Hanf et al. 2012).
The period during which TNs can be observed is also lengthening (Fig. 4). In 2019 and 2024, up to 83 days elapsed from the occurrence of the first to the last TN. It was in the second decade of the 21st century that the first TN was recorded in September and up to 11 at once. In the 20th century, TNs occurred mainly in July and August, while the 21st century saw a sharp increase in the sum of TNs in June. In the second decade, there were 45, and in years 2021–2024, there are already 35 (Table 3). In the analysed period of 74 years, there were 11 years without TN, and the last time such a situation occurred was in 2008, and it was the only such year in the 21st century. This clearly shows the intensity of the increase in air temperature (Twardosz et al. 2021), also in the summer season (Ballester et al. 2010), and the process of global warming. Similar conclusions were also reached by Klok et al. (2023) who studied the occurrence of TNs in Ukraine, where a clear increase in the amount of TNs has been recorded since the 1990s in the eastern and central parts of the country, as well as in the west of Ukraine in the last two decades. According to forecasts, progressive warming at the end of the 21st century may lead to the regular occurrence of TNs even at altitudes above 1500 m (Zubler et al. 2014). TNs are already being recorded in the Pyrenees (Cuadrat et al. 2024) or around Lake Baikal, where previously the phenomenon was practically absent (Potemkina, Potemkin 2024).
An important issue that affects the occurrence of TN is the location of the synoptic stations in relation to their immediate surroundings. The extent to which the recorded minimum temperatures are affected by a specific location within the city is evidenced by the results obtained at the station in Kraków. only 13 TNs between 1951 and 2024 at the synoptic station located at the Balice airport is a much lower result than those obtained during measurements at two stations in the city centre (Piotrowicz 2007). Measurements carried out at the so-called Historical Station showed the occurrence of as many as 83 TNs between 1901 and 2006, of which as many as 72 since 1951. In contrast, at the station in the Botanical Garden, measurements (1958–2006) were carried out at two heights above the ground level. At the standard, for weather stations, at a height of 2 m above the ground level, 15 TNs were observed, while at a height of 12 m above the ground level, there were up to 68 at the time. For comparison, at the Kraków-Balice station in the same period, i.e., until 2006, there were only seven TNs. These results also show how important it is that the minimum temperature at night increases with increasing height above the ground level, which is favoured by dense urban development. Also, the sum of TNs observed in Lublin (station at the Radawiec airport site, west of the city centre) is significantly lower than the sum of TNs in the city centre (Krzyżewska 2015). For example, during the unusually hot summer of 1994, a string of up to seven TNs was recorded in the centre of Lublin in late July and early August, while at the synoptic station analysed by the author, located on the airport grounds, not a single such situation occurred at that time, and the highest minimum temperature recorded during that period was 18.2°C. A similar situation occurred during the heat wave of 2015, when a string of six TNs in a row was recorded in the centre of Lublin on 8–13 August (Krzyżewska et al. 2016), while no TNs occurred at the synoptic station site.
The most outstanding of all the stations included in the analysis is the synoptic station in Zielona Góra because up to 161 cases of TN were recorded there, which is more than one-fifth of all 787 TNs. Many other records observed in the course of the analysis also belong to Zielona Góra, due to the specific orographic conditions of the surroundings. The combination of the high absolute altitude at which the station is located (Table 1) and the denivelation of the immediate area, which reaches 100 m, is conducive to an increase in the recorded minimum temperature (Urban 2020), since the topoclimate of convex relief forms is characterised by smaller nighttime drops in air temperature than in concave forms (Jarzyna 2012). It was here during the 1994 heat wave that the longest 9-day TN range was observed. In addition, 5-day periods were recorded twice and once a 4-day period. Of all the stations included in the analysis, apart from Zielona Góra, only Gdańsk recorded periods longer than 3 days (one instance each of four, five and seven TNs in a row). The persistence of hot weather for several days in a row or the occurrence of TNs in sequences of several days causes even greater annoyance and increases the burden on the human body (Kossowska-Cezak 2010).
The number of TN cases in Poland is far from those in southern areas of the European continent, but the overall upward trend is very similar. The incidence of TNs in southern and south-eastern Europe between 1996 and 2011 increased by a few days per year compared to 1964–1993 (Dong et al. 2017). In Georgia, where at some stations, the sum of TNs per year reaches >80, the increase was as high as six TNs per decade (Elizbarashvili et al. 2017). In the Canary Islands, as recently as the 1980s, an average of about 20 TNs per year at a given station was recorded. Today, the values are around 80 TNs, and in 2023, they even exceeded 100 cases (Correa et al. 2024).
The results of the conducted research for Poland clearly indicate the increasing occurrence of high air temperatures (Tmin ≥ 20°C) during the night, which, from the point of view of human health, is a worrying phenomenon. The main conclusions of the study are as follows:
The number of TNs in cities throughout Poland is systematically increasing. Each successive decade, especially starting in the 1980s, brings an increase in the number of TNs by several tens of percent over the previous decade.
The frequency of TN occurrence in a given location in multi-day sequences is increasing, as is the number of stations at which this phenomenon occurs on the same night.
The period between the first and last TN during the year has been extended. TNs increasingly occur in June, and since 2015, they occur even in September.
The location of the synoptic station also has a significant impact on TN occurrence. Since all the stations included in this analysis are located some distance from the immediate urban centres, we can speak in their case of a limited influence of the urban heat island, which, however, is evident in the amount of TNs in the case of measurements carried out in the city centres.