

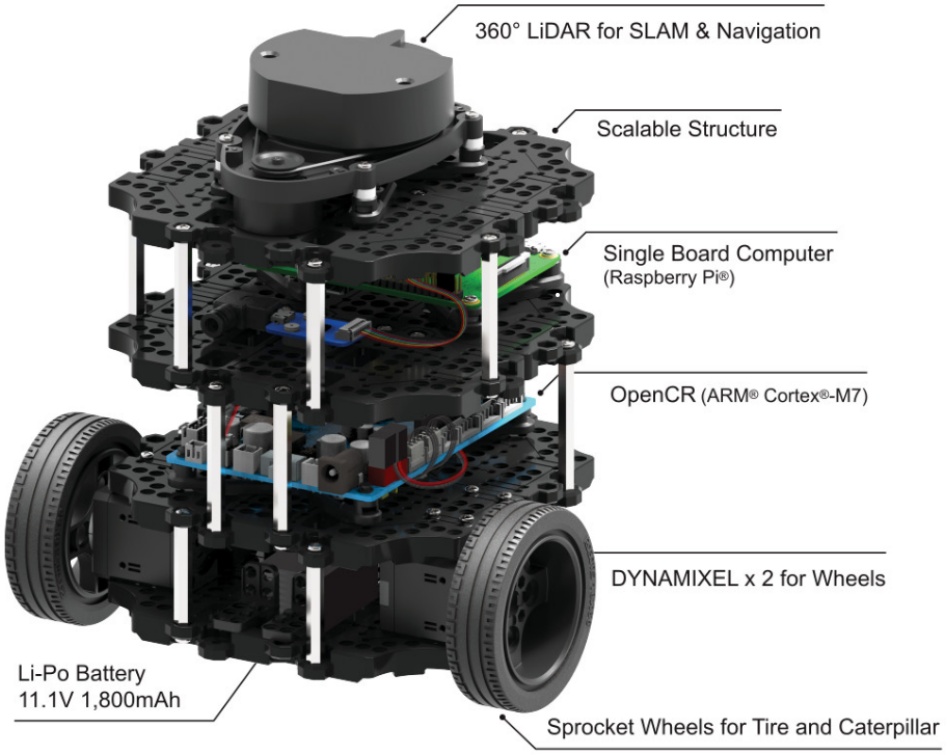
Figure 1.
TurtleBot3 general layout [3]
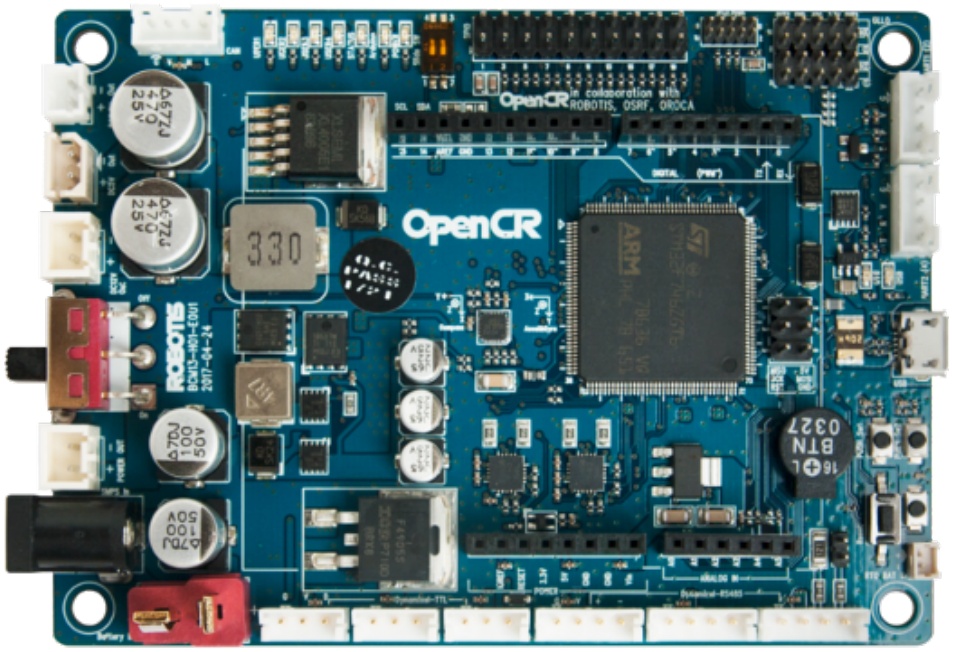
Figure 2.
OpenCR1.0 layout [3]
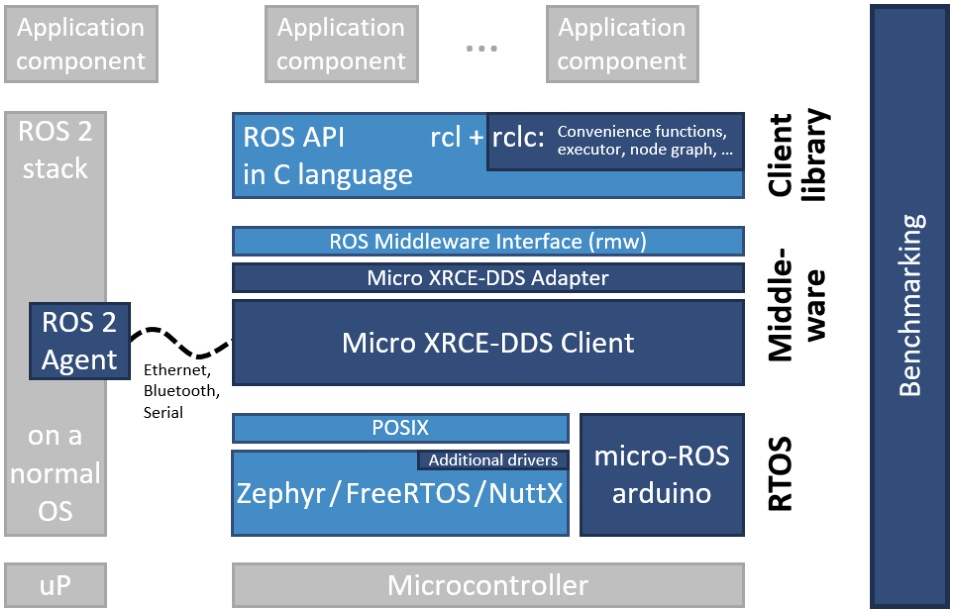
Figure 3.
Architecture of the micro-ROS stack [7]
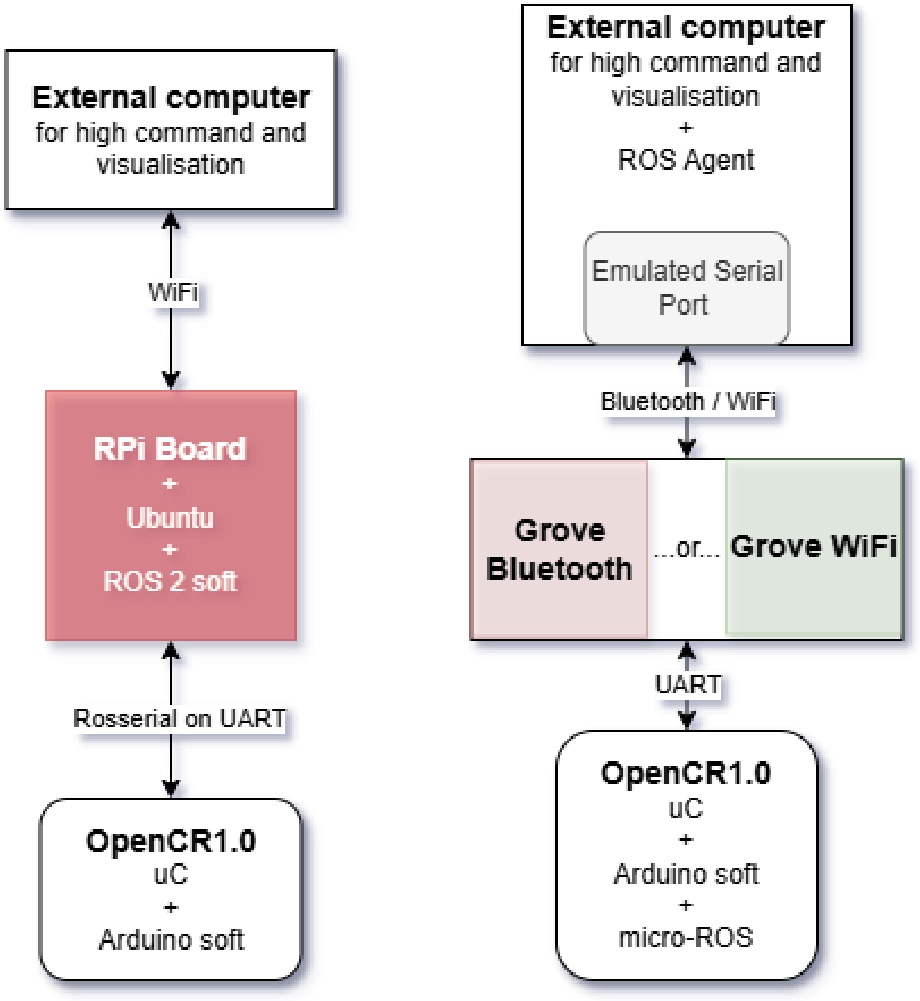
Figure 4.
Original architecture compared to proposed one
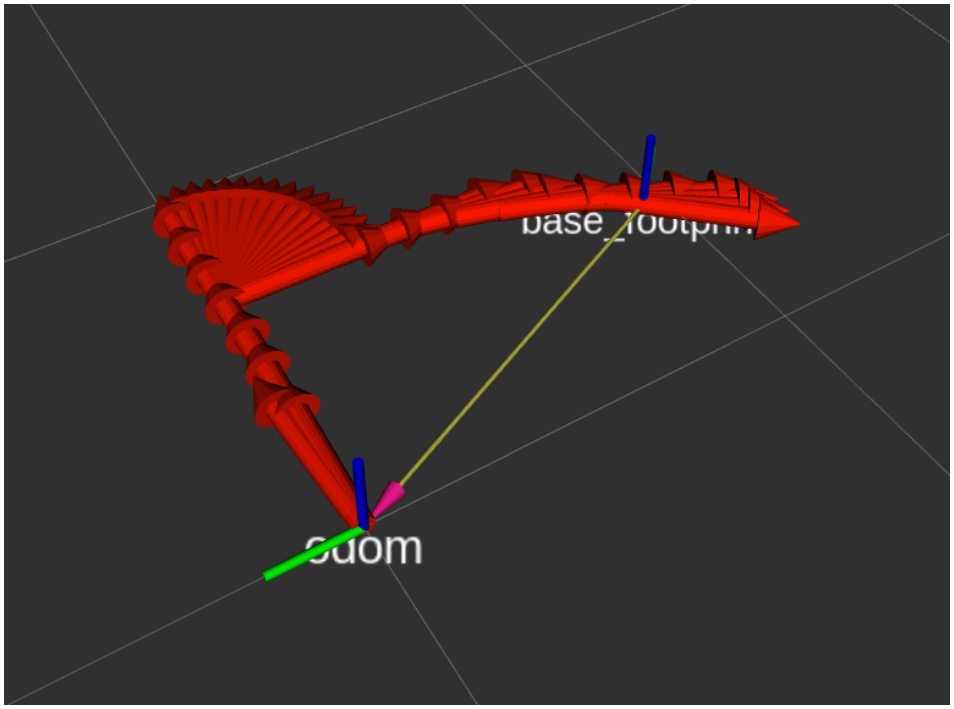
Figure 5.
Visualized odometry of robot moving within 1x1m square
Table 1.
One-way latency statistics for /sensor_state (times in milliseconds)
| Test (ms) | Mean | Min | Max | Std |
|---|---|---|---|---|
| UDP | 16 | 14 | 37 | 1.72 |
| UDP + input | 28 | 14 | 114 | 15.60 |
| UDP (Socat) | 90 | 72 | 284 | 32.53 |
| UDP (Socat) + input | 80 | 76 | 225 | 9.50 |
| Bluetooth | 78 | 32 | 169 | 20.39 |
| Bluetooth + input | 123 | 41 | 256 | 35.14 |