

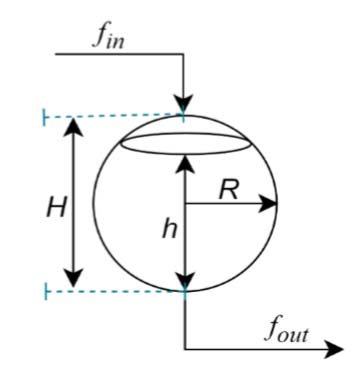
Figure 1.
Schematic of a spherical tank
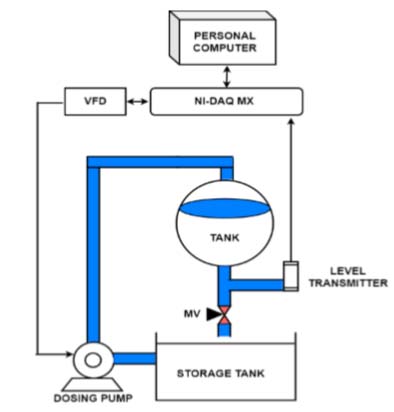
Figure 2.
Block diagram of level setup
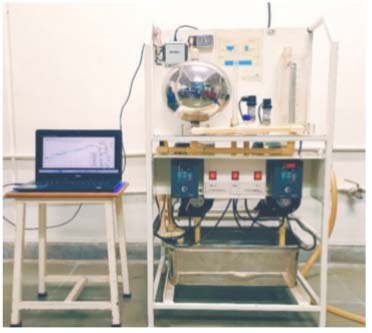
Figure 3.
Schematic of interfacing of NI DQA USB 6001 module with spherical tank system
Table 1.
Technical specification of experimental setup
| Sr.No | Components | Specification |
|---|---|---|
| 1 | Spherical Tank | SS, H-25 cm, D-25cm, R-12.5 cm |
| 2 | DAQ Device | NI USB6001, 14 bit, AI-4, AO-2 |
| 3 | Level Transmitter | Two wires, Range 0-250mm, O/P=4 to 20 mA |
| 4 | Dosing Pump | PDDP with adjustable stroke |
| 5 | VFD | 1-ph 200 VAC, 1.1 A, O/P AC 3-ph, 0-230v |
| 6 | Manual outlet valve | Cd = 19.69 cm2/s |
| 7 | Input flow rate | fin = 0 (Min) and 420 (Max) LPH |
| 8 | Output flow rate | fout = It is kept 150 LPH for study |
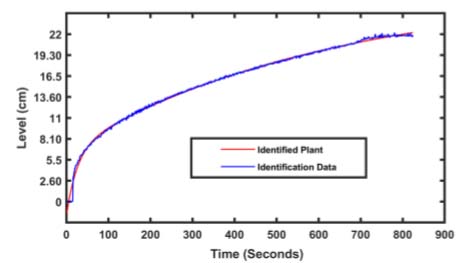
Figure 4.
Open loop response of spherical tank
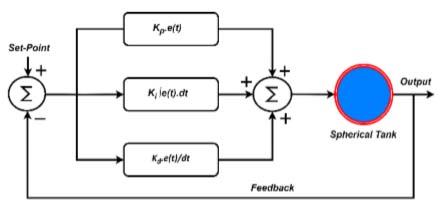
Figure 5.
Structure of PID controller
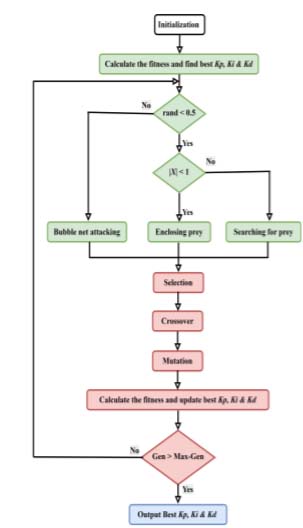
Figure 6.
WOA-GA algorithm process flowchart
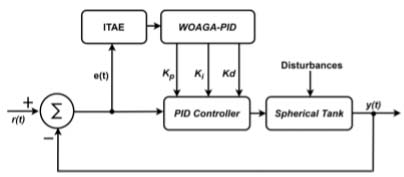
Figure 7.
Block diagram of proposed WOA-GA based PID controller
Table 2.
Optimization Parameters
| Parameter | GA | WOA | WOA-GA |
|---|---|---|---|
| Lower bound [Kp, Ki, Kd] | [1, 0.01, -20] | [1, 0.01, -20] | [1, 0.01, -20] |
| Upper bound [Kp, Ki, Kd] | [5, 3, 5] | [5, 3, 5] | [5, 3, 5] |
| No. of Generations | 20.0 | 20.0 | 20.0 |
| No. of Population | 20.0 | 20.0 | 20.0 |
| Crossover Fraction | 0.8 | – | 0.8 |
| Mutation Fraction | 0.2 | – | 0.2 |
| α decrease | – | 2 to 0 | 2 to 0 |
Table 3.
Controller tuning values
| Sr.No. | Controller Type | Kp | Ki | Kd |
|---|---|---|---|---|
| 1 | GA-PID | 1.15 | 0.03 | -34.34 |
| 2 | WOA-PID | 2.56 | 0.17 | 1.31 |
| 3 | WOA-GA-PID | 1.92 | 0.2 | -7.27 |
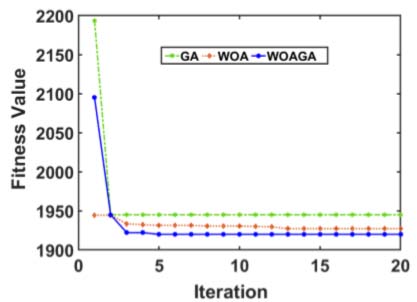
Figure 8.
Convergence curves of GA, WOA and WOAGA with population size 20
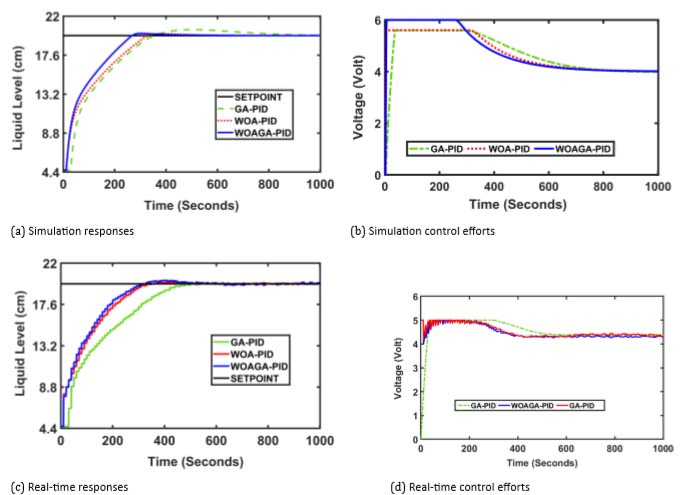
Figure 9.
Simulation and real-time control efforts and responses
Table 4.
Time domain comparison between simulation and real-time implementation
| Set Point | Specification | Simulation | Real-Time | ||||
|---|---|---|---|---|---|---|---|
| GA-PID | WOA-PID | WOAGA-PID | GA-PID | WOA-PID | WOAGA-PID | ||
| 19.30 cm Level | Rise Time | 254 | 237 | 193 | 305 | 275 | 210 |
| Peak Time | 504 | 374 | 302 | 512 | 398 | 347 | |
| Settling Time | 670 | 307 | 251 | 680 | 325 | 274 | |
| Overshoot % | 3.21 | 1.04 | 1.25 | 2.78 | 1.56 | 1.67 | |
Table 5.
Comparison of performance parameters in simulation and real-time implementation
| Set Point | Controller | Simulation | Real-Time | ||||
|---|---|---|---|---|---|---|---|
| ISE | IAE | ITAE | ISE | IAE | ITAE | ||
| 19.30 cm Level | GA-PID | 624 | 462 | 7004 | 648 | 492 | 8422 |
| WOA-PID | 614 | 361 | 3732 | 657 | 412 | 4757 | |
| WOAGA-PID | 518 | 300 | 2604 | 638 | 398 | 3228 | |
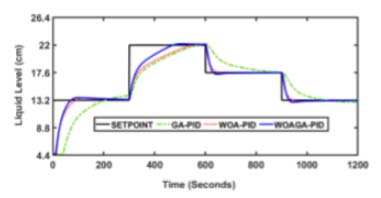
Figure 10.
Setpoint tracking
Table 6.
Comparison of control effort in simulation and real-time
| Norm | Simulation | Real-Time | ||||
|---|---|---|---|---|---|---|
| GA-PID | WOA-PID | WOAGA-PID | GA-PID | WOA-PID | WOAGA-PID | |
| norm 2 | 143.79 | 141.34 | 139.51 | 145.18 | 143.71 | 142 |
| norm ∞ | 6 | 5.6 | 5.6 | 5.7 | 5.7 | 5.2 |
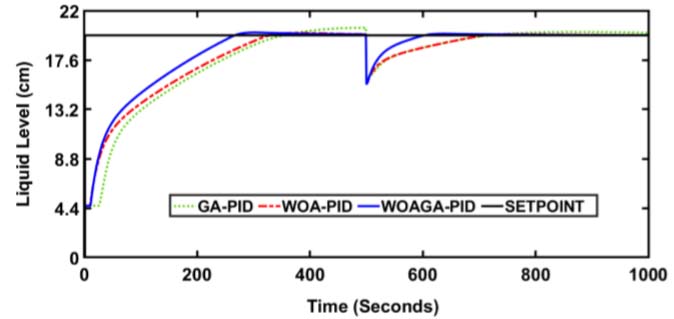
Figure 11.
Disturbnce rejection