

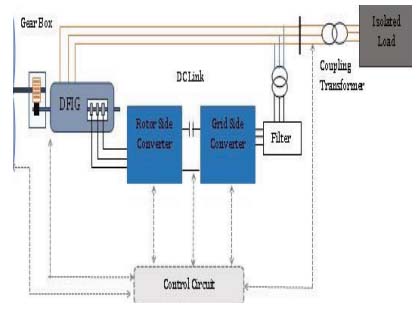
Figure 1.
Schematic diagram of the DFIG-WECS
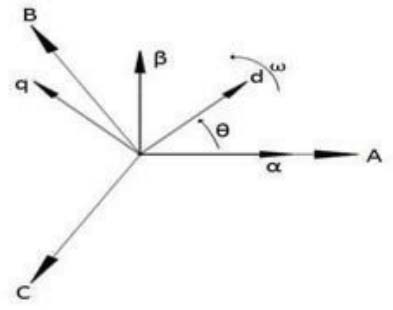
Figure 2.
Three-dimensional positioning of the vectors
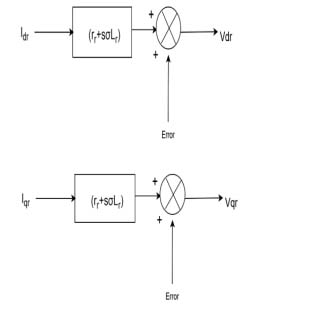
Figure 3.
Depiction of the relationship between voltage and rotor current in d-q frame
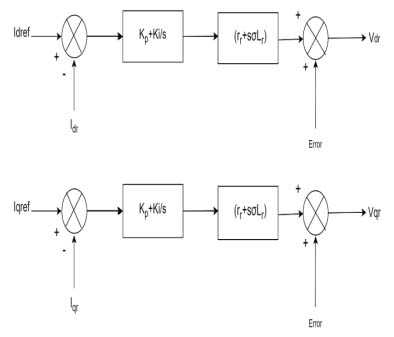
Figure 4.
Modified system after adding PI block in the d-q System
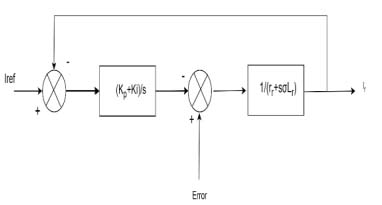
Figure 5.
PI current control system using close loop feedback system
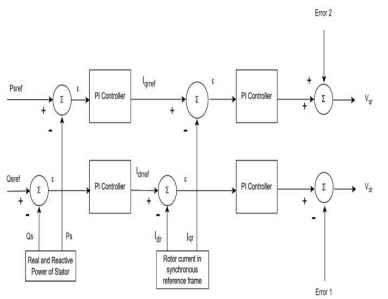
Figure 6.
Block diagram of RSC controller
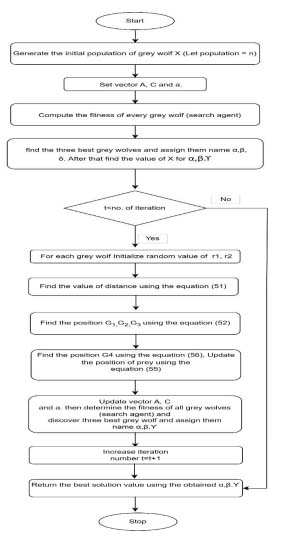
Figure 7.
Flow chart of the MGWOCS method
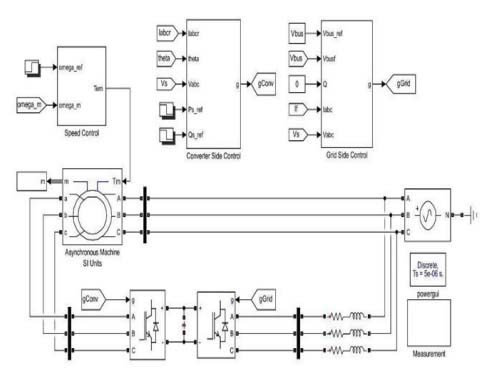
Figure 8.
Simulink model of DFIG
Table 1.
Datasheet of the 2 MW DFIG systems
| Specifications | Values |
|---|---|
| Rotor Equivalent Resistance Rr | 0.00289Ω |
| Stator Equivalent resistance Rs | 0.00259Ω |
| Inductance of Rotor Lr | 0.002586 H |
| Stator load Ls | 0.002587 H |
| Mutual-Inductance M | 0.0025 H |
| Real power proportional gain KP | 2.42 |
| Reactive power proportional gain KQ | 2.34 |
| Rated power P | 2MW |
| Frequency f | 50 Hz. |
| Generator (EM) Torque Tem | 13000 N-M |
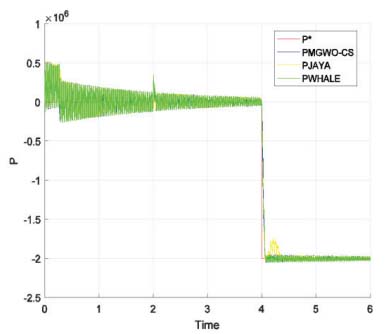
Figure 9.
Variation of the active power
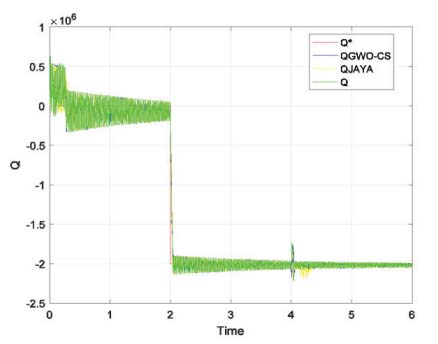
Figure 10.
Reactive power variation with respect to time for DFIG with different optimization method
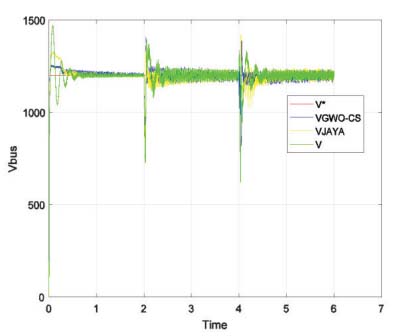
Figure 11.
DC link voltage variation with different optimization method
Table 2.
Comparative results of different methods
| Parameters | Normal PI | PI optimized by WOA [28] | PI optimized by MGWO-CS | PI optimized by Jaya Optimization |
|---|---|---|---|---|
| Rise Time | 0.0885 | 0.0314 | 0.0263 | 0.0287 |
| Settling Time | 0.1363 | 0.0535 | 0.0386 | 0.0412 |
| Overshoot | 1.9099 | 1.12 | 1.08 | 1.10 |
| Undershoot | 0.85 | 0.809 | 0.913 | 0.956 |
| Peak | 1.6171 | 1.415 | 1.378 | 1.504 |
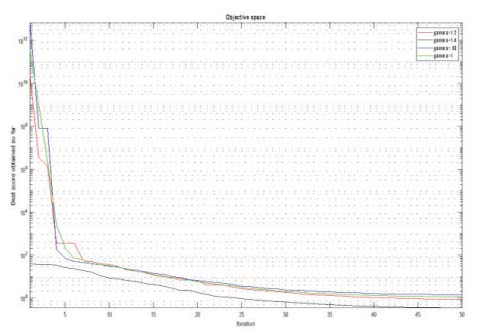
Figure 12.
Effect of γ on convergence plot
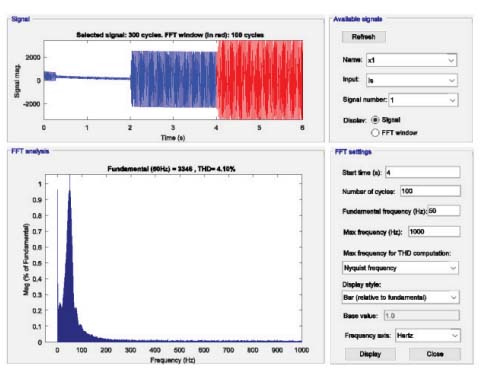
Figure 13.
THD measurement in DFIG optimized by MGWO-CS Optimization
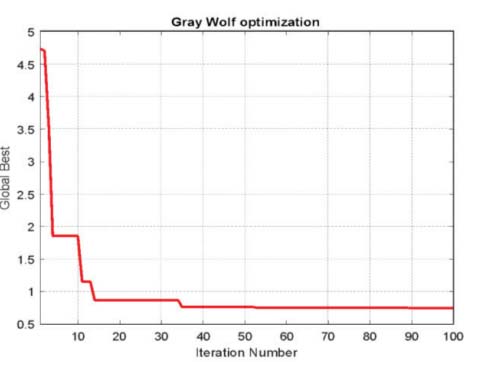
Figure 14.
Graph of Convergence for GWO method
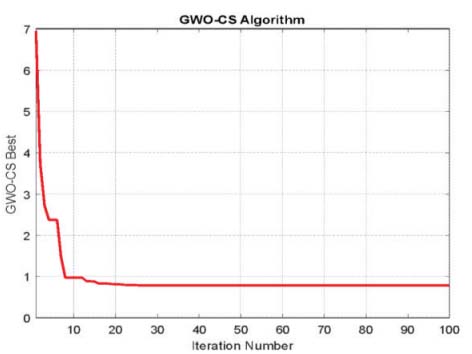
Figure 15.
Graph of Convergence for MGWO-CS method
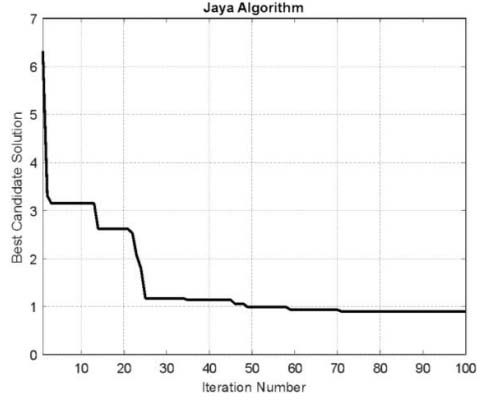
Figure 16.
Graph of Convergence for Jaya Optimization Method