

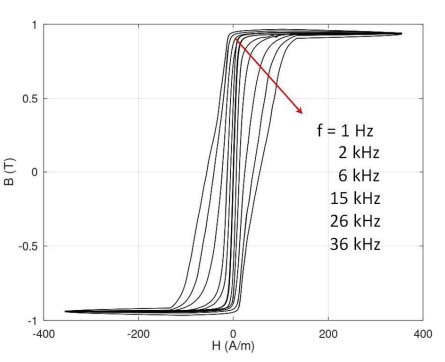
Figure 1.
Results of experimental measurements of the B(H) hysteresis loop as a function of magnetizing field frequency (f) for the Fe73.5Cu1Nb3Si15.5B7 (Vitroperm 500F) nanocrystalline alloy. Consecutive values of frequency follow the direction indicated by the arrow
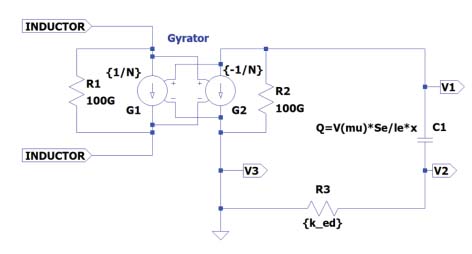
Figure 2.
The gyrator-capacitor circuit for modeling an inductor with the magnetic core exhibits nonlinear magnetization characteristics
Table 1.
The parameters of the anhysteretic magnetization curve of the Fe73.5Cu1Nb3Si15.5B7 nanocrystalline alloy determined during the optimization process
| Parameter | Units | Value |
|---|---|---|
| Ms | A/m | 7.455⋅105 |
| ☐ | - | 8.587⋅10−7 |
| a | A/m | 0.489 |
| Kan | J/m3 | 4.054 |
| ψ | deg | 90 |
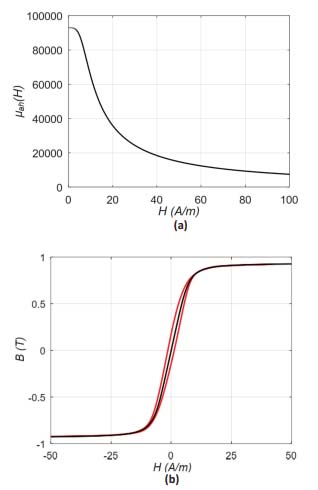
Figure 3.
The results of an anhysteretic curve modeling for the nanocrystalline Fe73.5Cu1Nb3Si15.5B7 alloy: (a) Bah(H) fitting to the quasistatic hysteresis loop B(H) (black – model, red – results of experimental measurements), (b) the results of modeling of its relative permeability dependence μah(H)
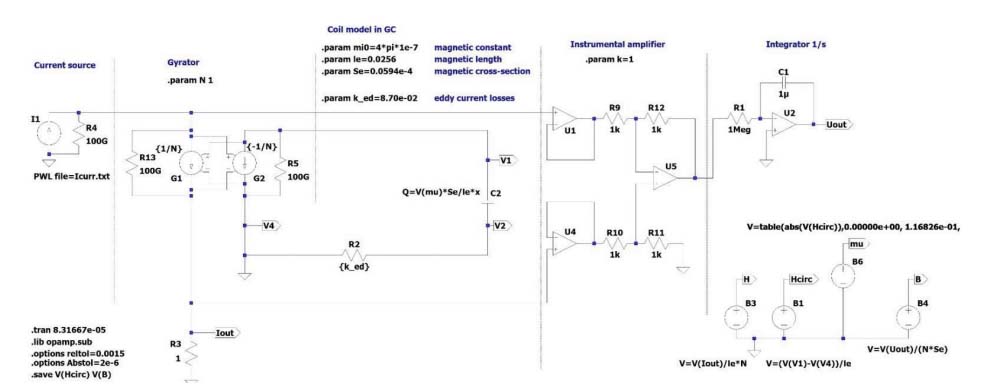
Figure 4.
The complete gyrator-capacitor circuit used for the modeling B(H) hysteresis loop as a function of magnetizing field frequency f for the Fe73.5Cu1Nb3Si15.5B7 (Vitroperm 500F) nanocrystalline alloy
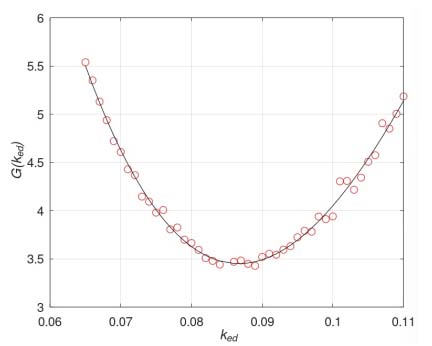
Figure 5.
The results of modeling the target function G dependence on the value of ked for the resistor R2
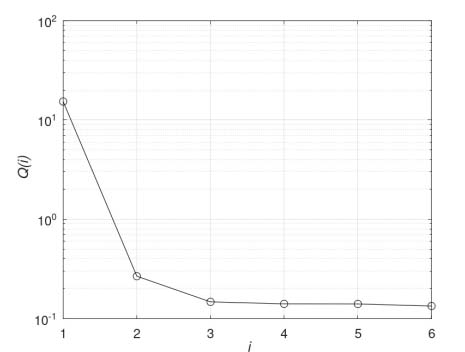
Figure 6.
The dependence of quality Q(i) of regression versus the order of the polynomial used for the approximation
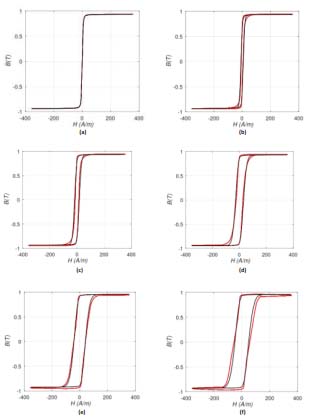
Figure 7.
The comparison of the experimental results and the results of modeling using the gyrator-capacitor model (black – model, red – results of experiments) for the frequency f of the magnetizing field equal: (a) 1 Hz, (b) 2 kHz, (c) 6 kHz, (d) 15 kHz, (e) 26kHz, (f) 36kHz
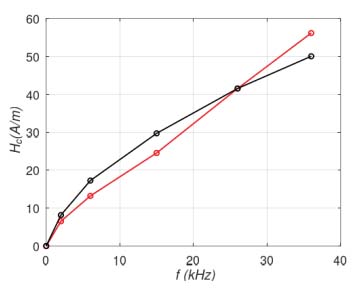
Figure 8.
The frequency f dependence of the coercive field Hc value (black – model, red – results of experimental measurements)