

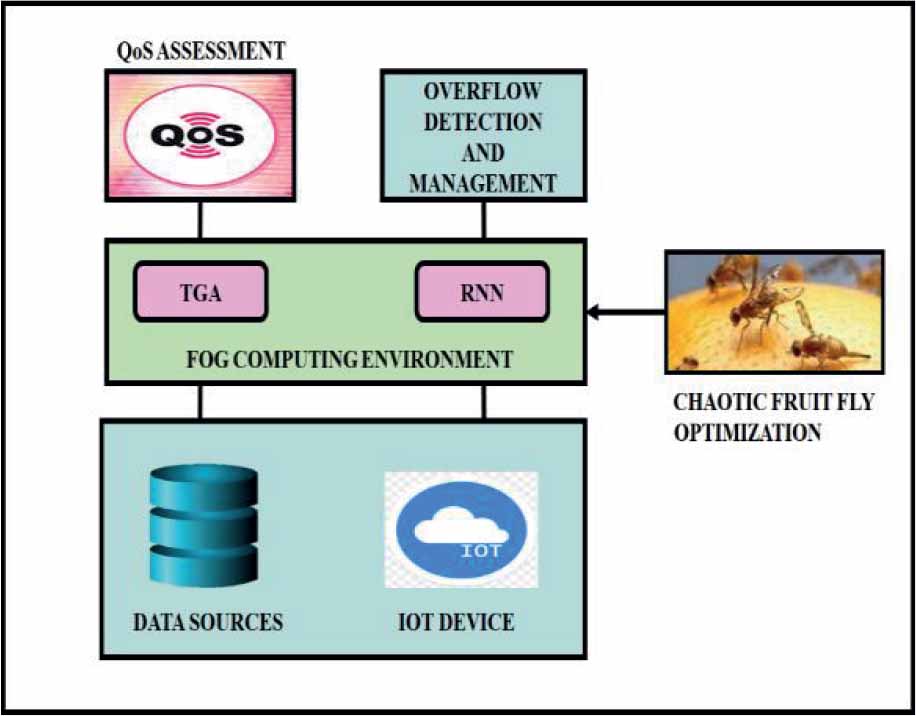
Figure 1.
Block diagram of proposed method
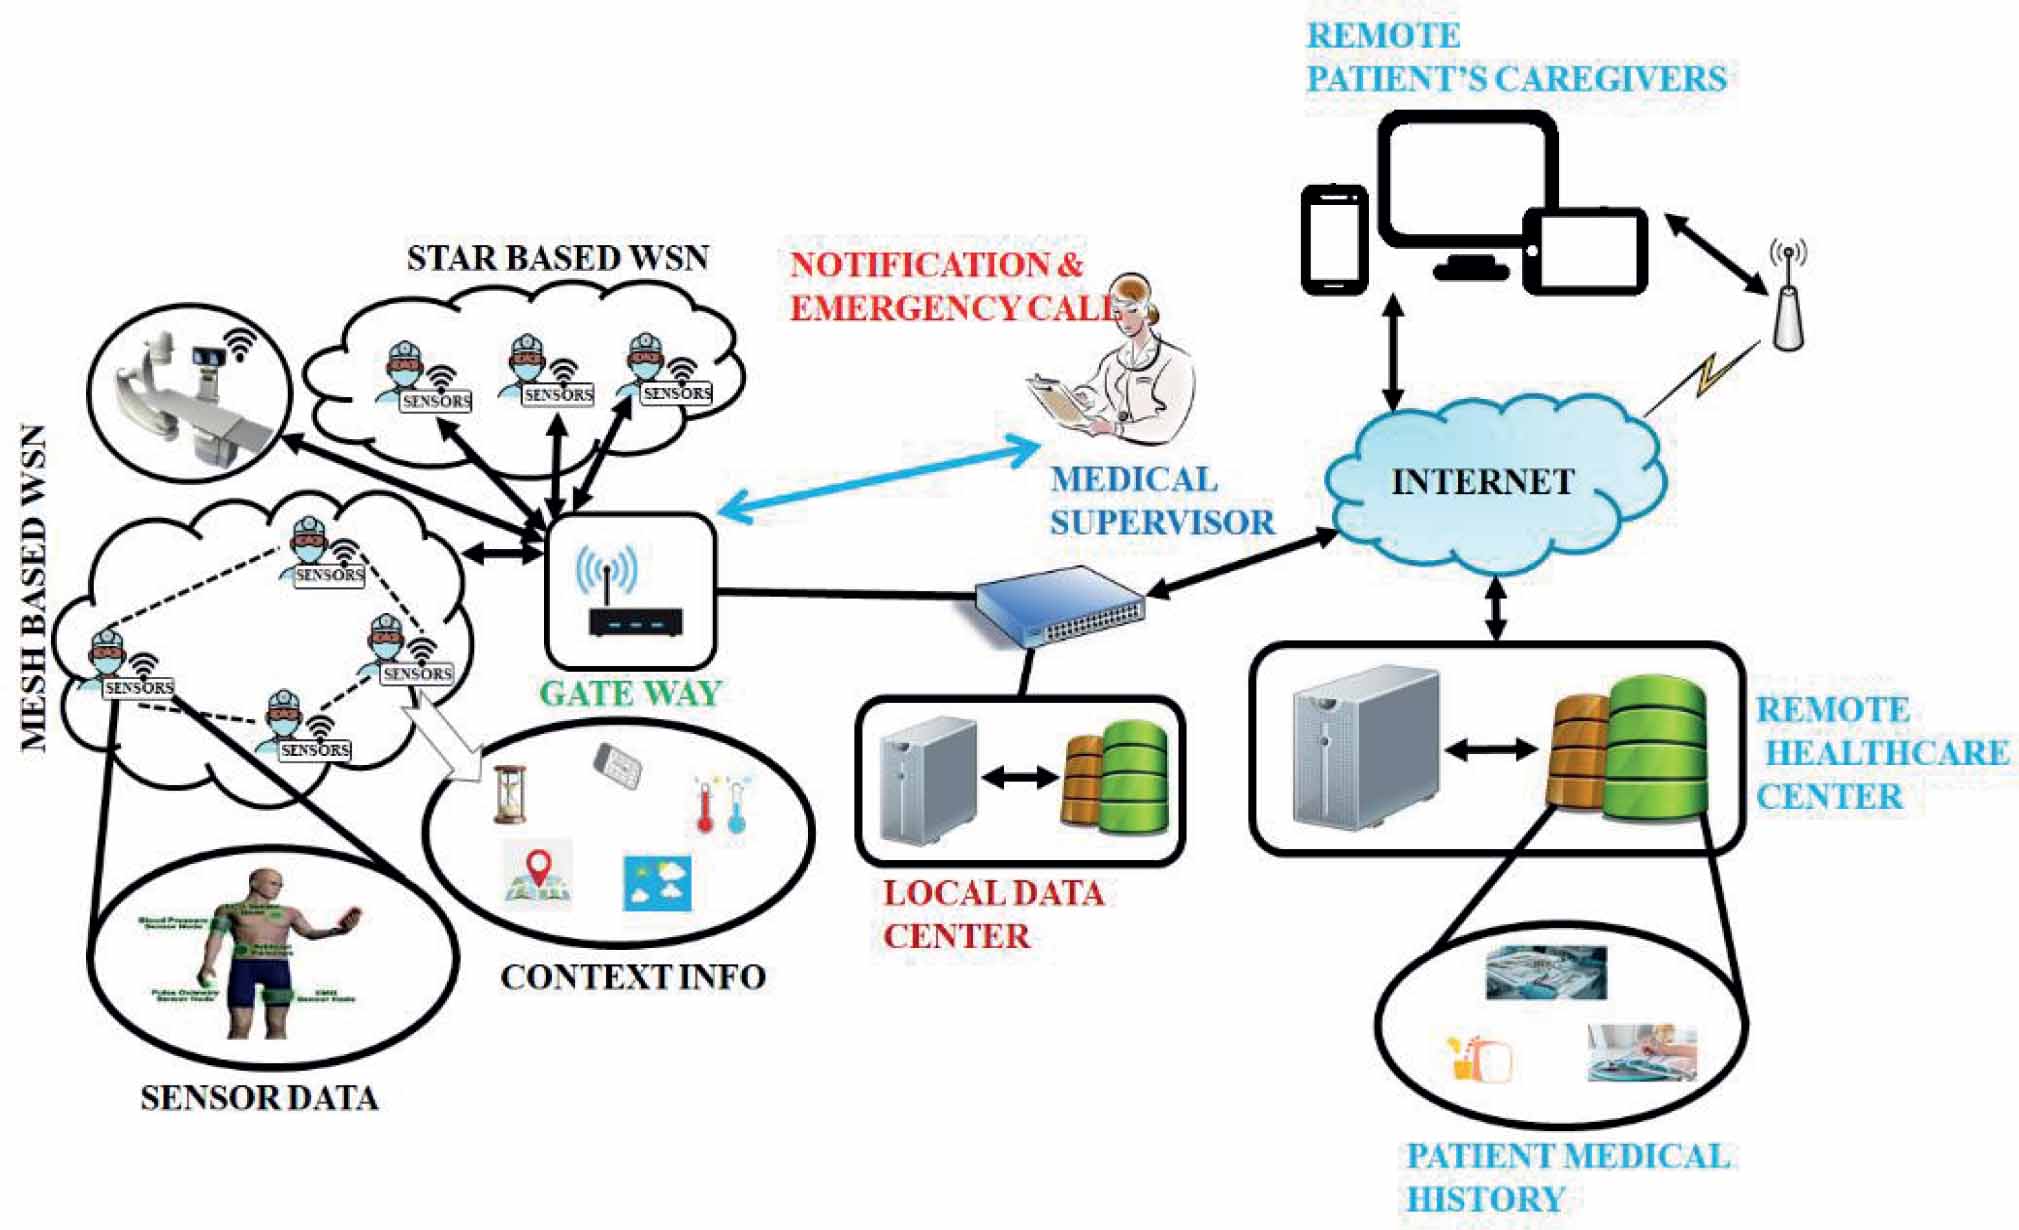
Figure 2.
IoT-based Health Monitoring Architecture
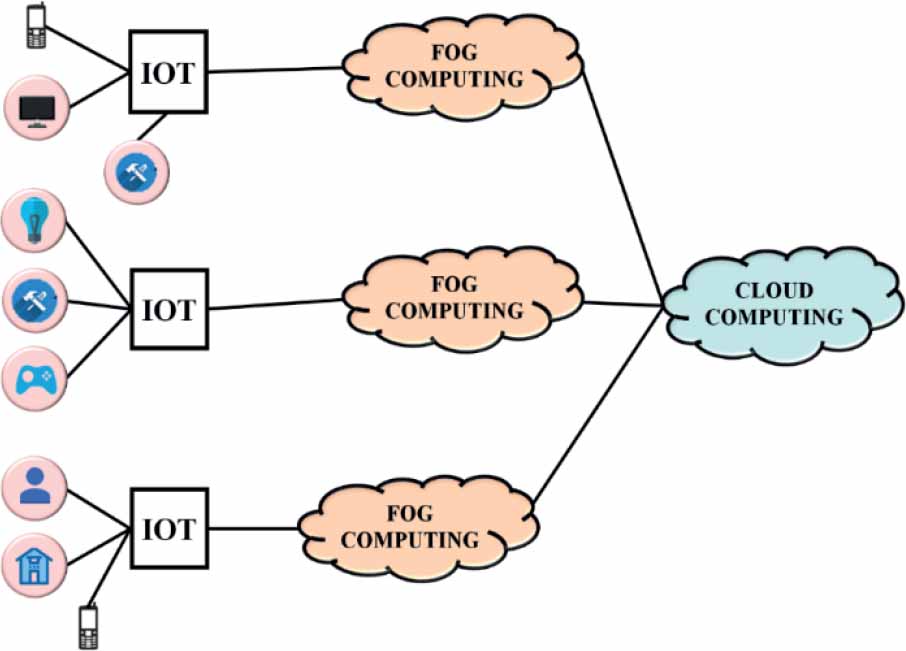
Figure 3.
Fog computing architecture
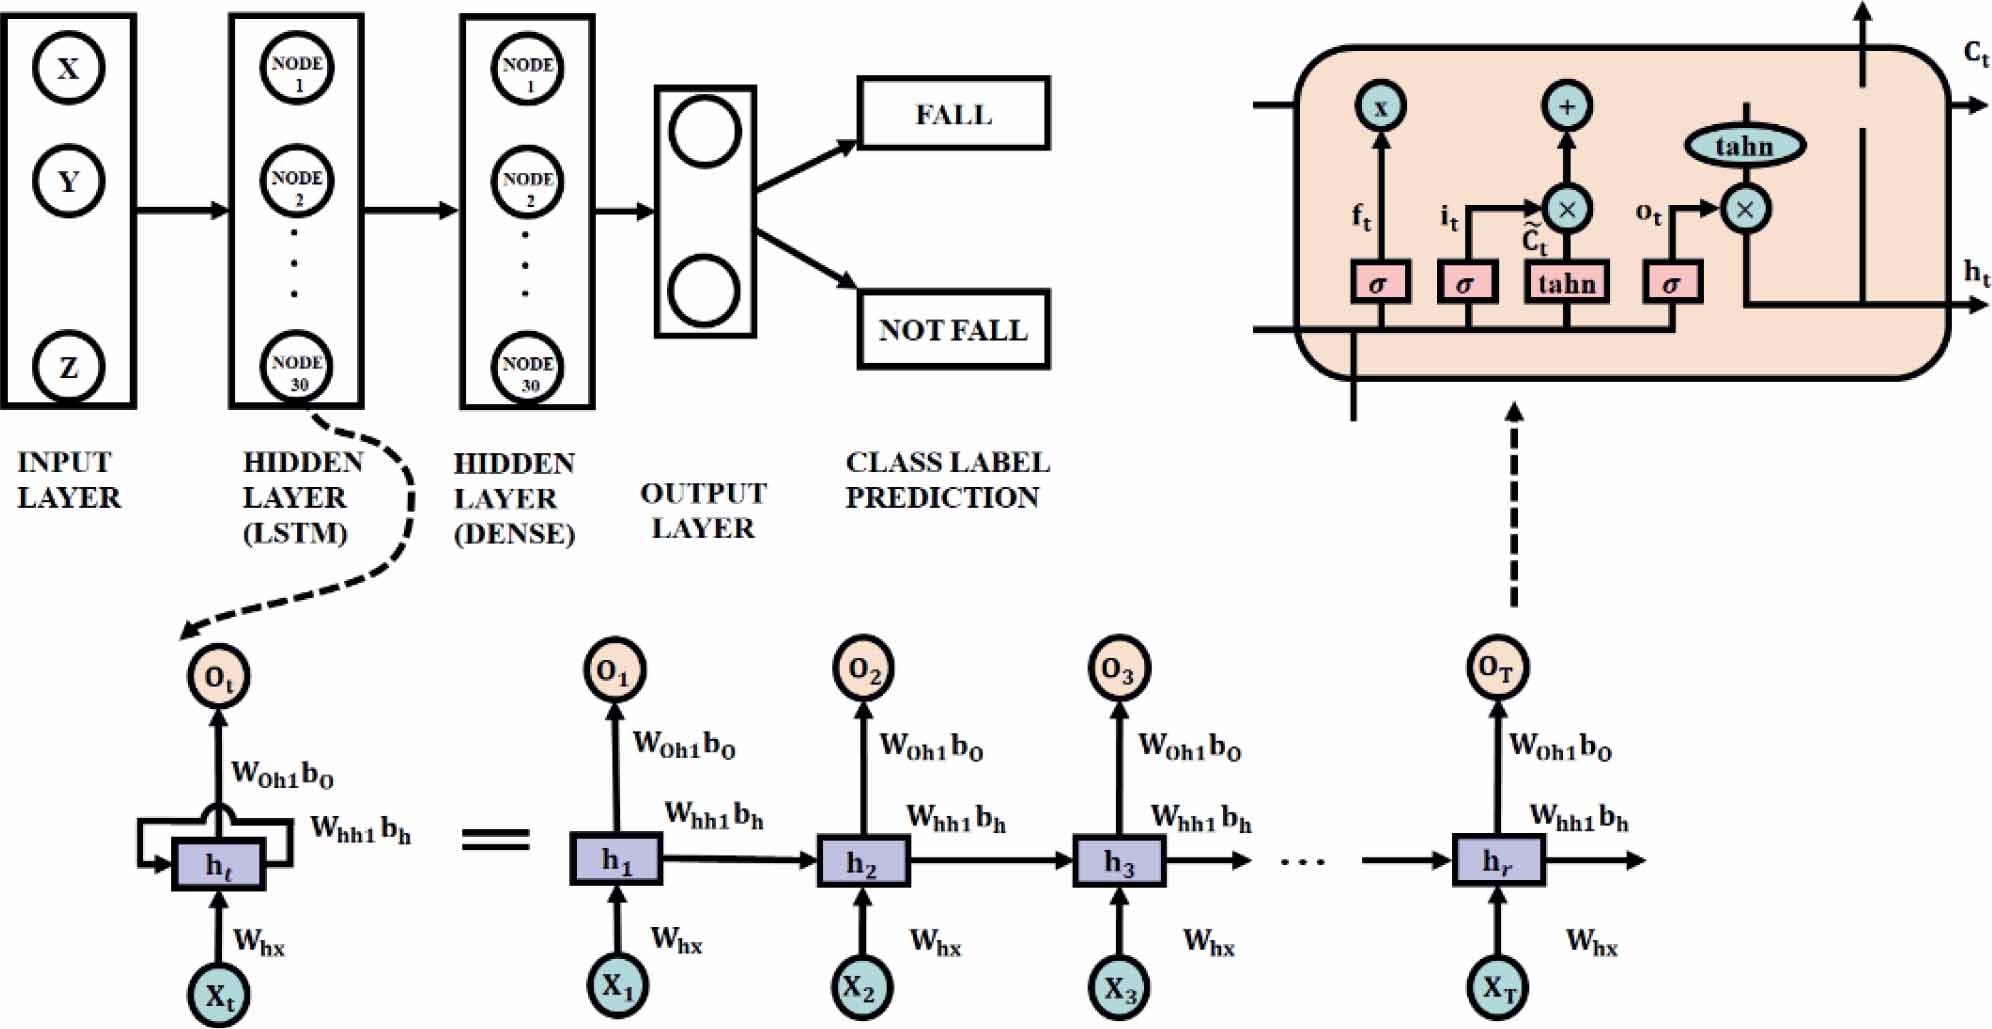
Figure 4.
LSTM model
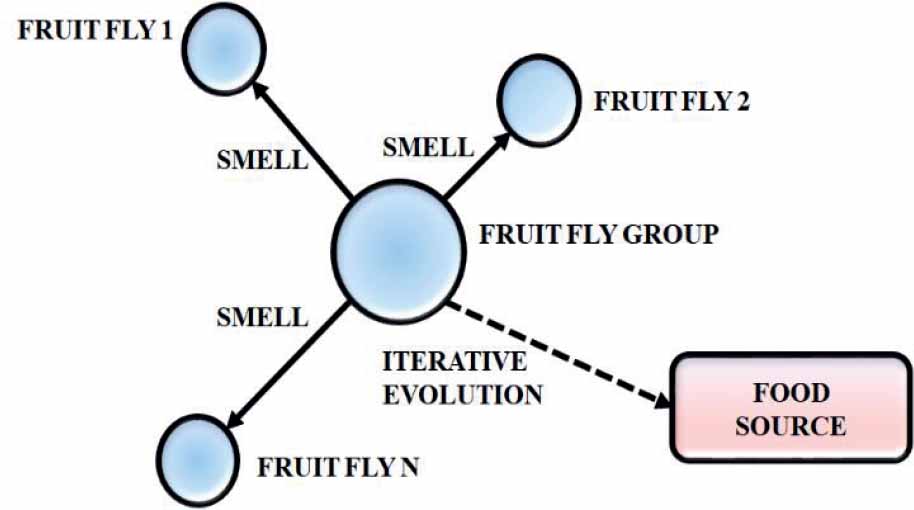
Figure 5.
Iterative foraging process of fruit flies
Table 1.
Simulation parameters
| Simulation parameters | Value |
|---|---|
| Radius of the FN | 100 m |
| Data size fortask | [0.1 – 1] Mbits |
| Computation capacity of the FN | [0.7 – 1] GHZ |
| Computation capacity of the IoT devices | 20 GHZ |
| Local computing energy consumption | [2 – 4] * 10−11 J/Cycle |
| FN computing energy consumption | 1 * 10−11 J/Cycle |
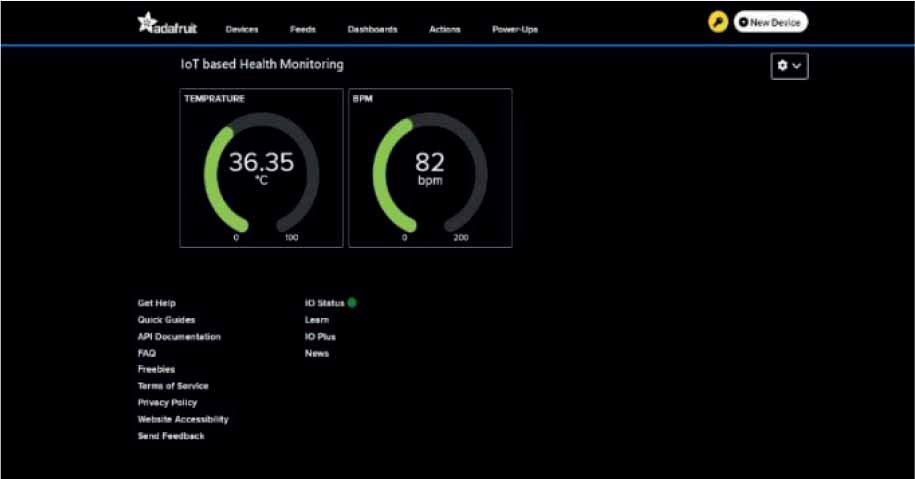
Figure 6.
Monitored healthcare data
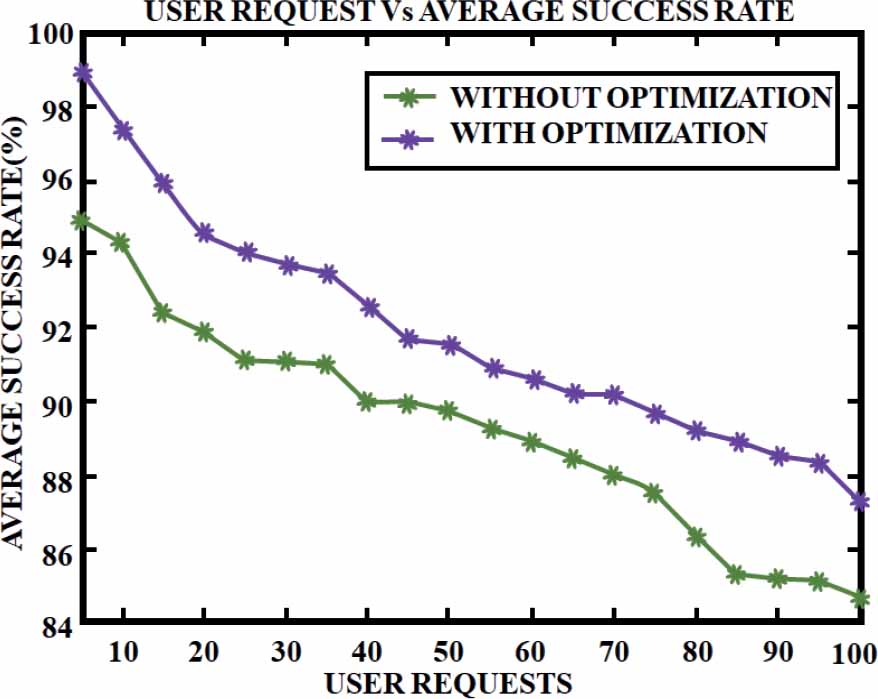
Figure 7.
Average Success Rate
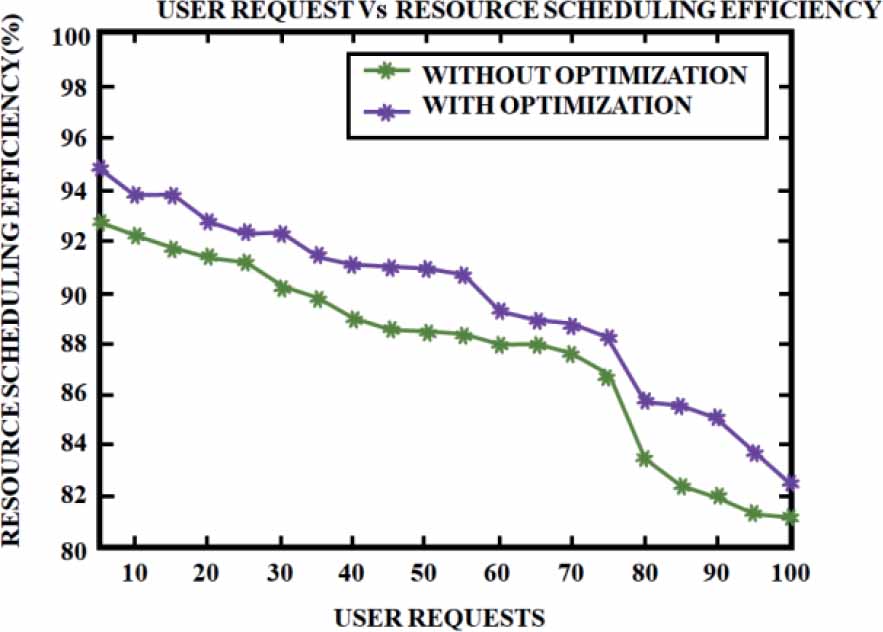
Figure 8.
Resource Scheduling Efficiency
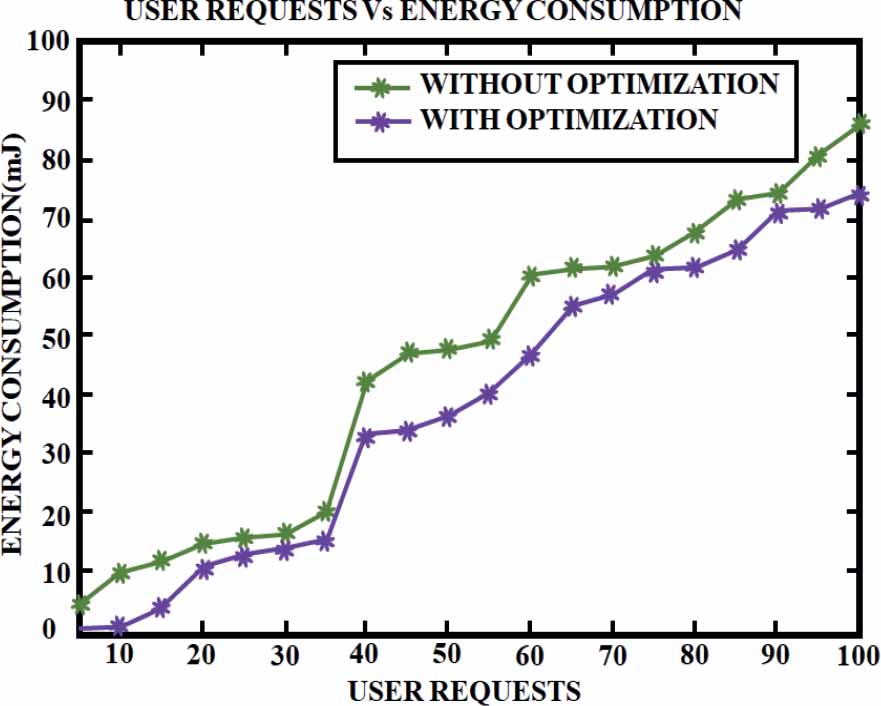
Figure 9.
Energy Consumption
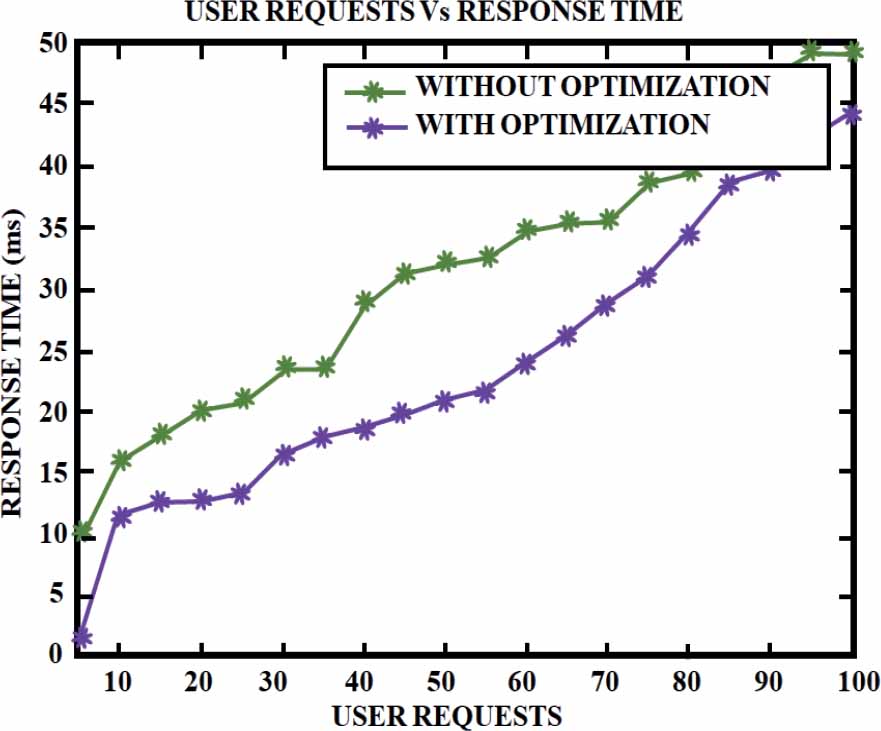
Figure 10.
Response Time
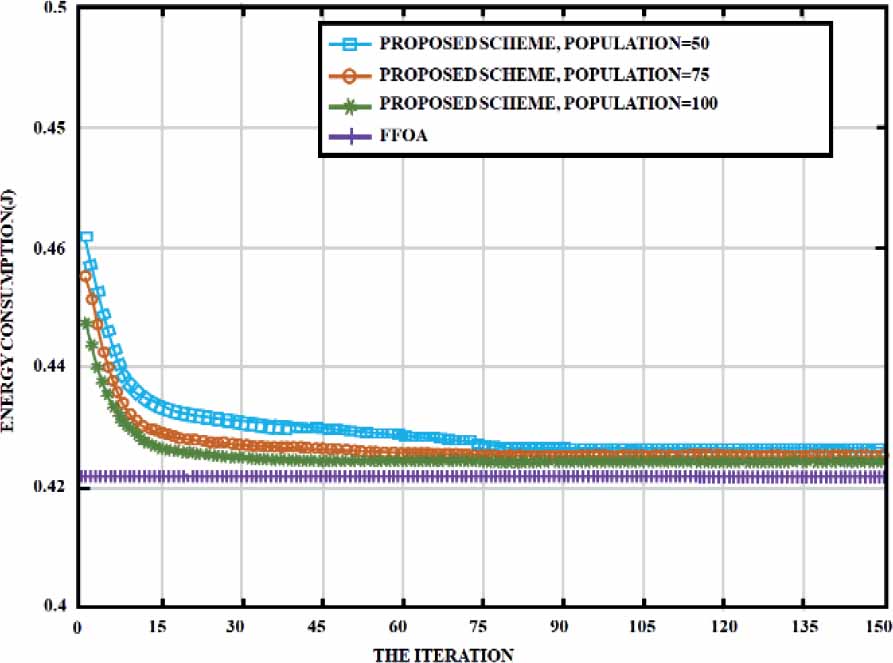
Figure 11.
Energy consumption Vs the iterations
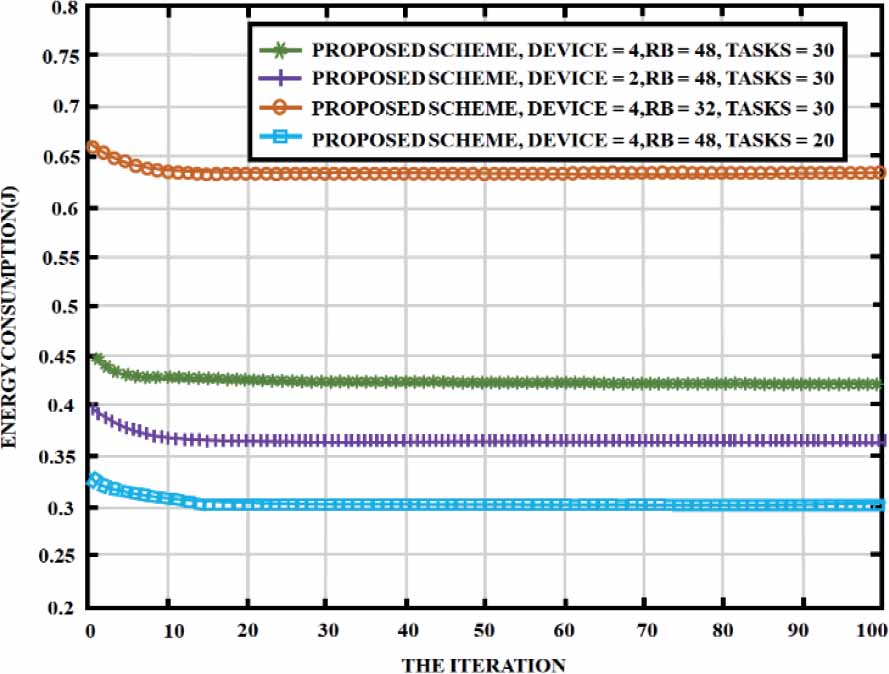
Figure 12.
Convergence performance with devices/tasks/RBs
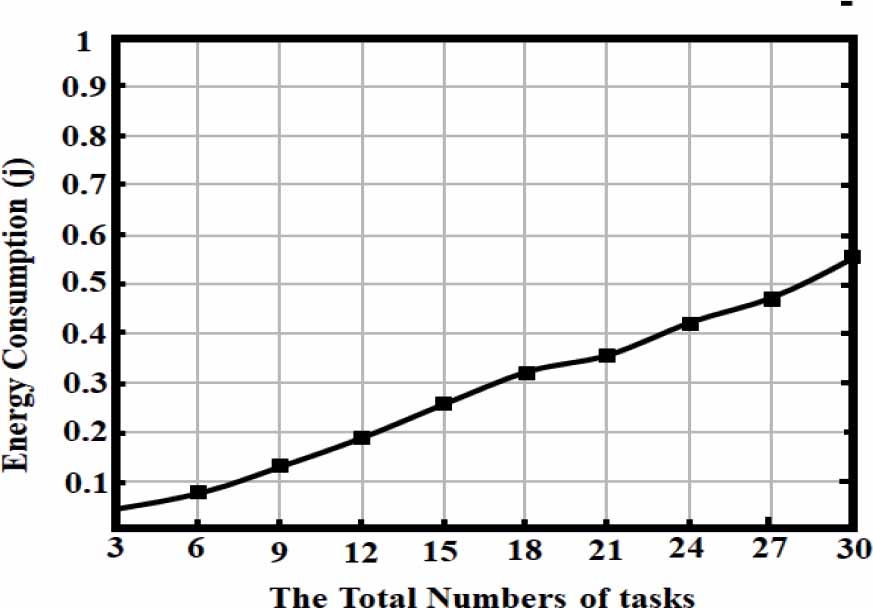
Figure 13.
Energy consumption Vs the number of tasks
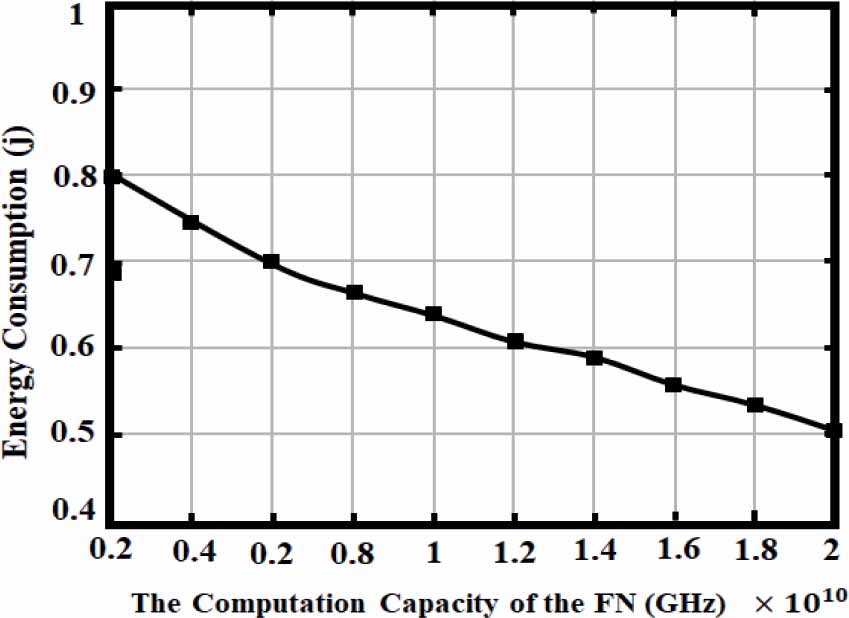
Figure 14.
Energy consumption versus the FN’s computation capacity
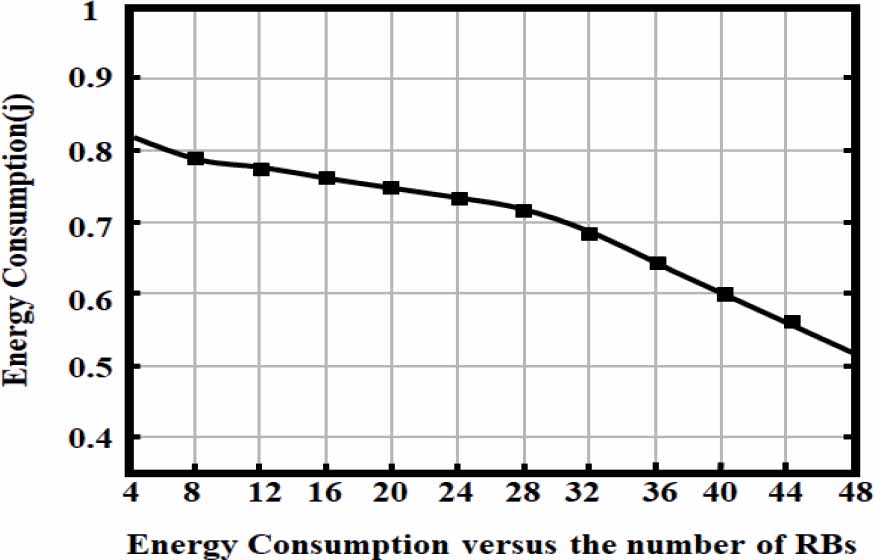
Figure 15.
Energy consumption versus the number of RBs
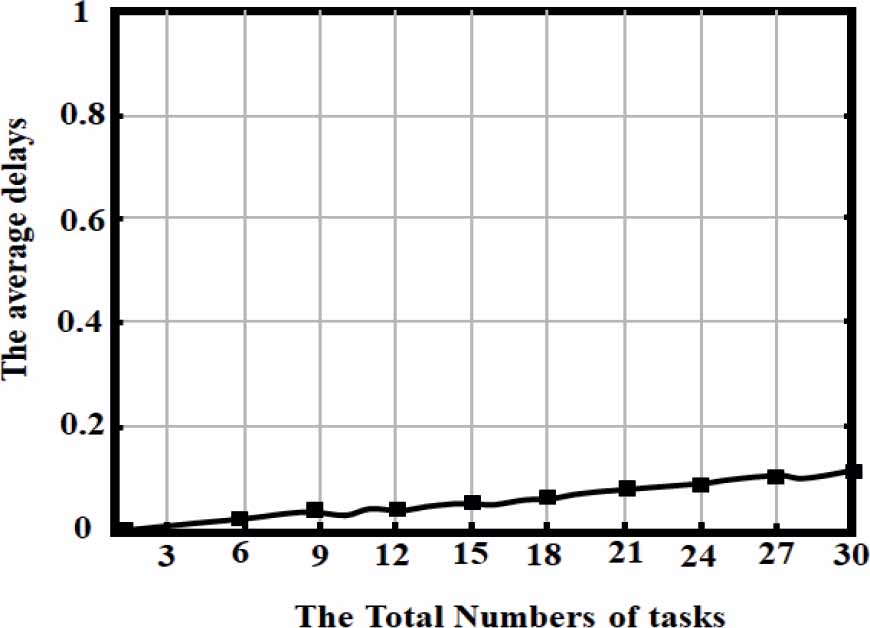
Figure 16.
Average delay Vs the number of tasks
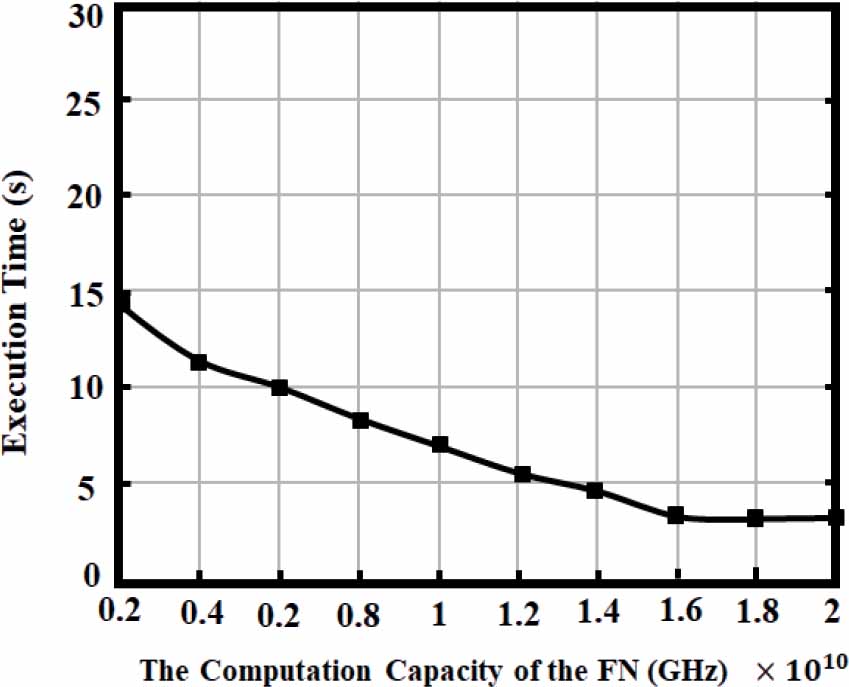
Figure 17.
Average delay Vs the FN’s computation capacity
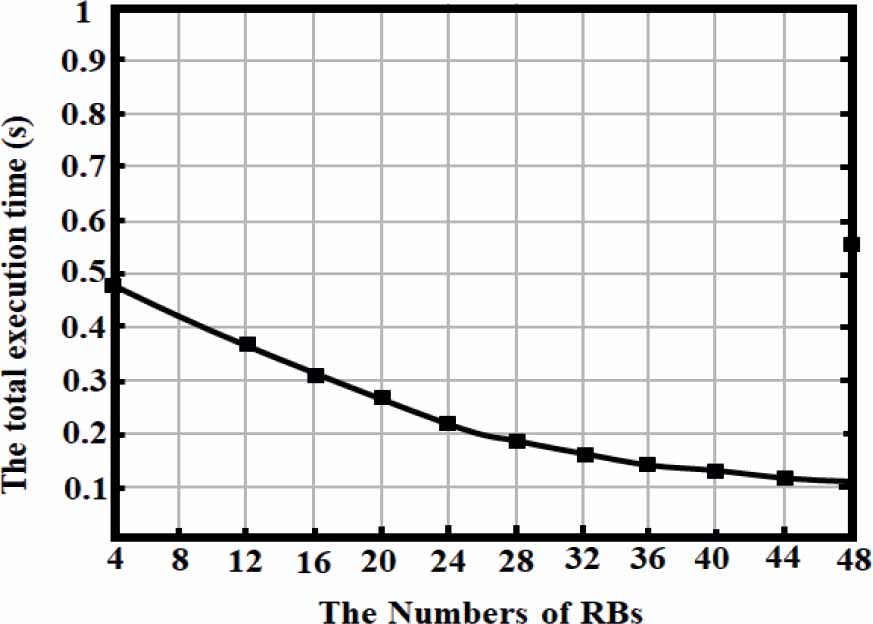
Figure 18.
Average delay Vs the number of RBs