

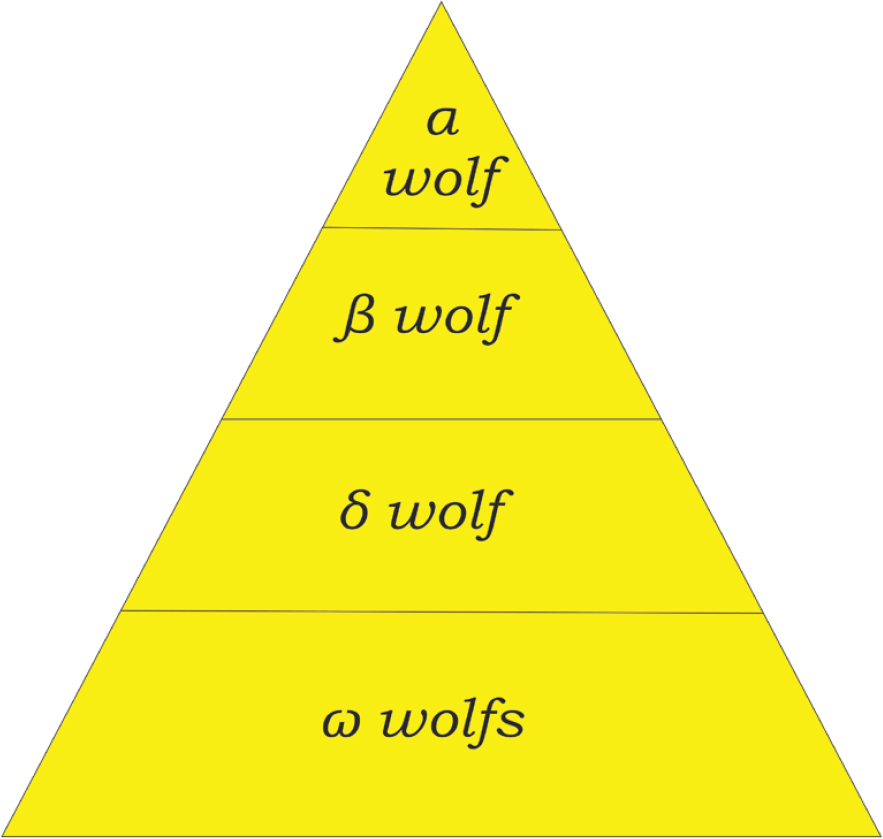
Figure 1.
Chierarchy in a group of wolves
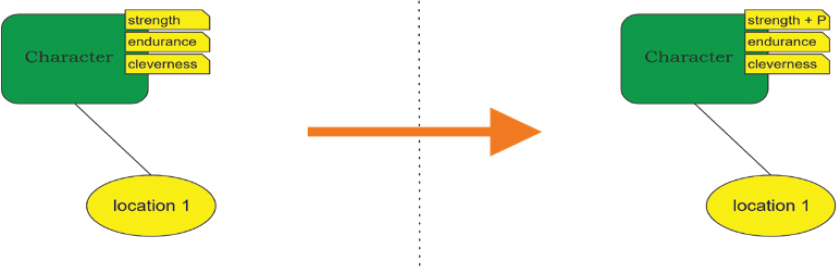
Figure 2.
A sheaf graph presenting a single iteration
Table 1.
The results for three parameters
| Imax | GW 2024 | Random | ||||||
|---|---|---|---|---|---|---|---|---|
| m | w | Ib | Ia | % of winning solutions | Ib | Ia | % of winning solutions | |
| 5 | 12 | 4 | 3 | 4 | 14 | – | – | 0 |
| 10 | 12 | 4 | 4 | 7 | 56 | 9 | 10 | 8 |
| 20 | 12 | 4 | 4 | 10 | 92 | 10 | 16 | 88 |
| 50 | 12 | 4 | 4 | 11 | 100 | 9 | 16 | 100 |
| 5 | 15 | 5 | 4 | 5 | 20 | – | – | 0 |
| 10 | 15 | 5 | 4 | 8 | 60 | 8 | 10 | 18 |
| 20 | 15 | 5 | 4 | 11 | 94 | 9 | 16 | 92 |
| 50 | 15 | 5 | 5 | 12 | 100 | 9 | 16 | 100 |
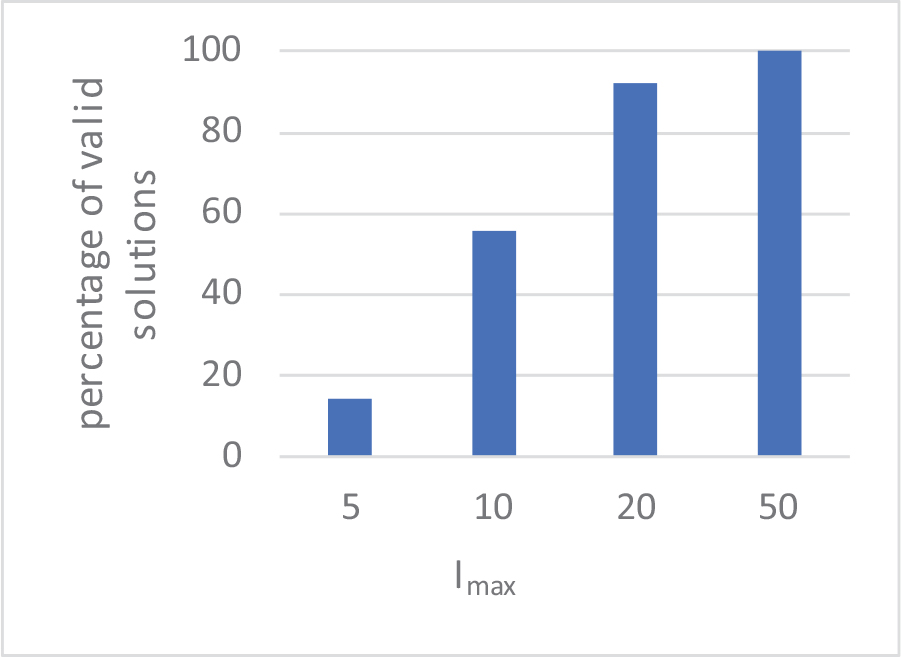
Figure 3.
A percentage presentation of a number of valid results for the first set of parameters for the first group of experiments
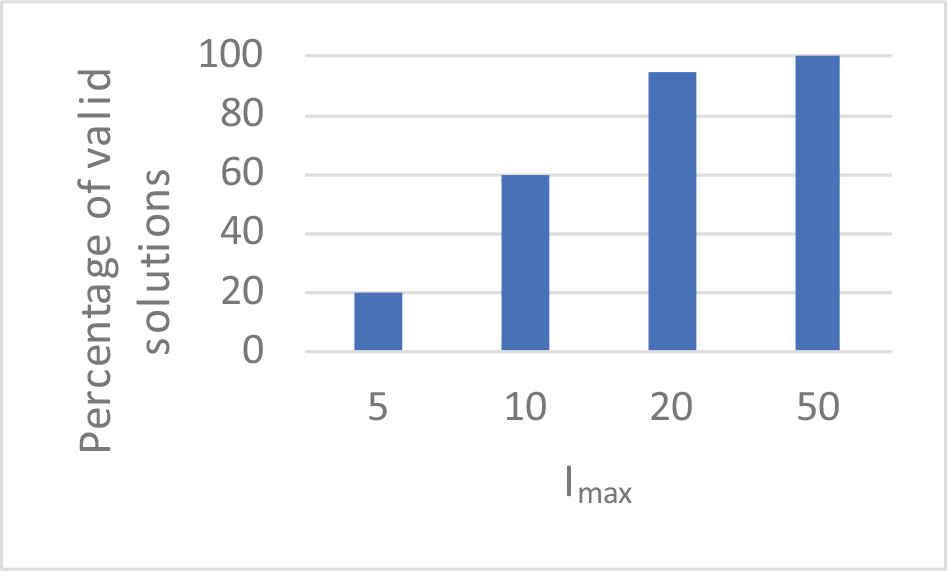
Figure 4.
A percentage presentation of a number of valid results for the second set of parameters for the first group of experiments
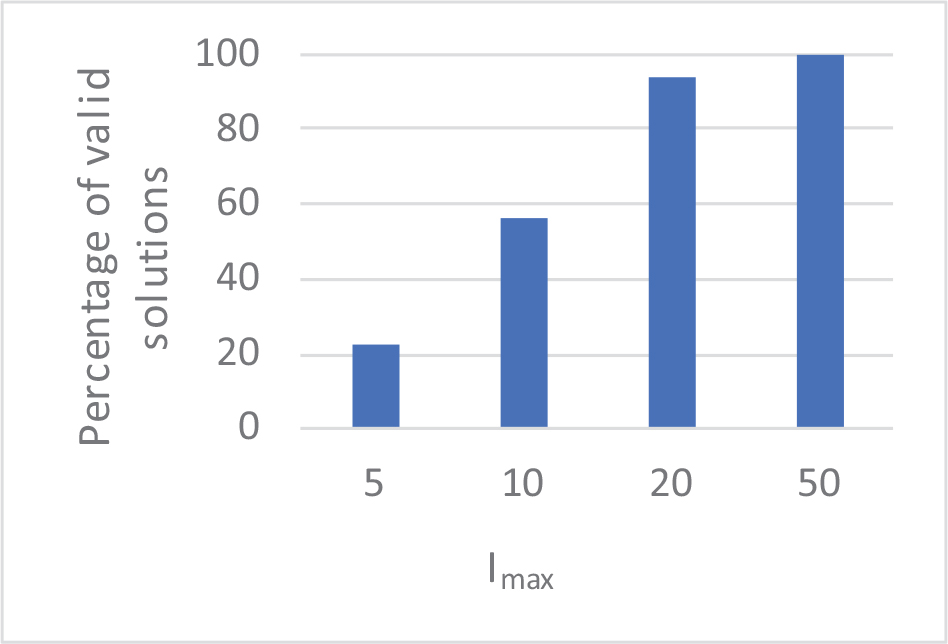
Figure 5.
A percentage presentation of a number of valid results for the first set of parameters for the second group of experiments
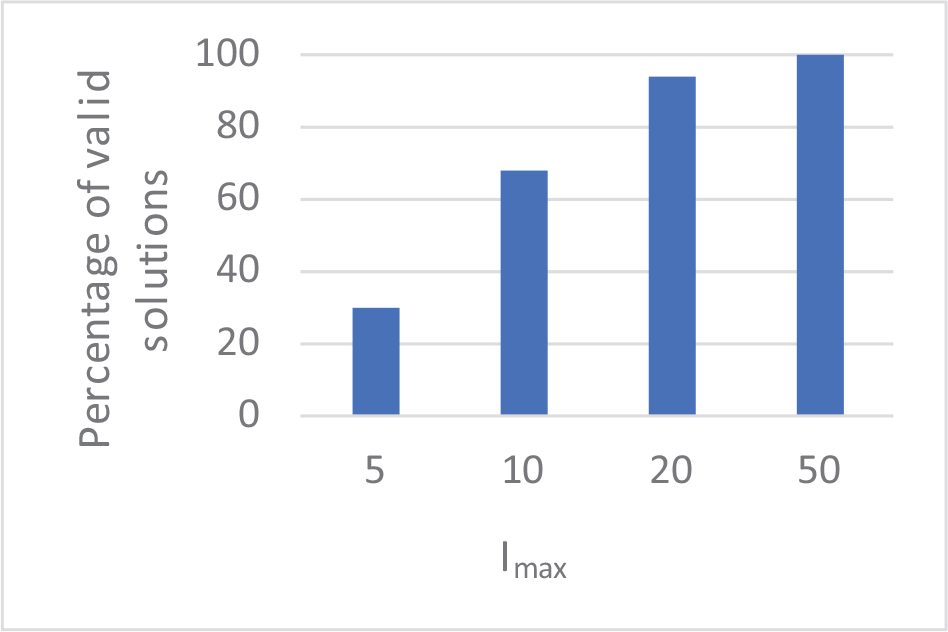
Figure 6.
A percentage presentation of a number of valid results for the second set of parameters for the second group of experiments