

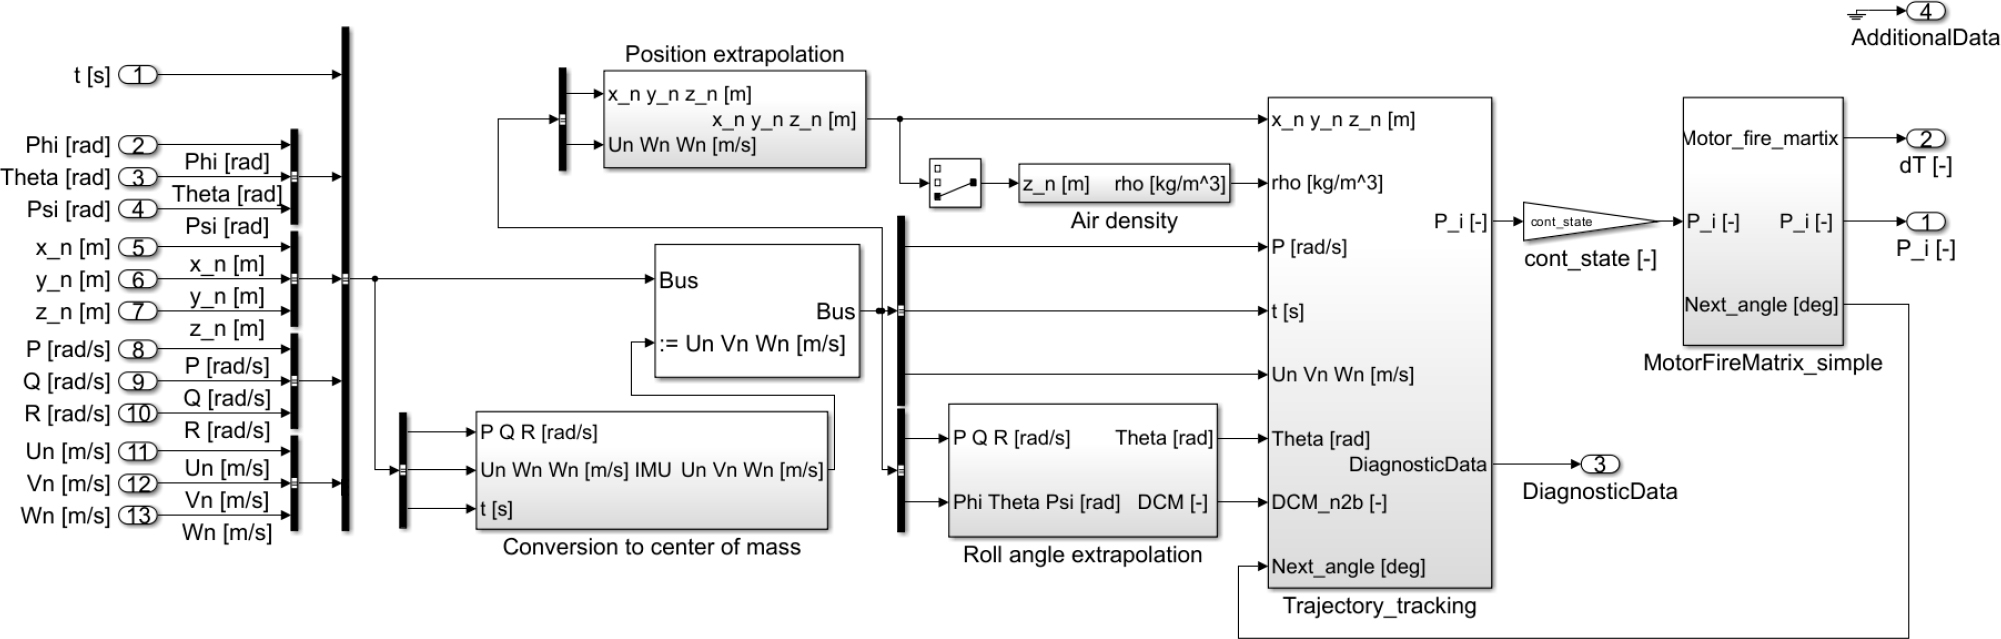
Figure 1.
Top-level Simulink scheme of the control algorithm
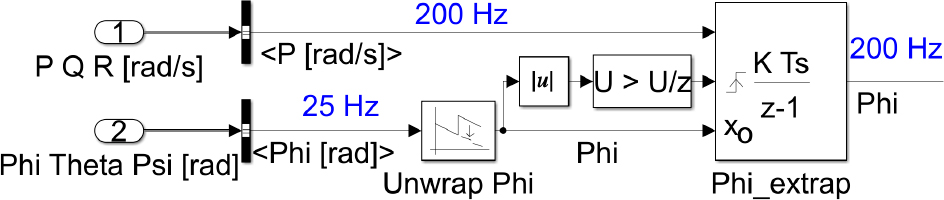
Figure 2.
Roll angle extrapolation block scheme (signal frequencies denoted in blue font)
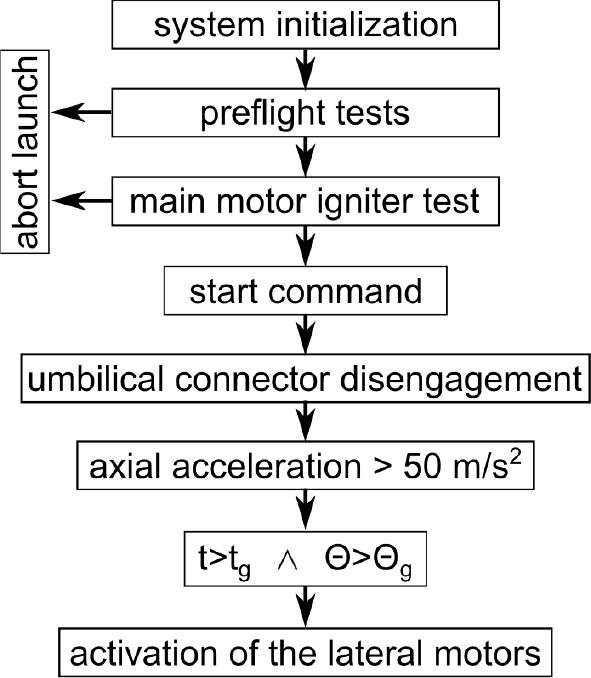
Figure 3.
Simplified sequence of events before activation of the thrusters
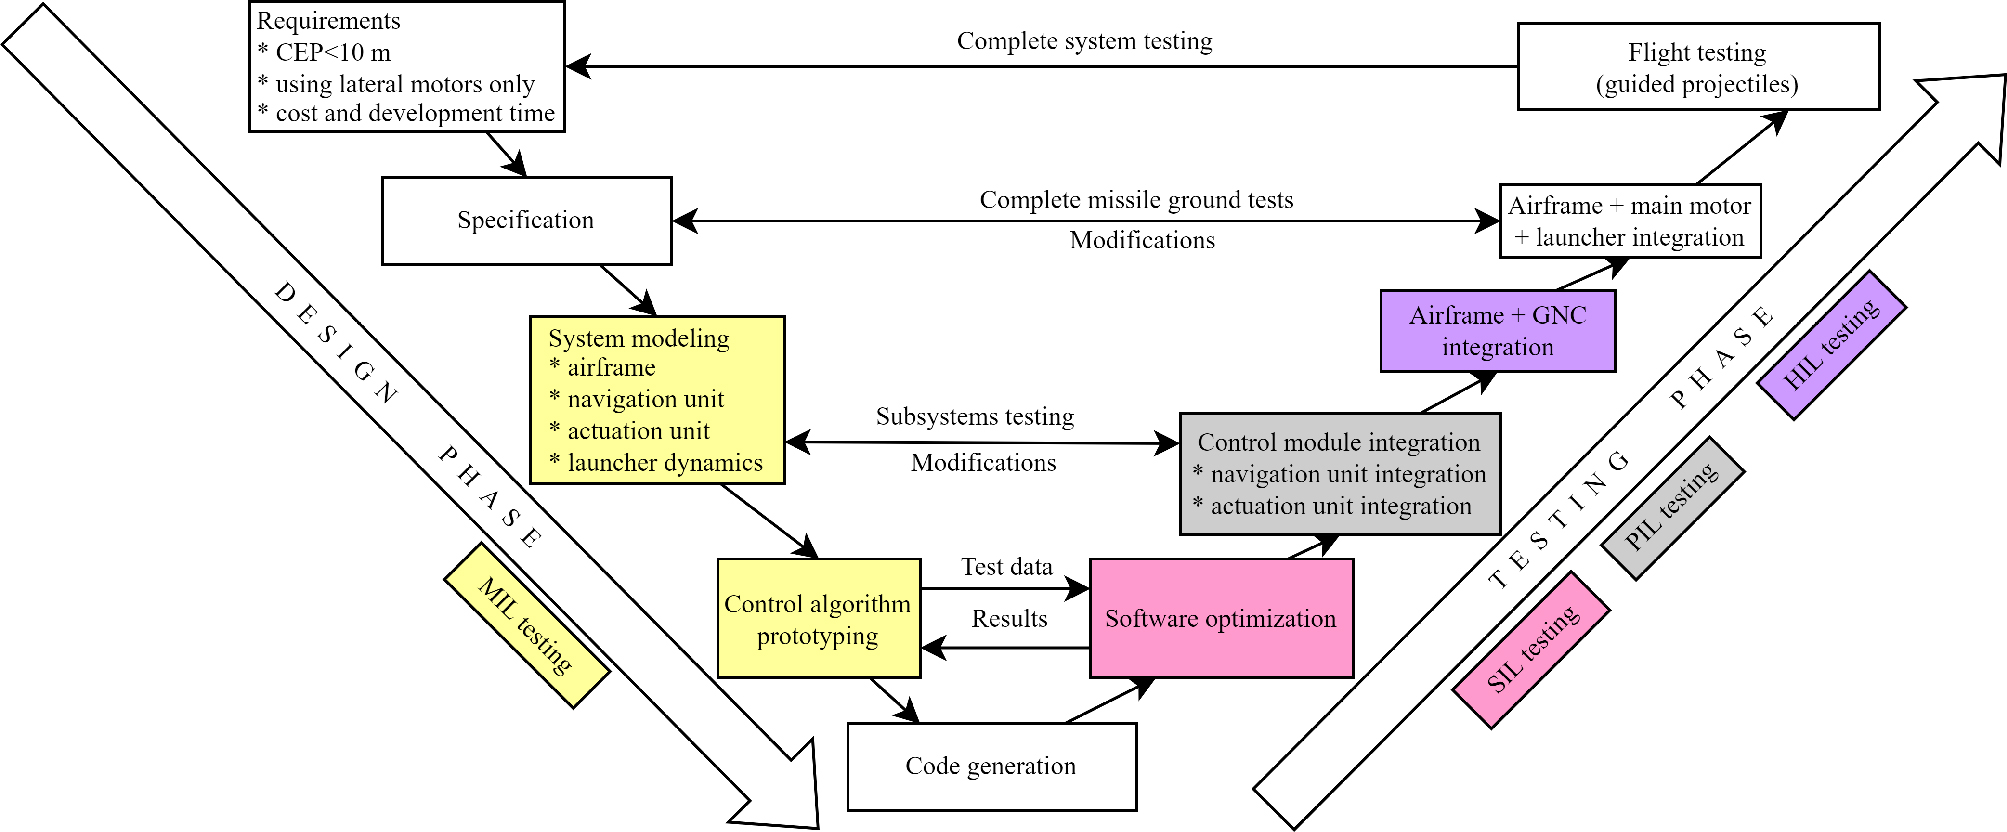
Figure 4.
Software development process
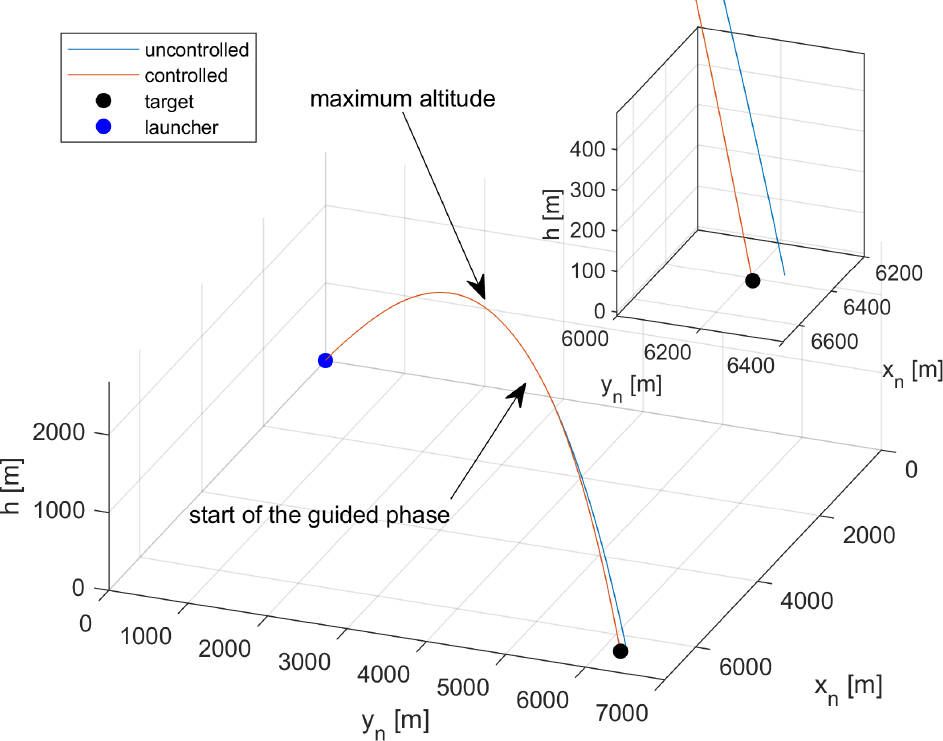
Figure 5.
Three-dimensional flight trajectory
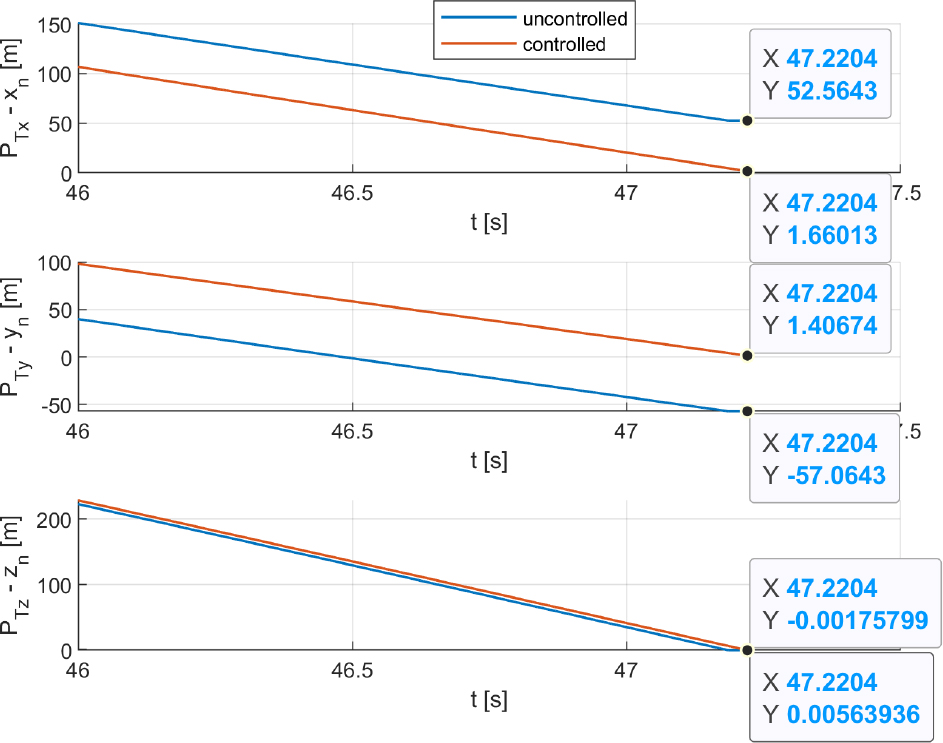
Figure 6.
Position errors (in the last phase of flight)
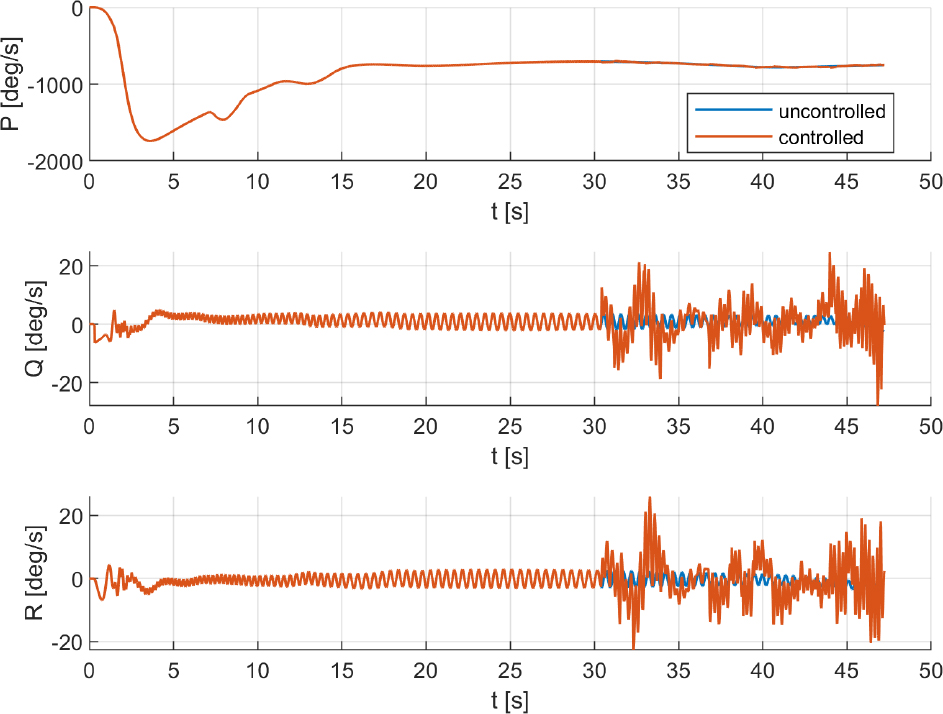
Figure 7.
Angular rates
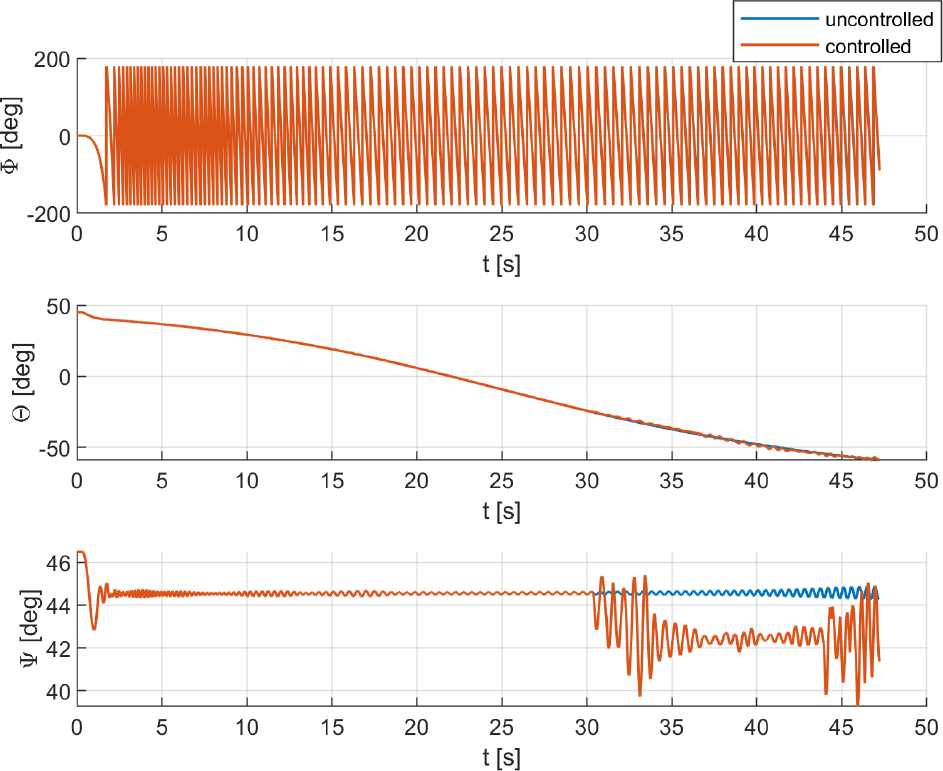
Figure 8.
Euler angles (roll, pitch, and yaw)
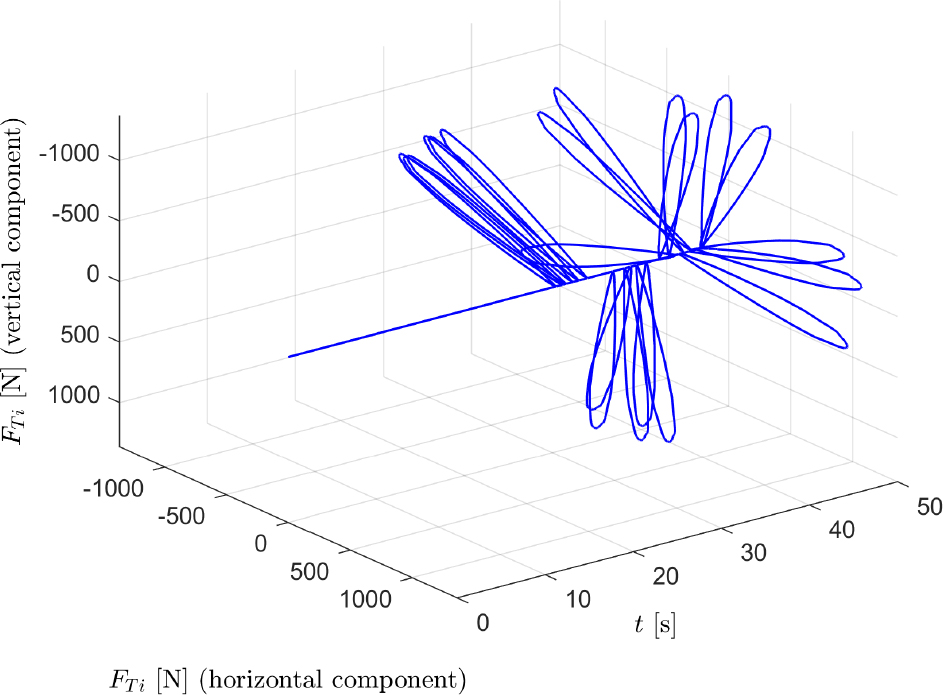
Figure 9.
Forces generated by lateral motors
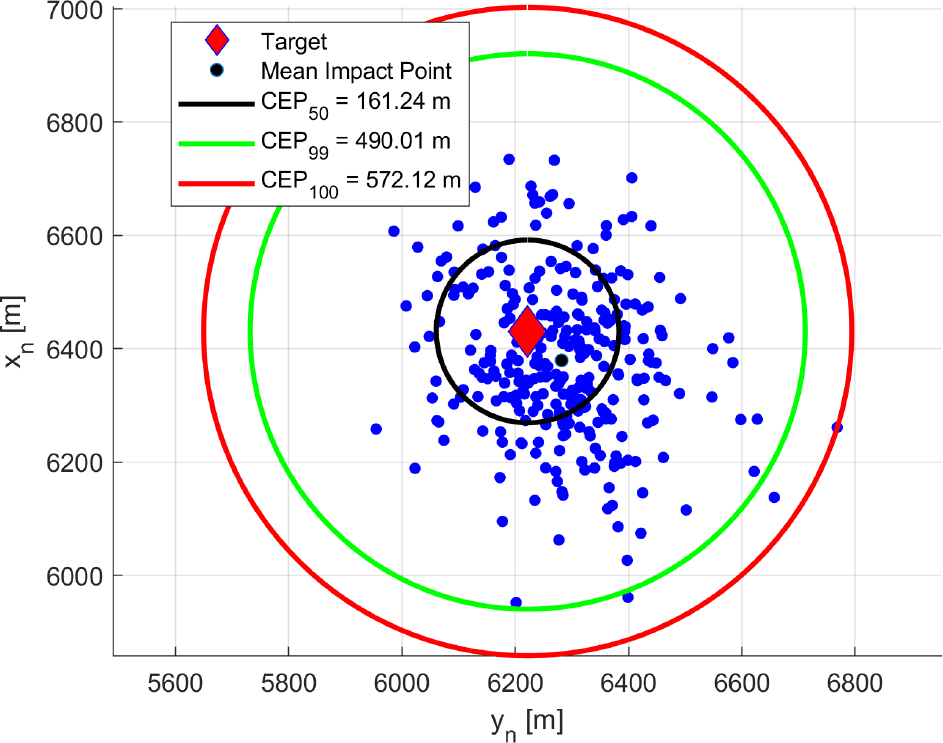
Figure 10.
Impact point dispersion (uncontrolled flights)
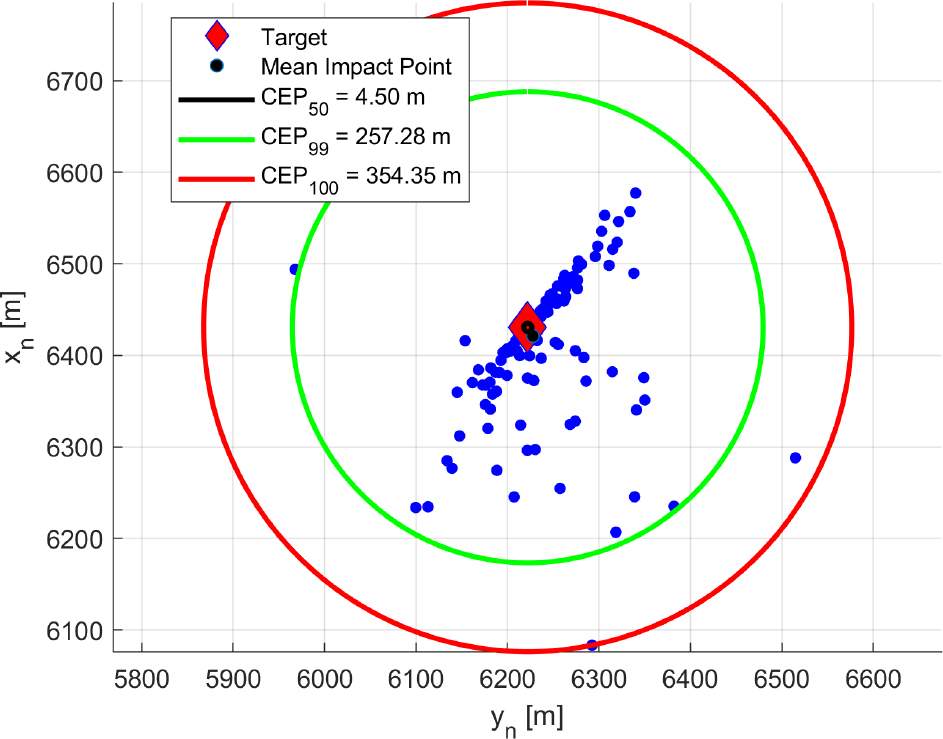
Figure 11.
Impact point dispersion (controlled flights)
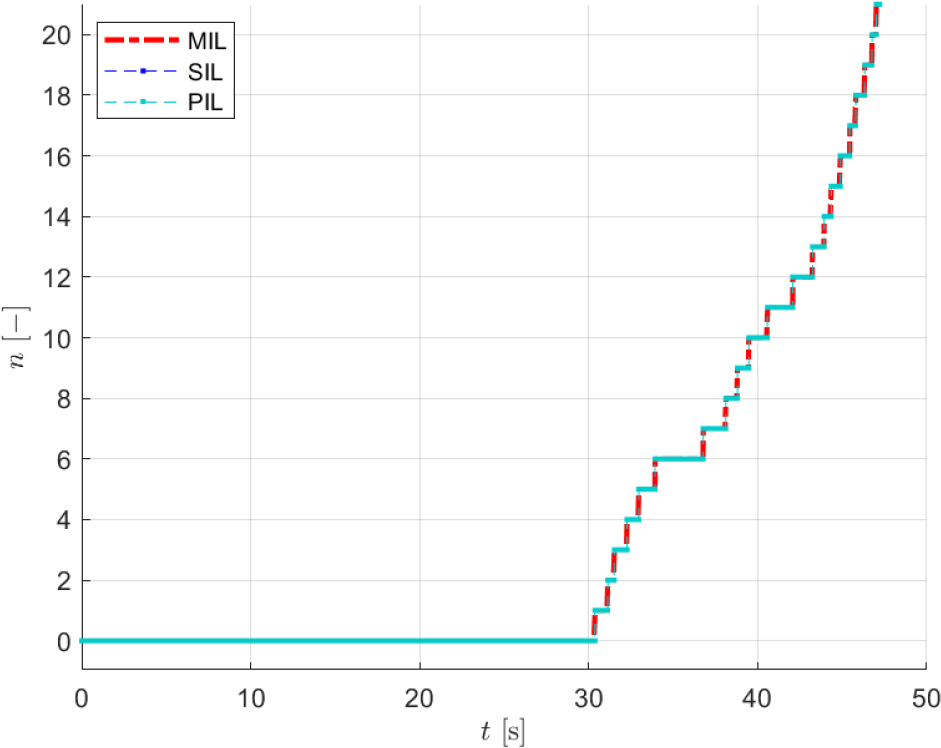
Figure 12.
Number of activated lateral motors
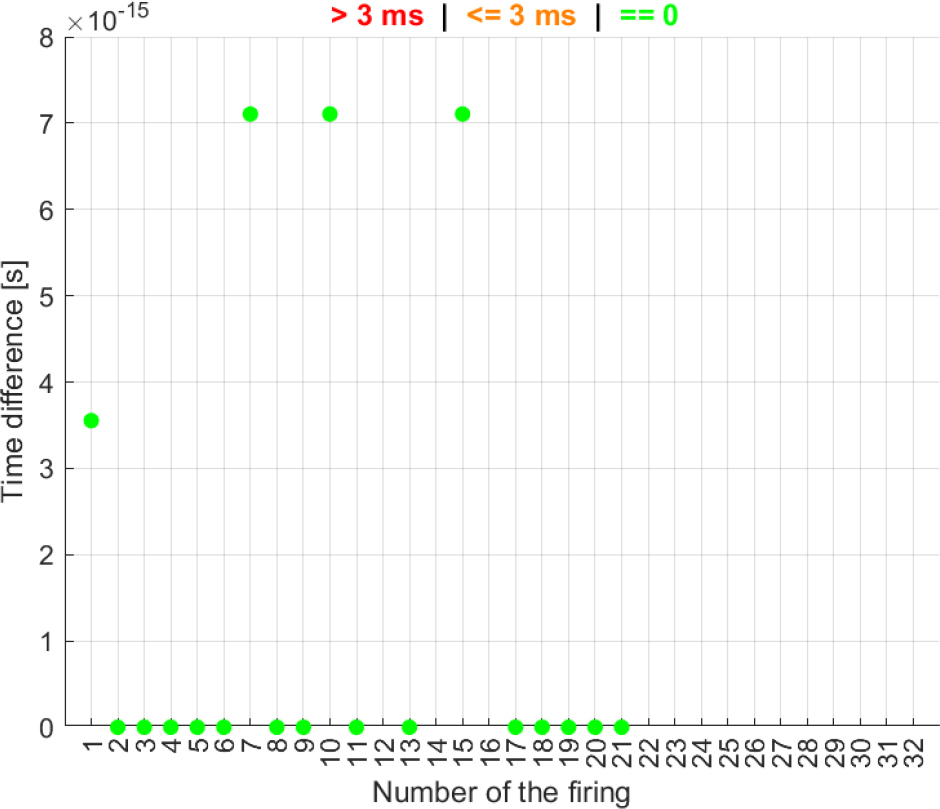
Figure 13.
Time differences in firing commands (Simulink vs C code)
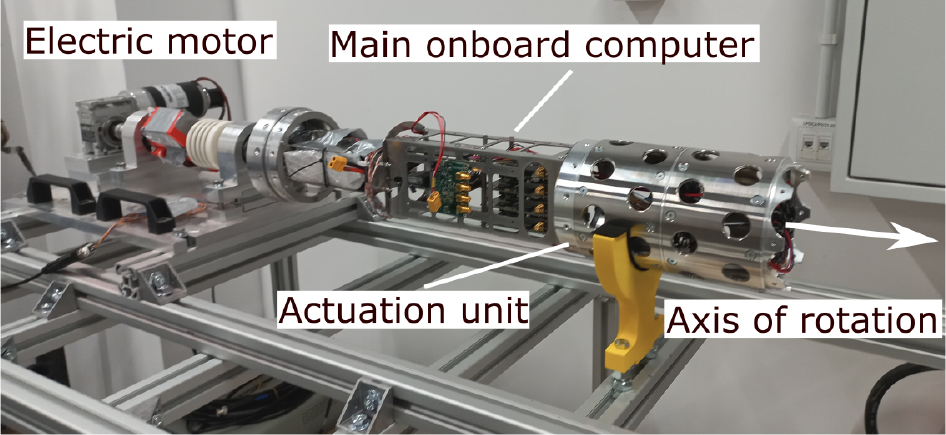
Figure 14.
Control system prototype during the laboratory experiments
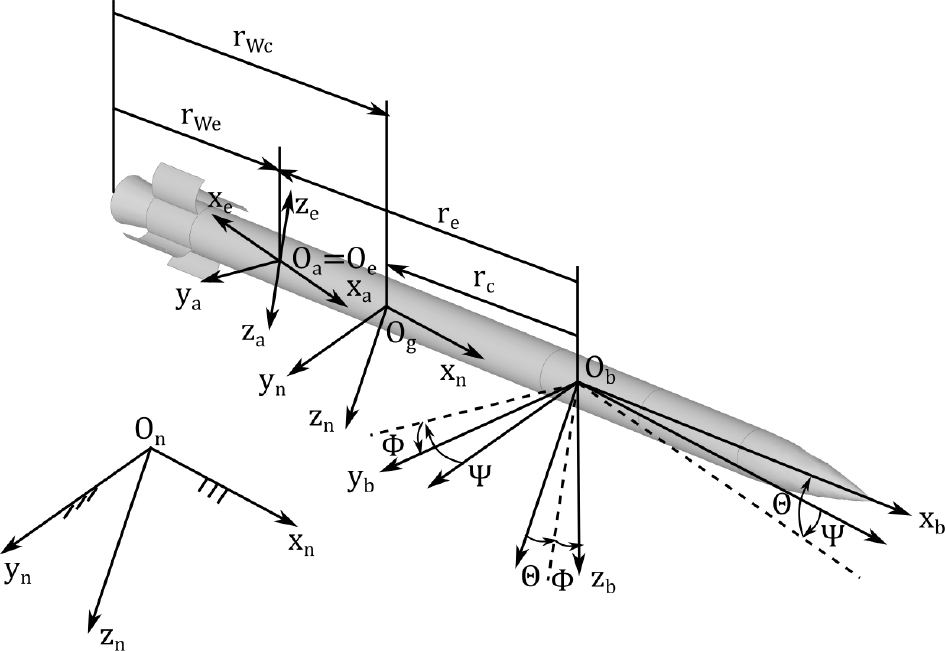
Figure 15.
Coordinate systems