
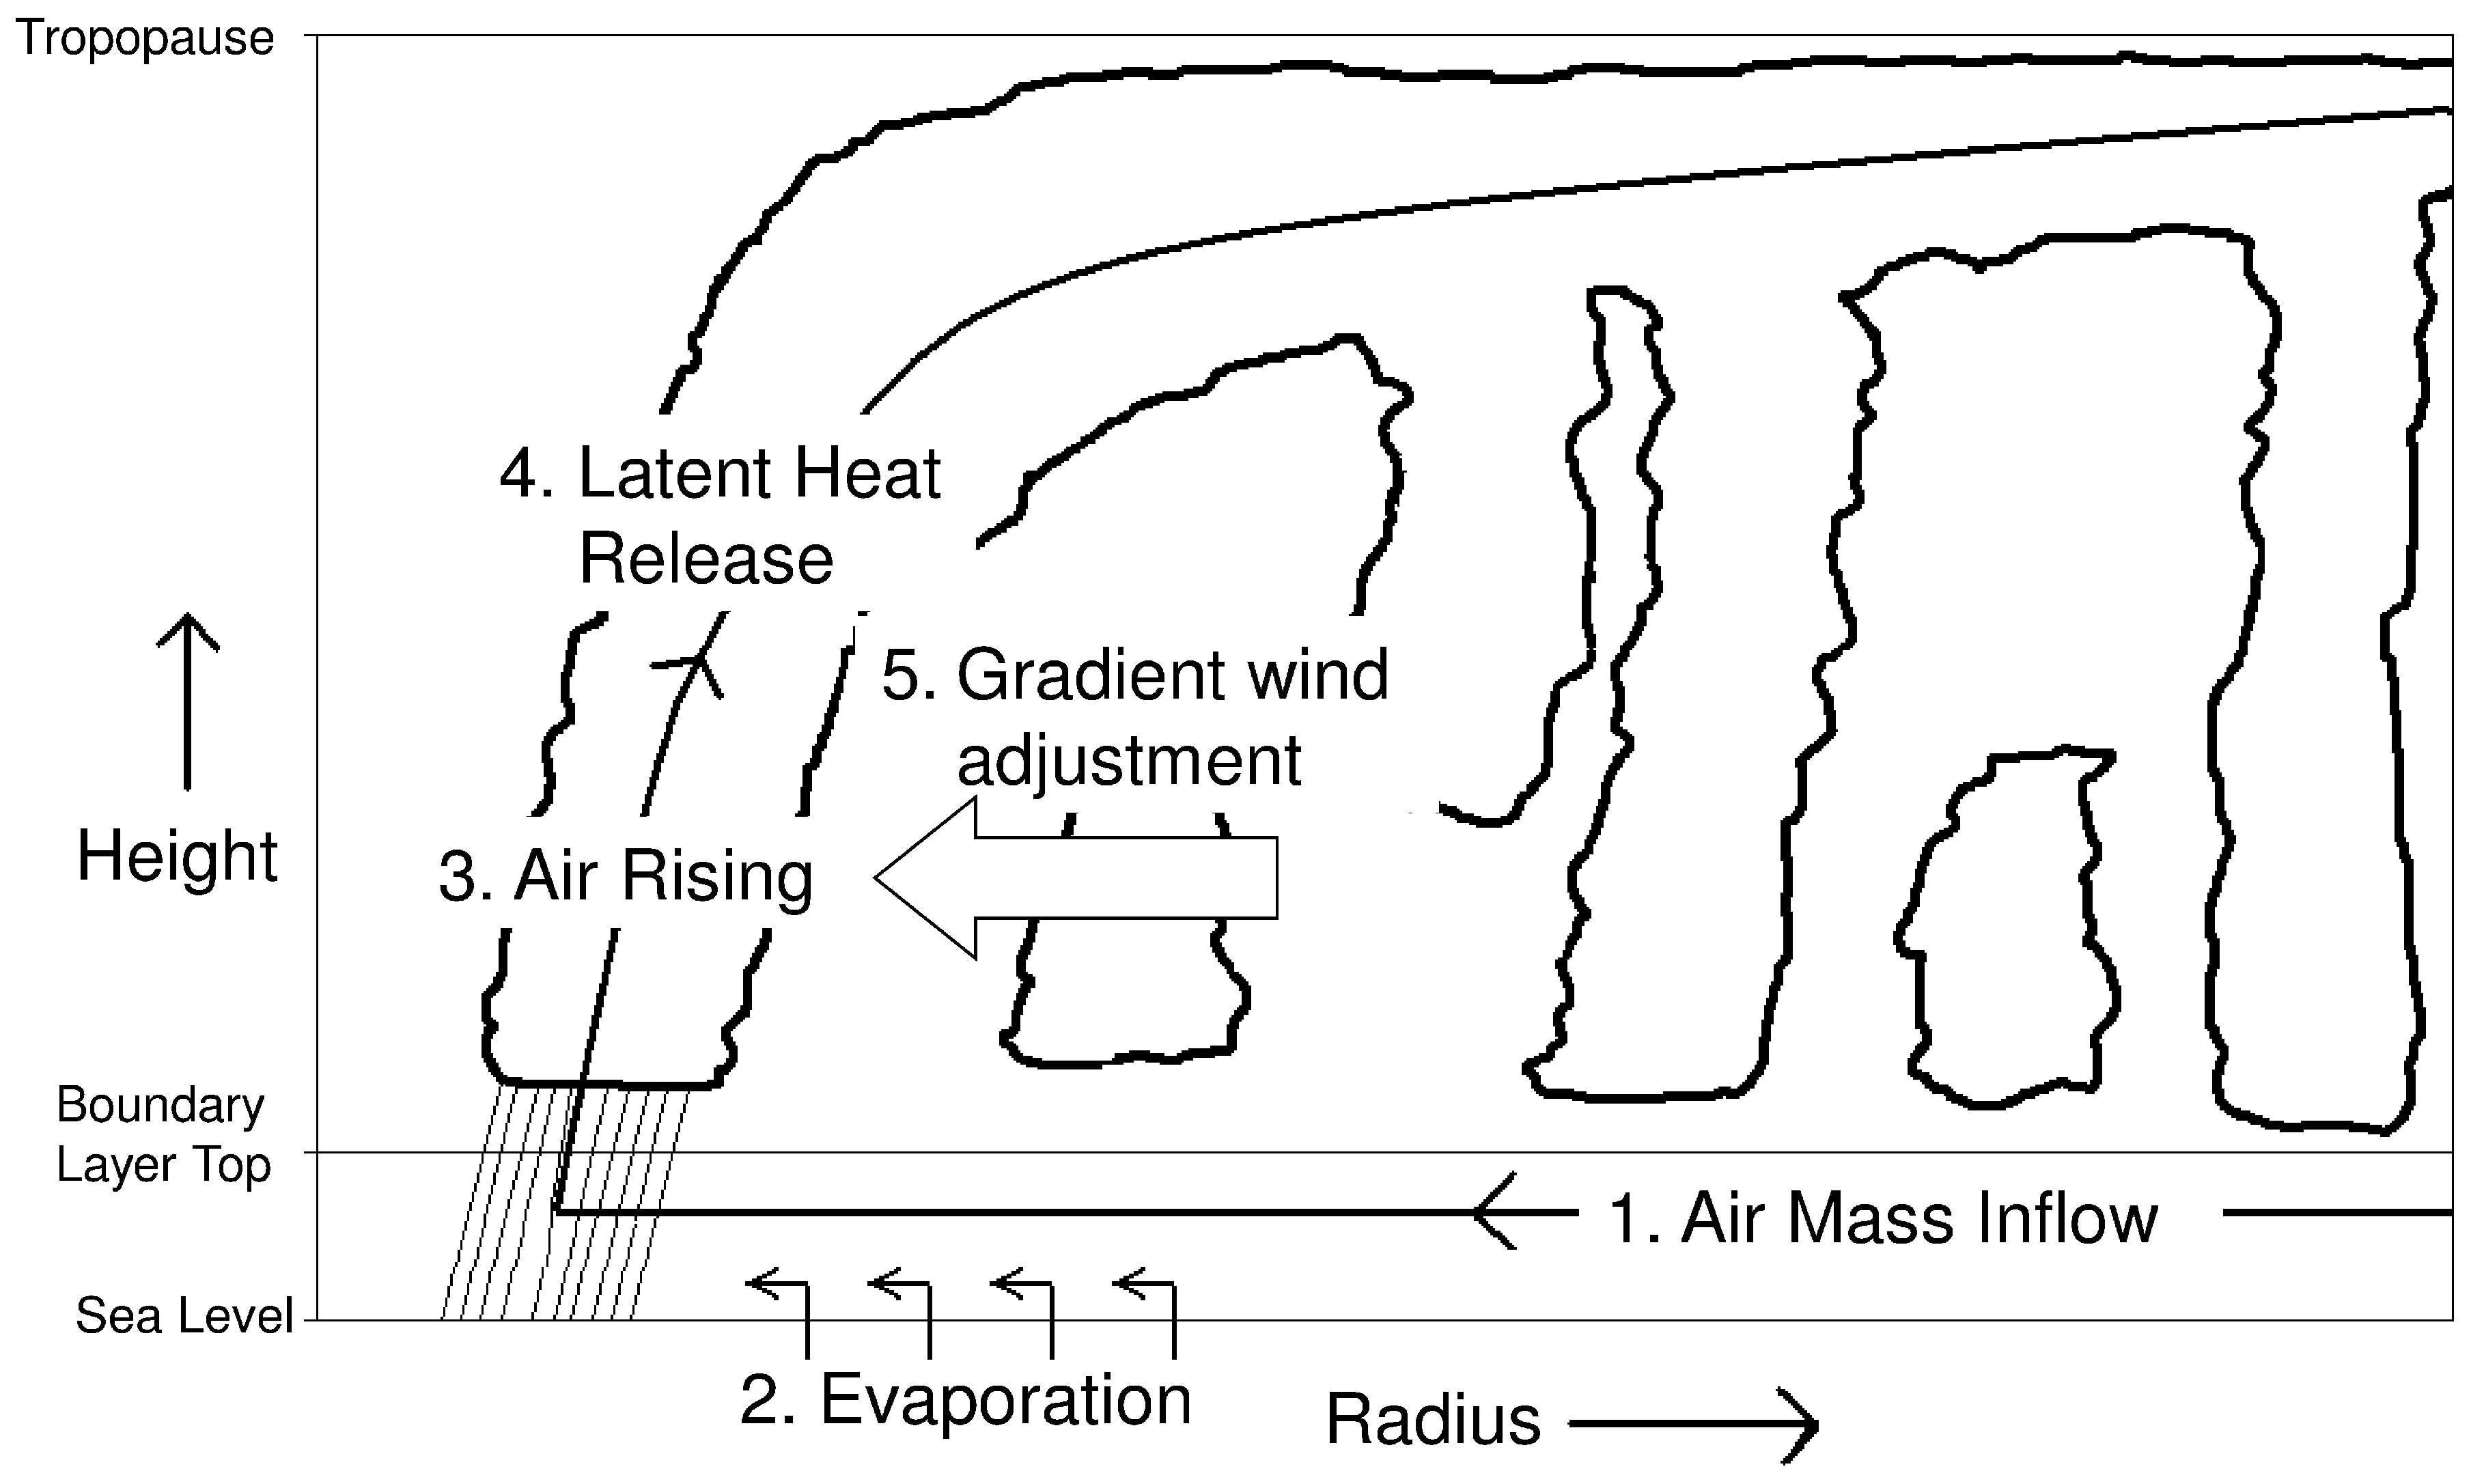
Fig. 1.
Conceptual model of intensification.
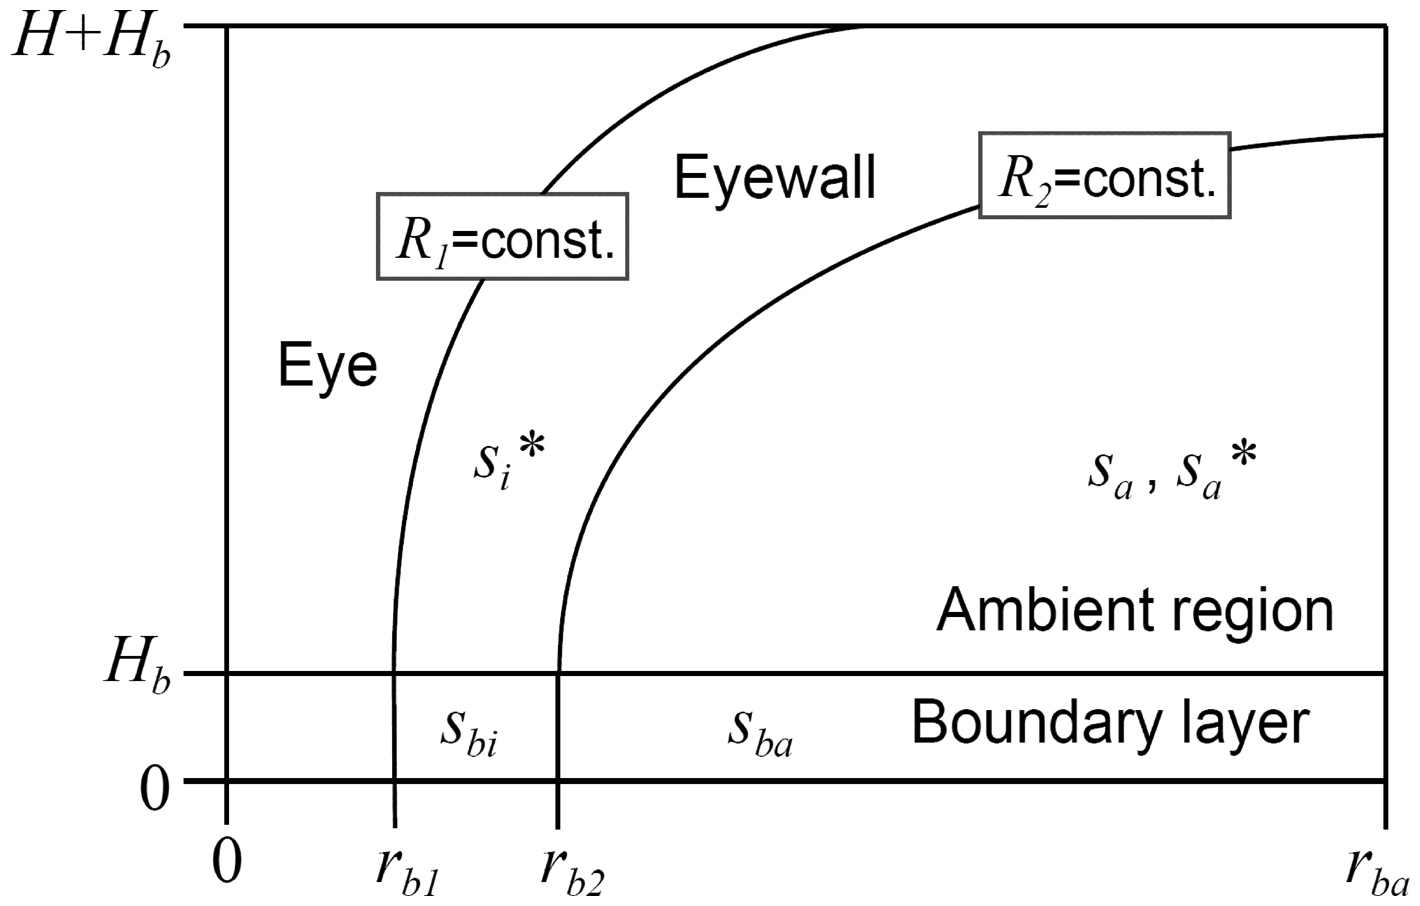
Fig. 2.
Sketch of the low-order tropical cyclone model.
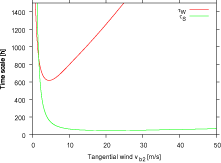
Fig. 3.
Time scale of WISHE τW (red curve) and of the secondary circulation τS (green curve) as a function of tangential wind vb2.
Table 1.
Parameter values for the low order tropical cyclone model experiment REF.
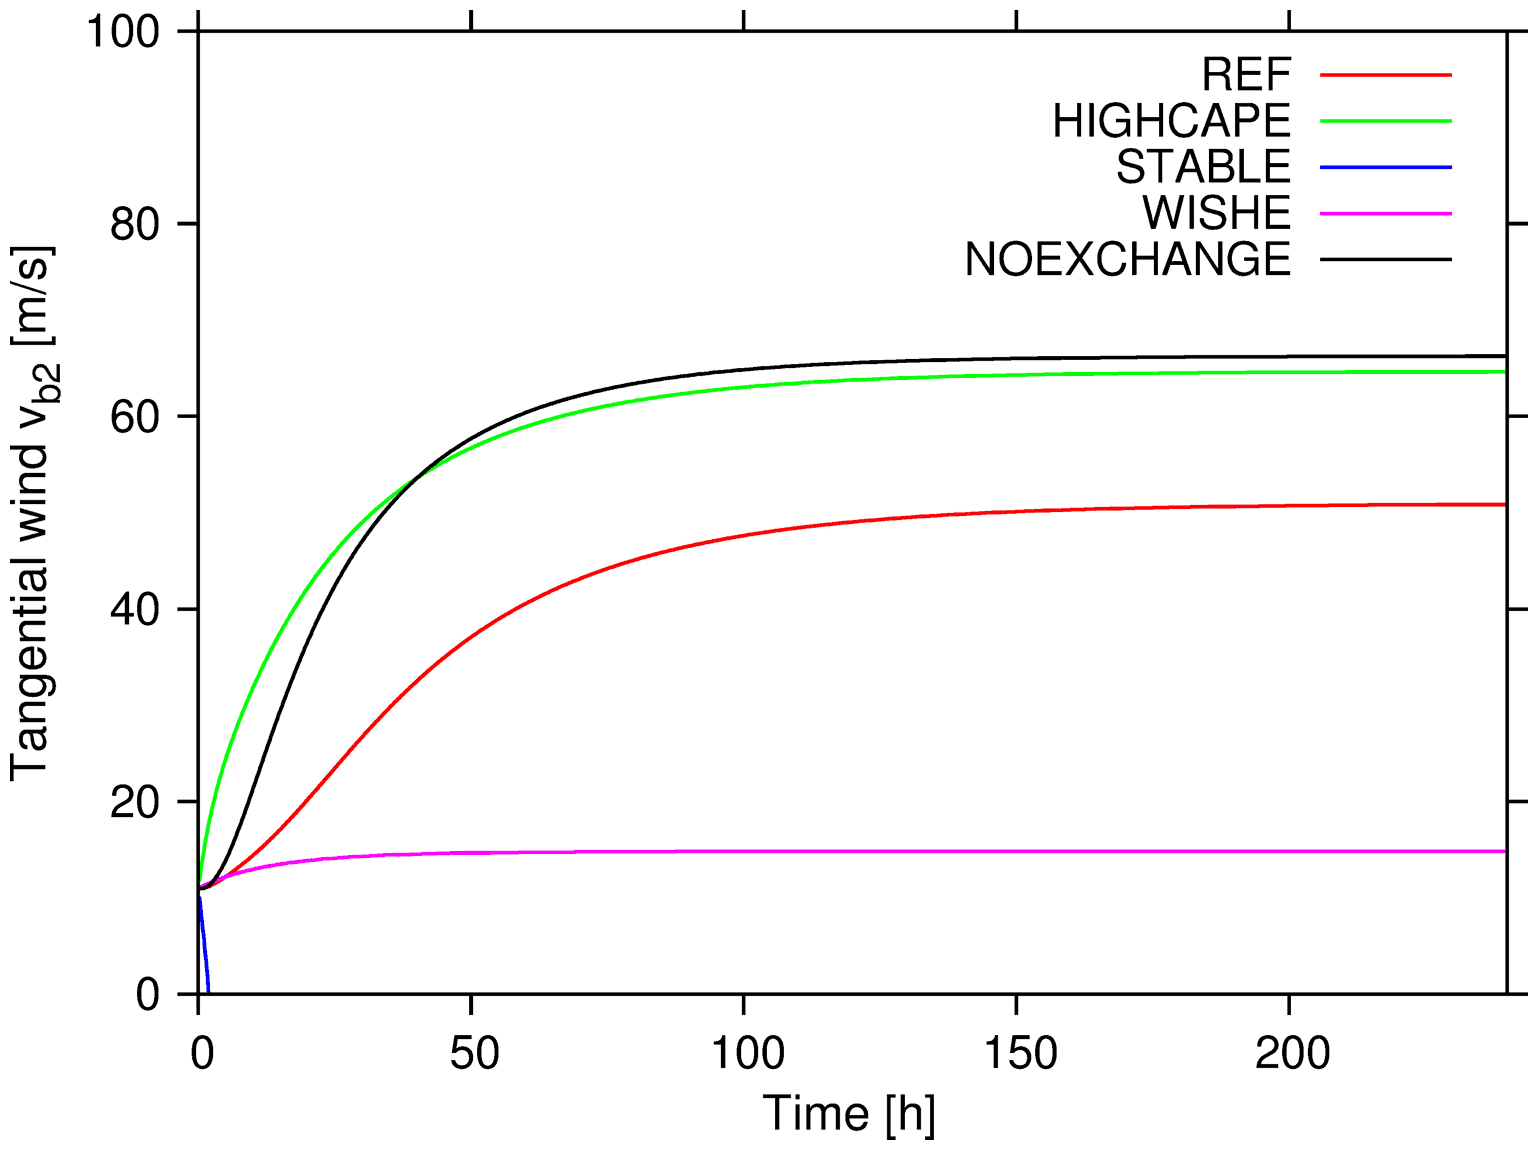
Fig. 4.
Tangential wind vb2 as a function of time for the experiments REF (red curve), HIGHCAPE (green curve), STABLE (blue curve), WISHE (magenta curve) and NOEXCHANGE (black curve).
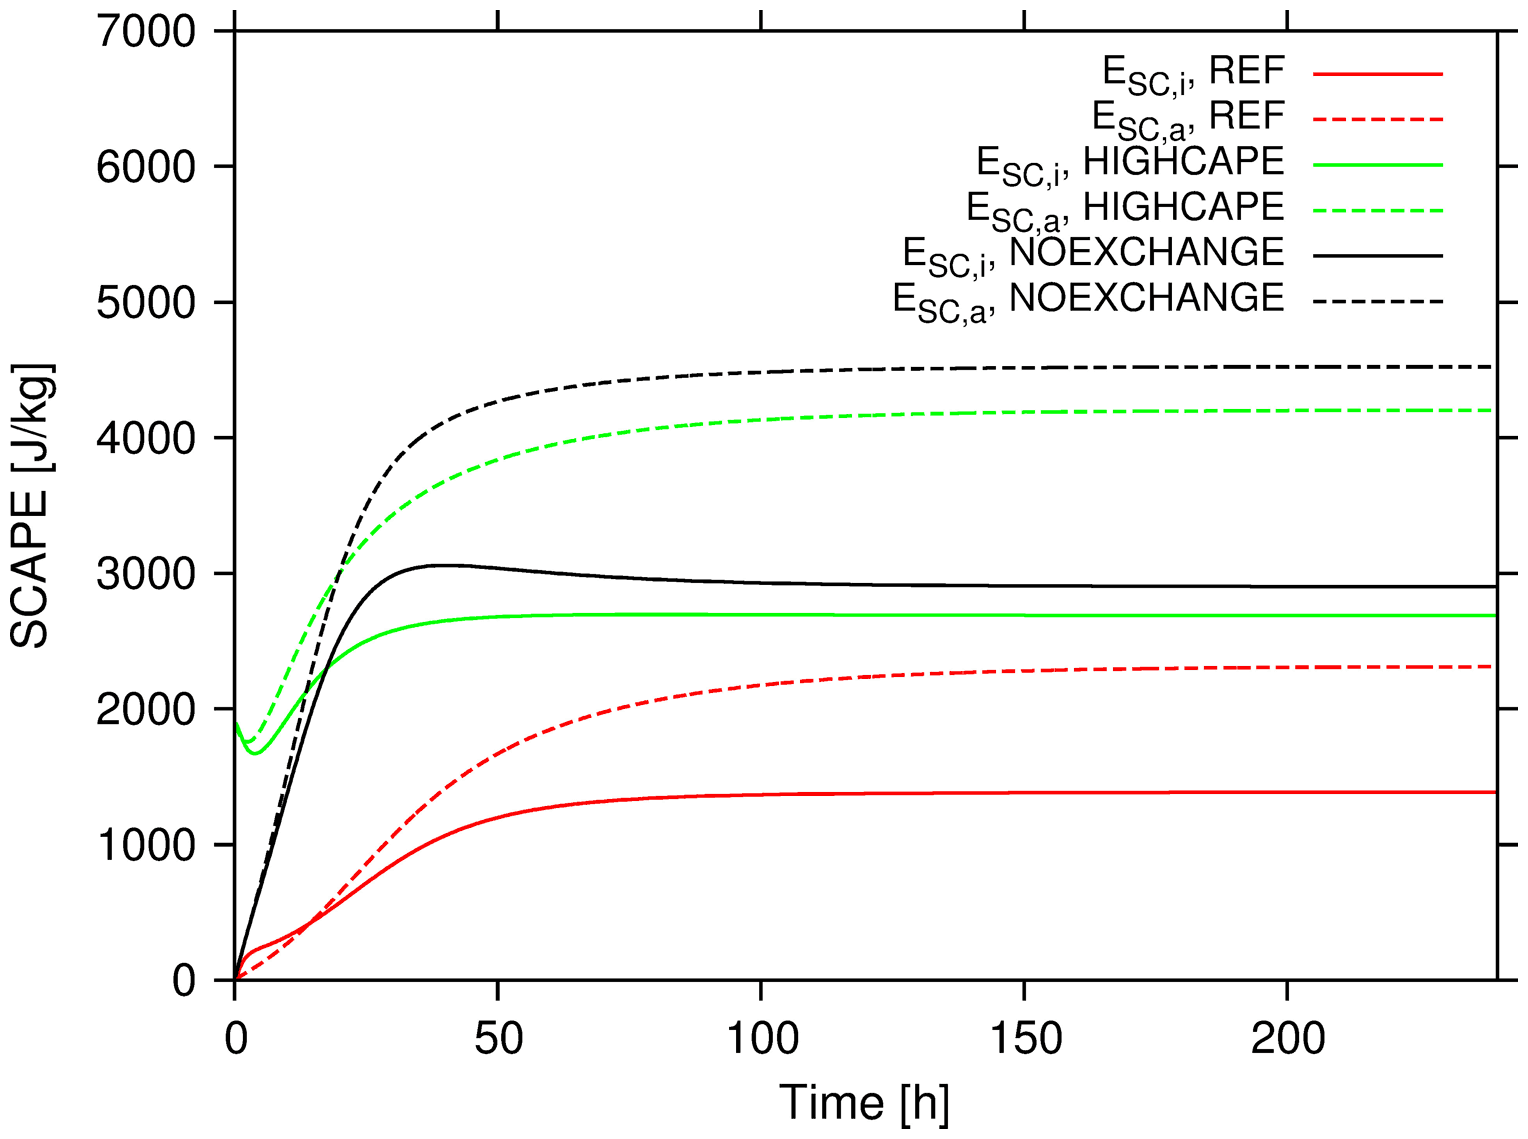
Fig. 5.
ESC,i (solid curves) and ESC,a (dashed curves) as a function of time for the experiments REF (red curves), HIGHCAPE (green curves) and NOEXCHANGE (black curves).
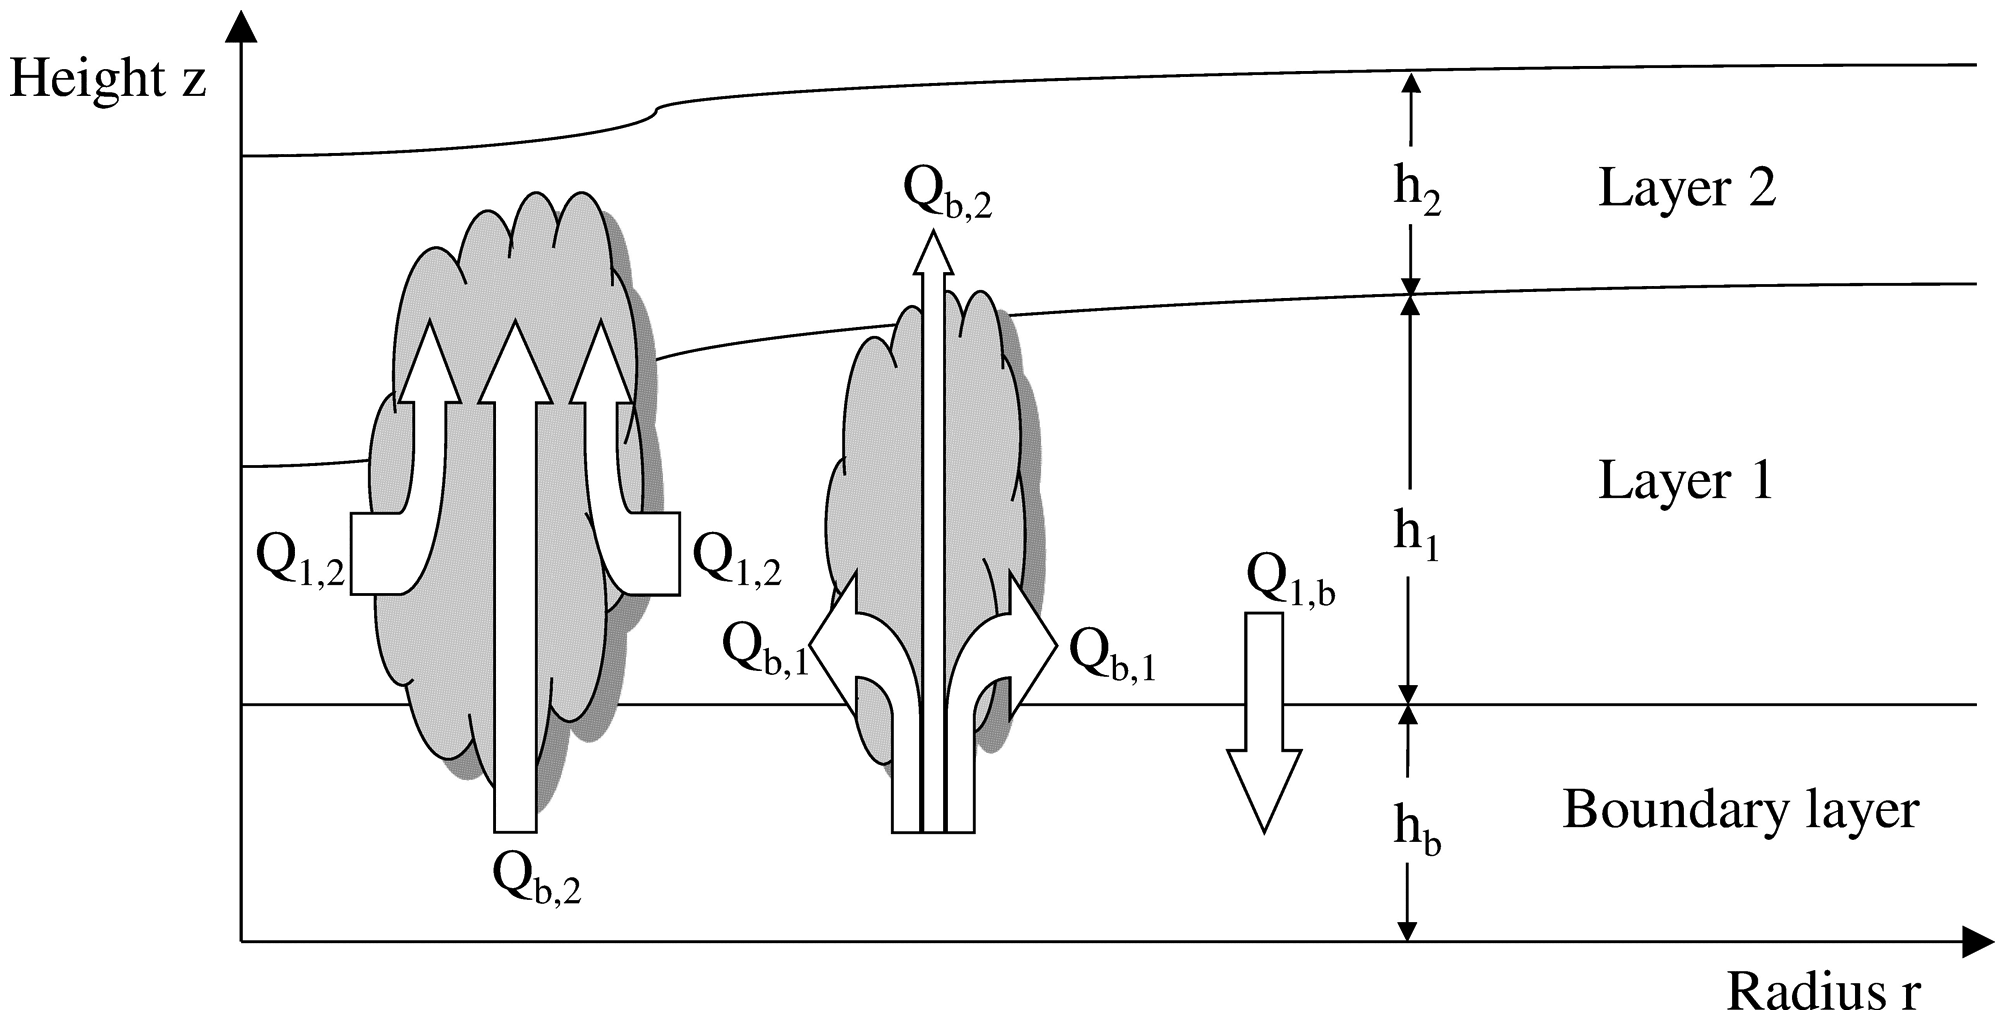
Fig. 6.
Sketch of Ooyama’s three-layer model.
Table 2.
Parameter values for Ooyama model experiment REF.
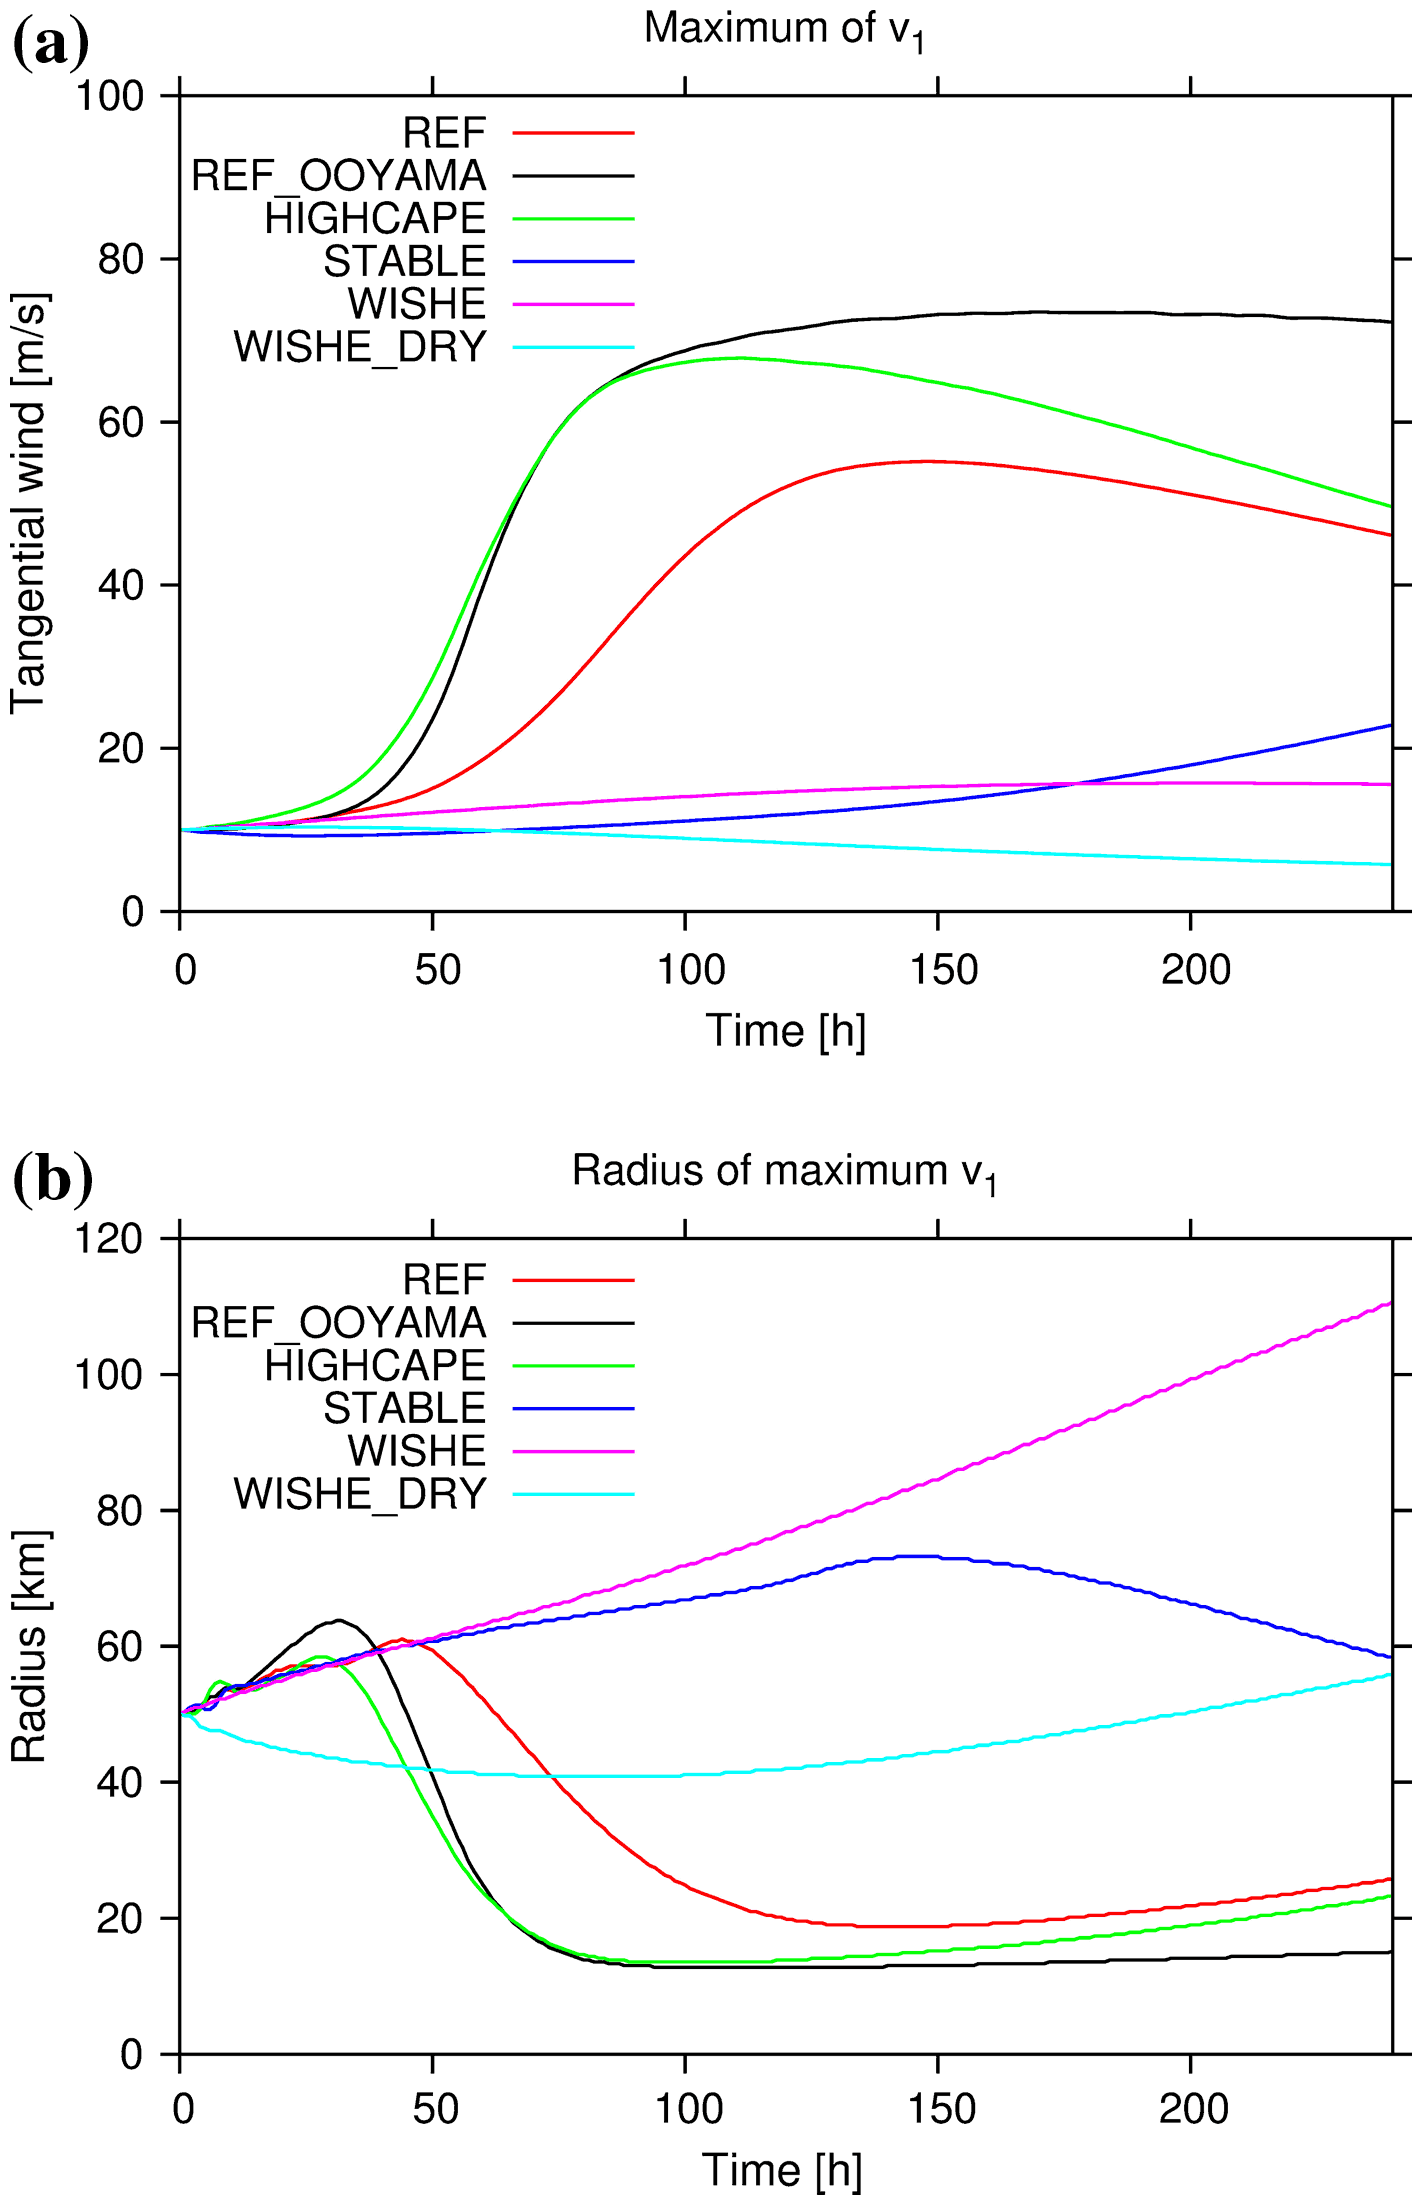
Fig. 7.
(a) Maximum middle layer tangential wind as a function of time for the experiments REF (red curve), REF_OOYAMA (black curve), HIGHCAPE (green curve), STABLE (blue curve), WISHE (magenta curve) and WISHE _DRY (light blue curve). (b) as in (a) but the radius of maximum v1 is shown.
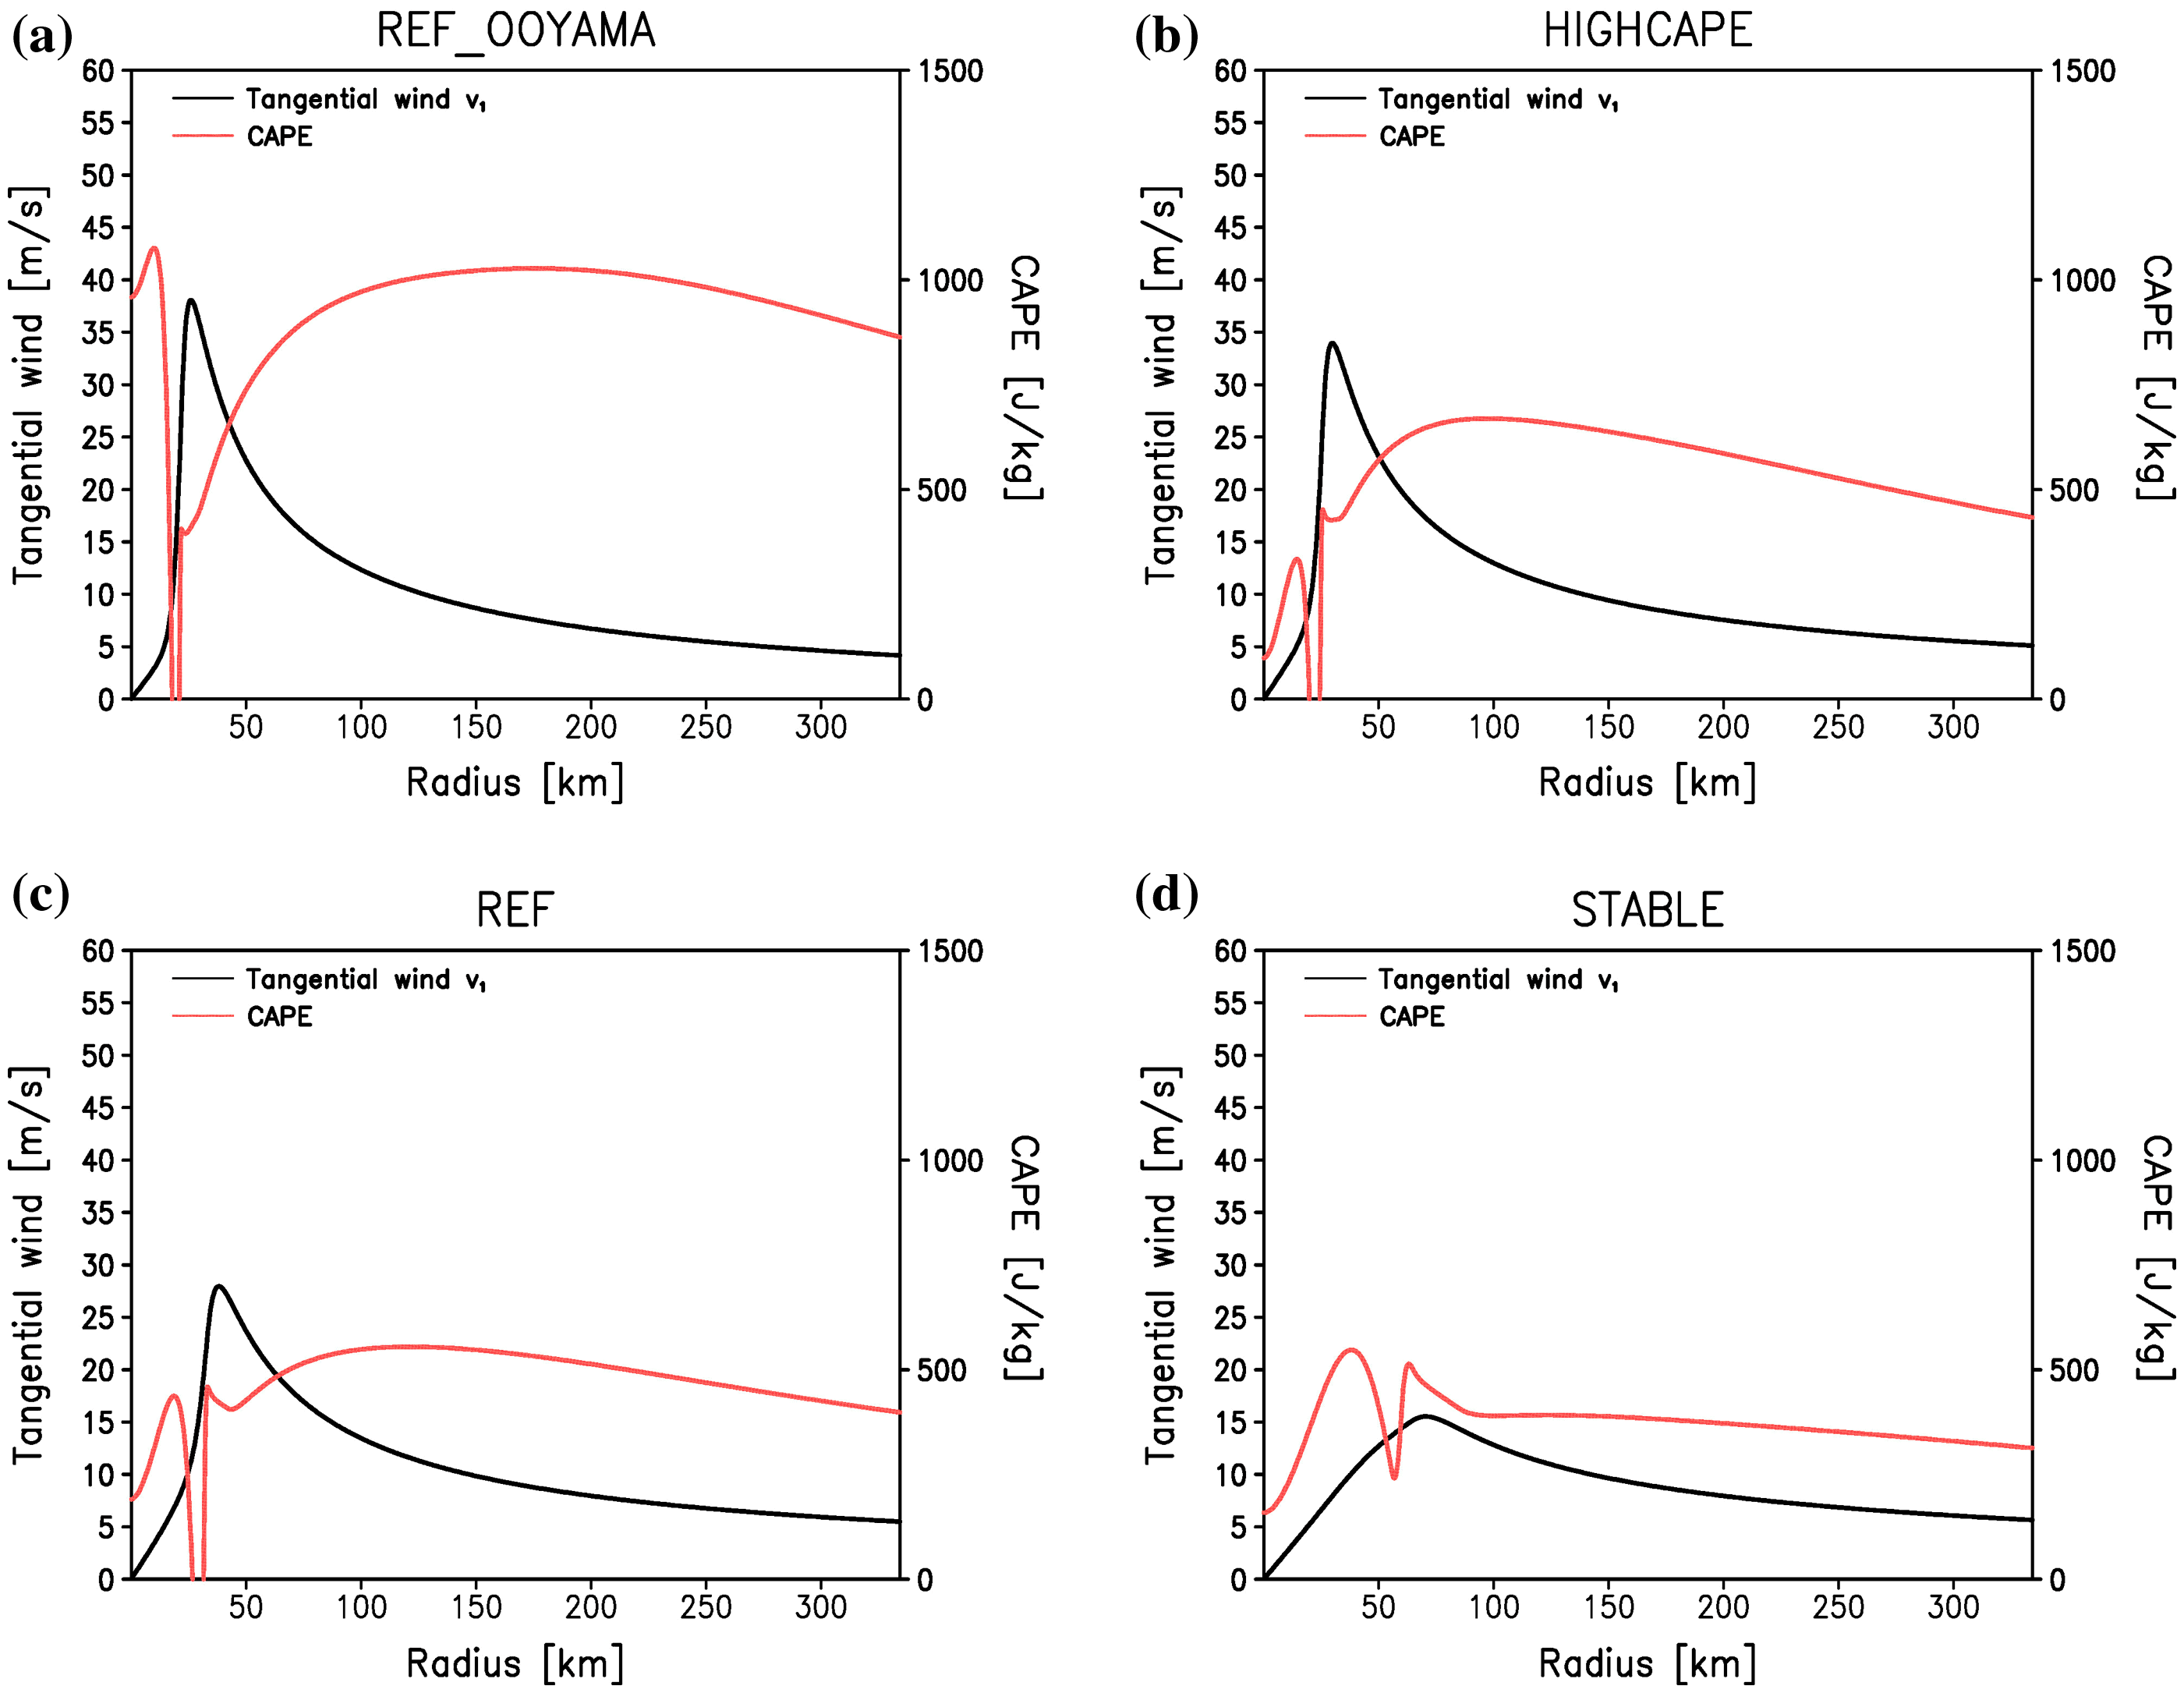
Fig. 8.
Radial profiles of tangential wind v1 (black curve) and CAPE EC,O (red curve) in the Ooyama-model at the time when the intensity reaches 50% of its time maximum for the experiments (a) REF_OOYAMA, (b) HIGHCAPE, (c) REF and (d) STABLE.
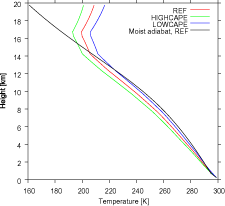
Fig. 9.
Initial vertical temperature profiles for the CM1 experiments REF (red curve), HIGHCAPE (green curve) and LOWCAPE (blue curve). The black curve shows the moist adiabat resulting from the initial condition of experiment REF.
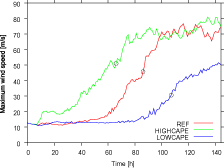
Fig. 10.
Maximum azimuthally averaged wind speed as a function of time for CM1 experiments REF (red curve), HIGHCAPE (green curve) and LOWCAPE (blue curve). The black circles indicate time points representative for the intensification phase. These were selected for the further analysis.
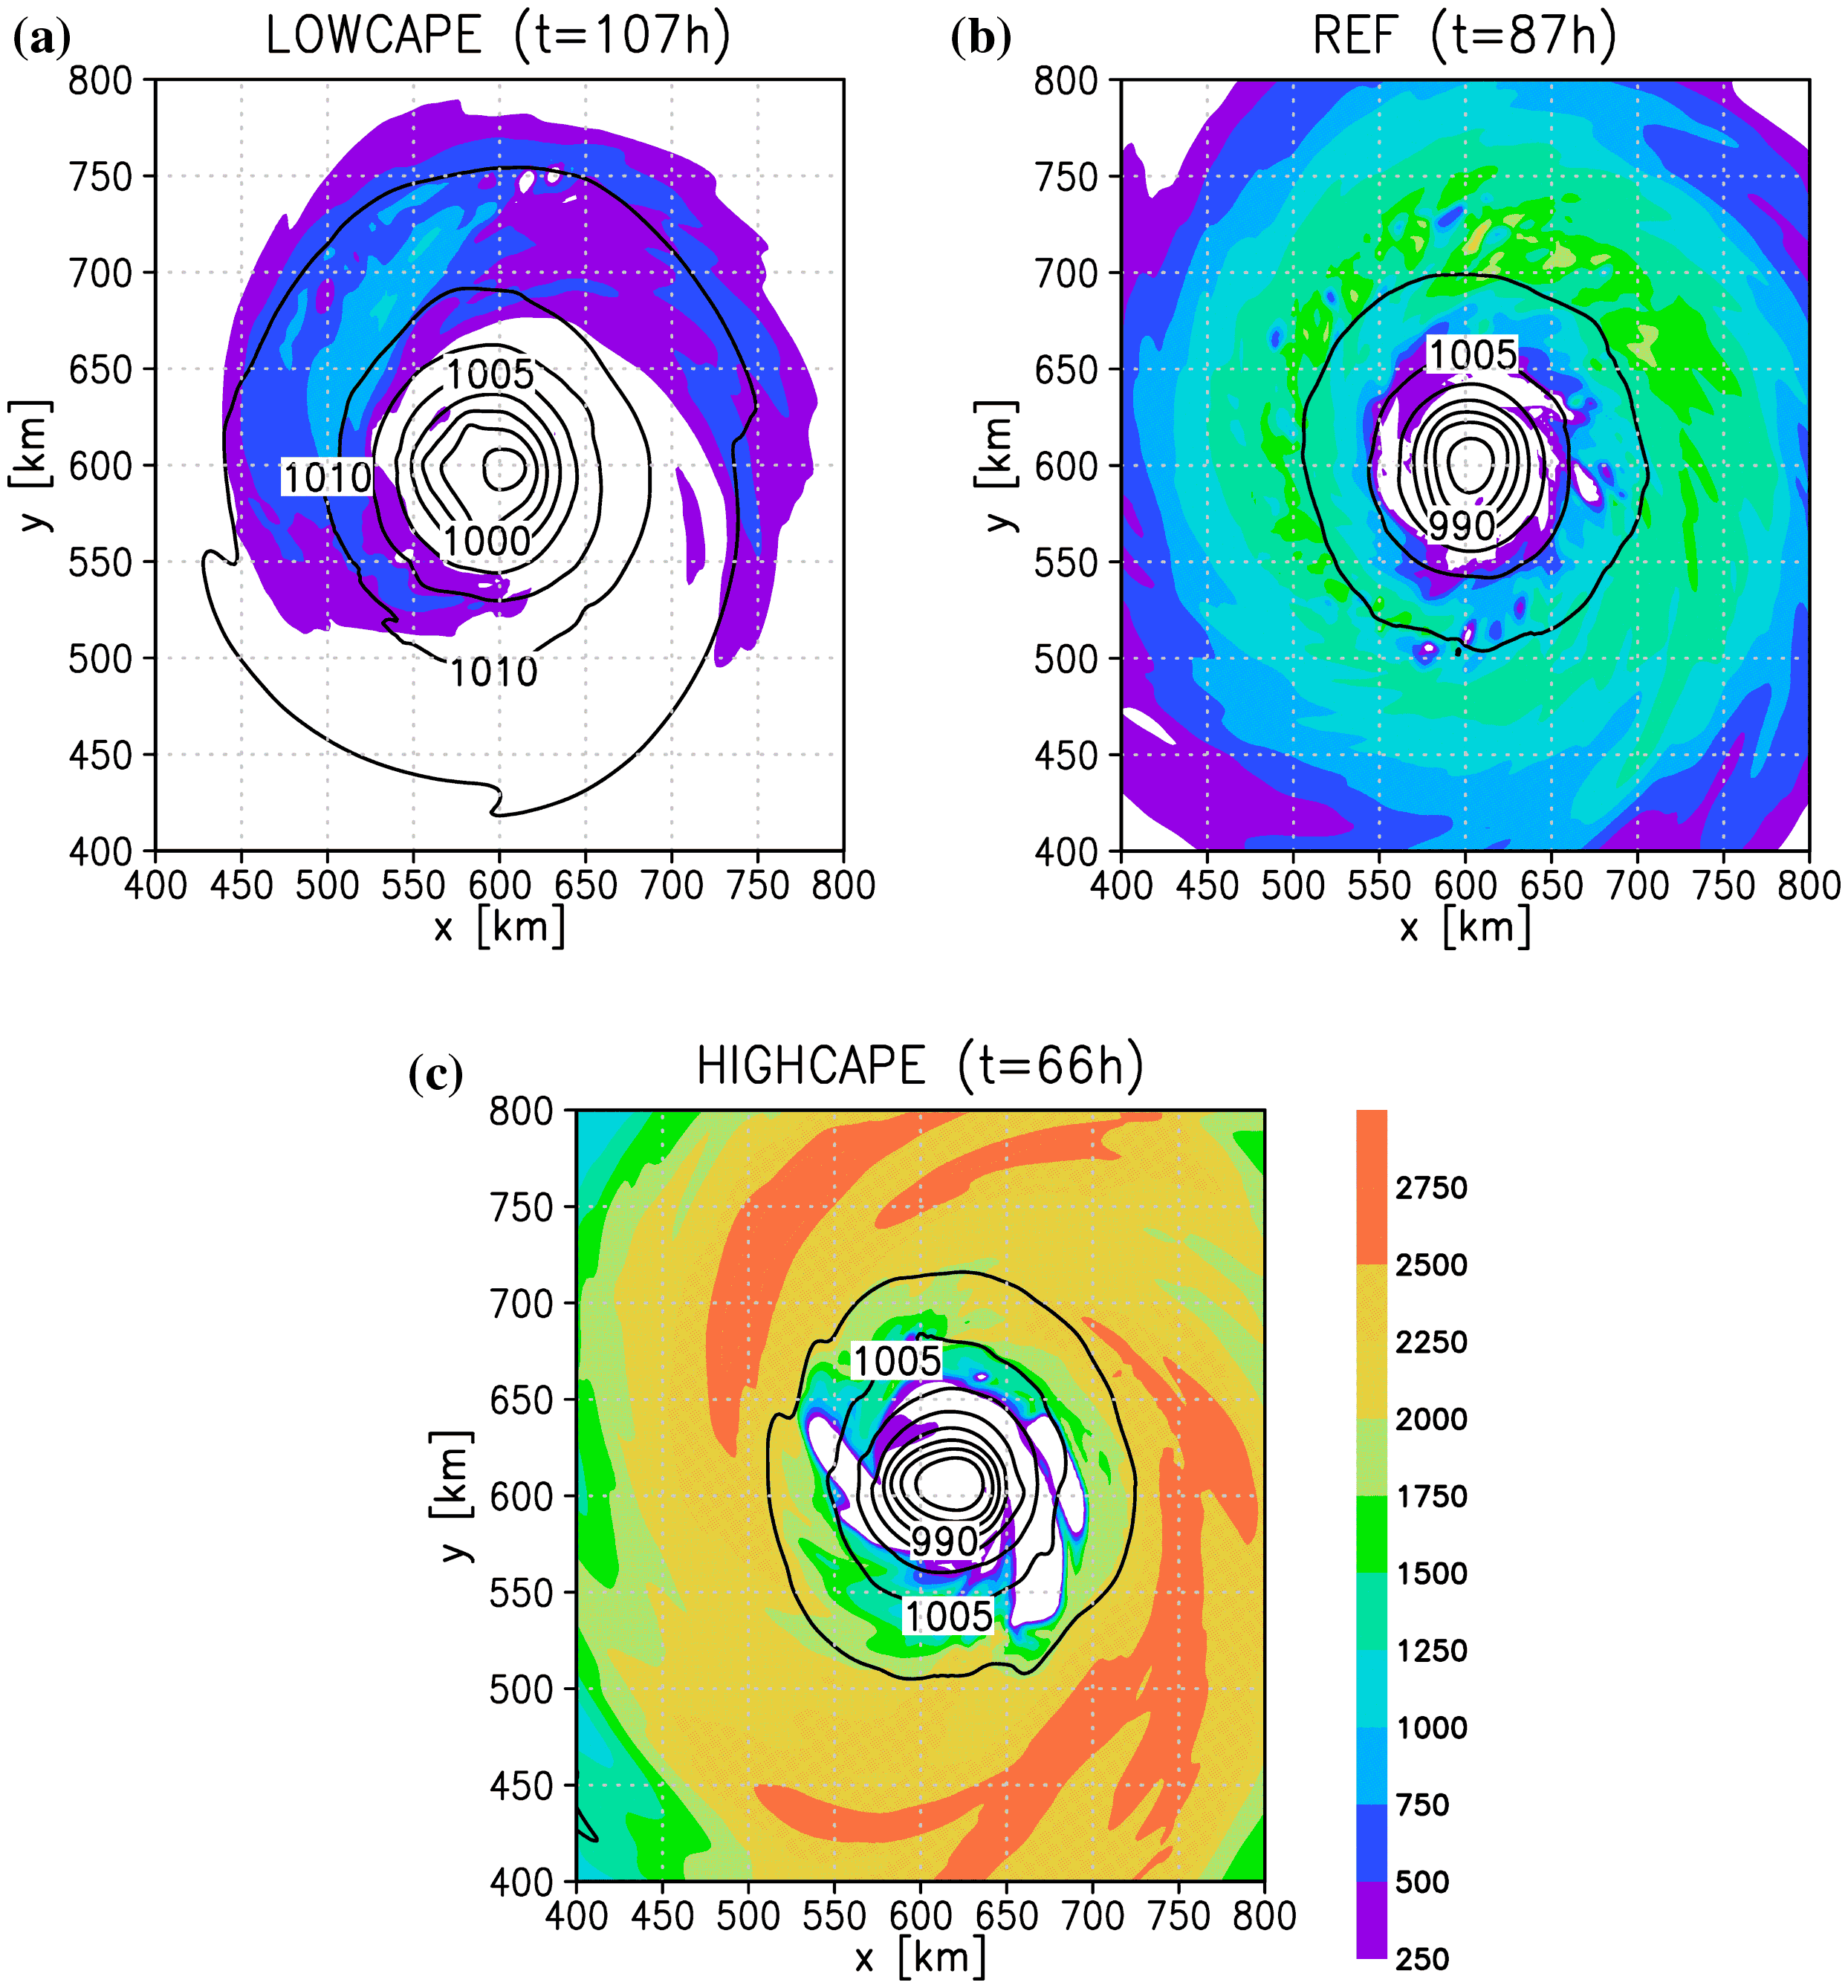
Fig. 11.
CAPE (coloured shadings) and surface pressure (isolines) for (a) experiment LOWCAPE at t = 107 h (contour interval 2.5 hPa), (b) experiment REF at t = 87 h (contour interval 5 hPa) and (c) experiment HIGHCAPE at t = 66 h (contour interval 5 hPa).
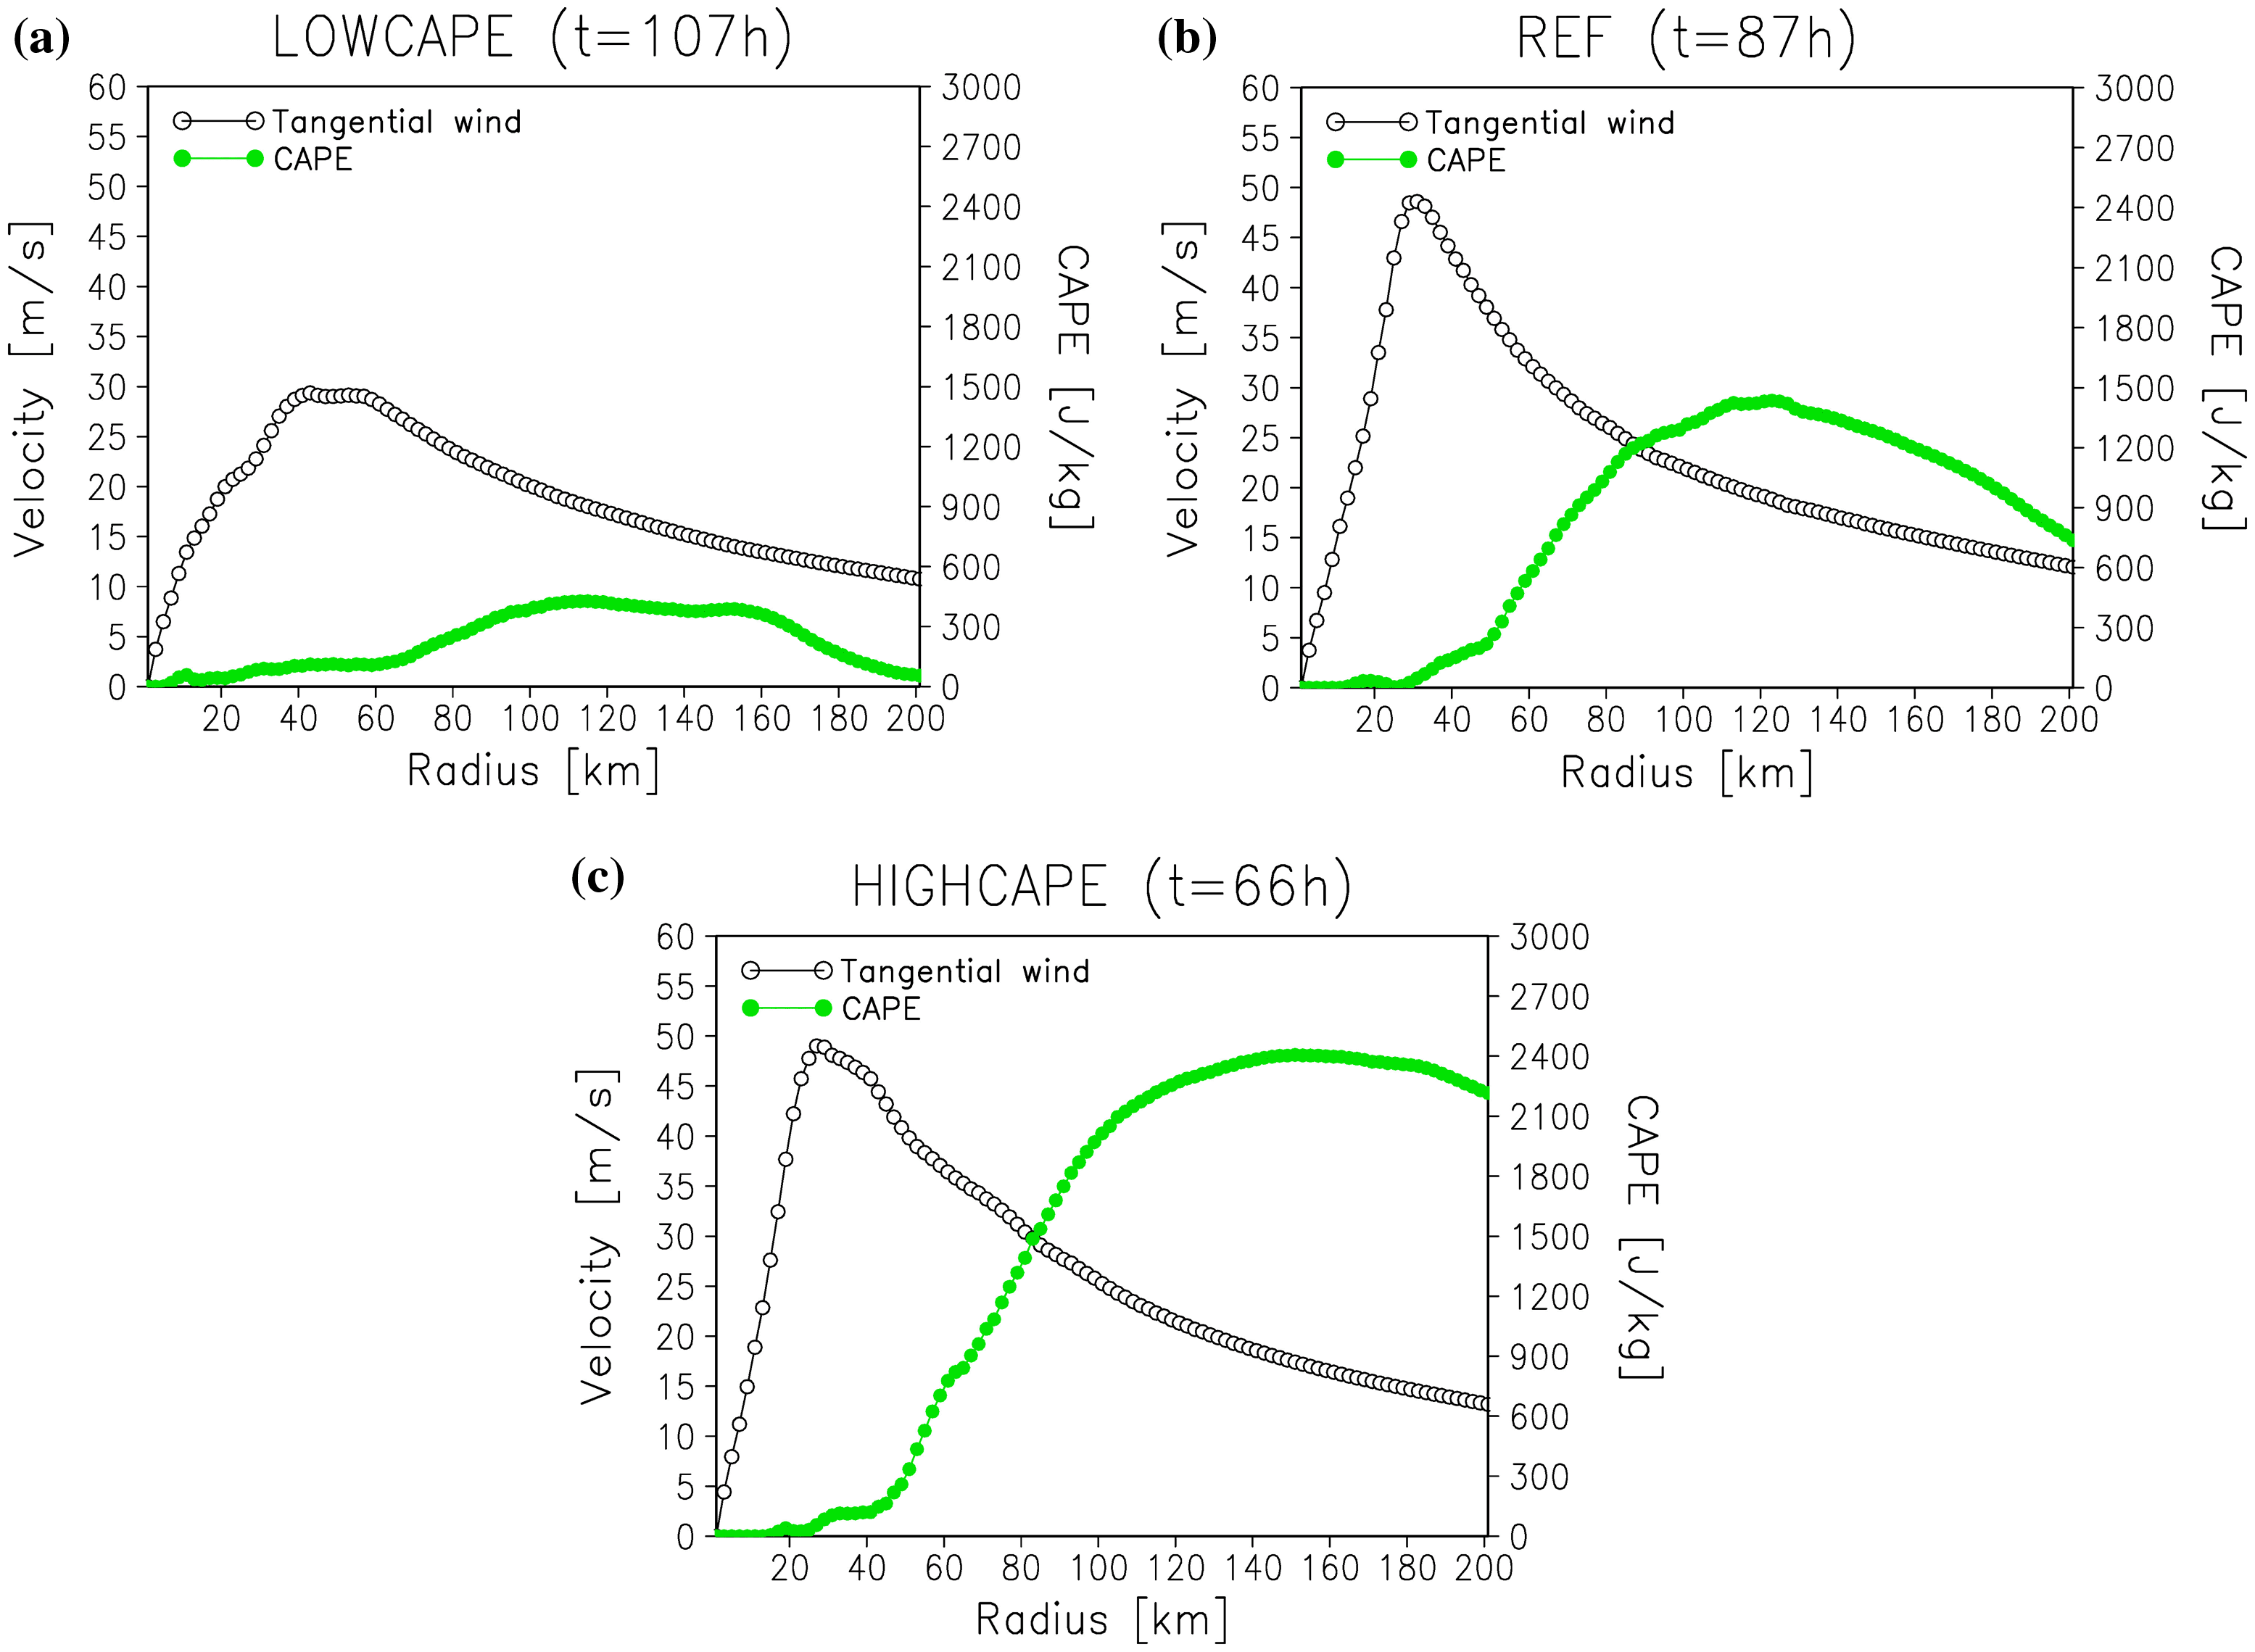
Fig. 12.
Radial profiles of azimuthally averaged tangential wind (black curve) at the level of maximum wind speed (z = 750 m) and CAPE (green curve) for (a) experiment LOWCAPE at t = 107 h, (b) experiment REF at t = 87 h and (c) experiment HIGHCAPE at t = 66 h.
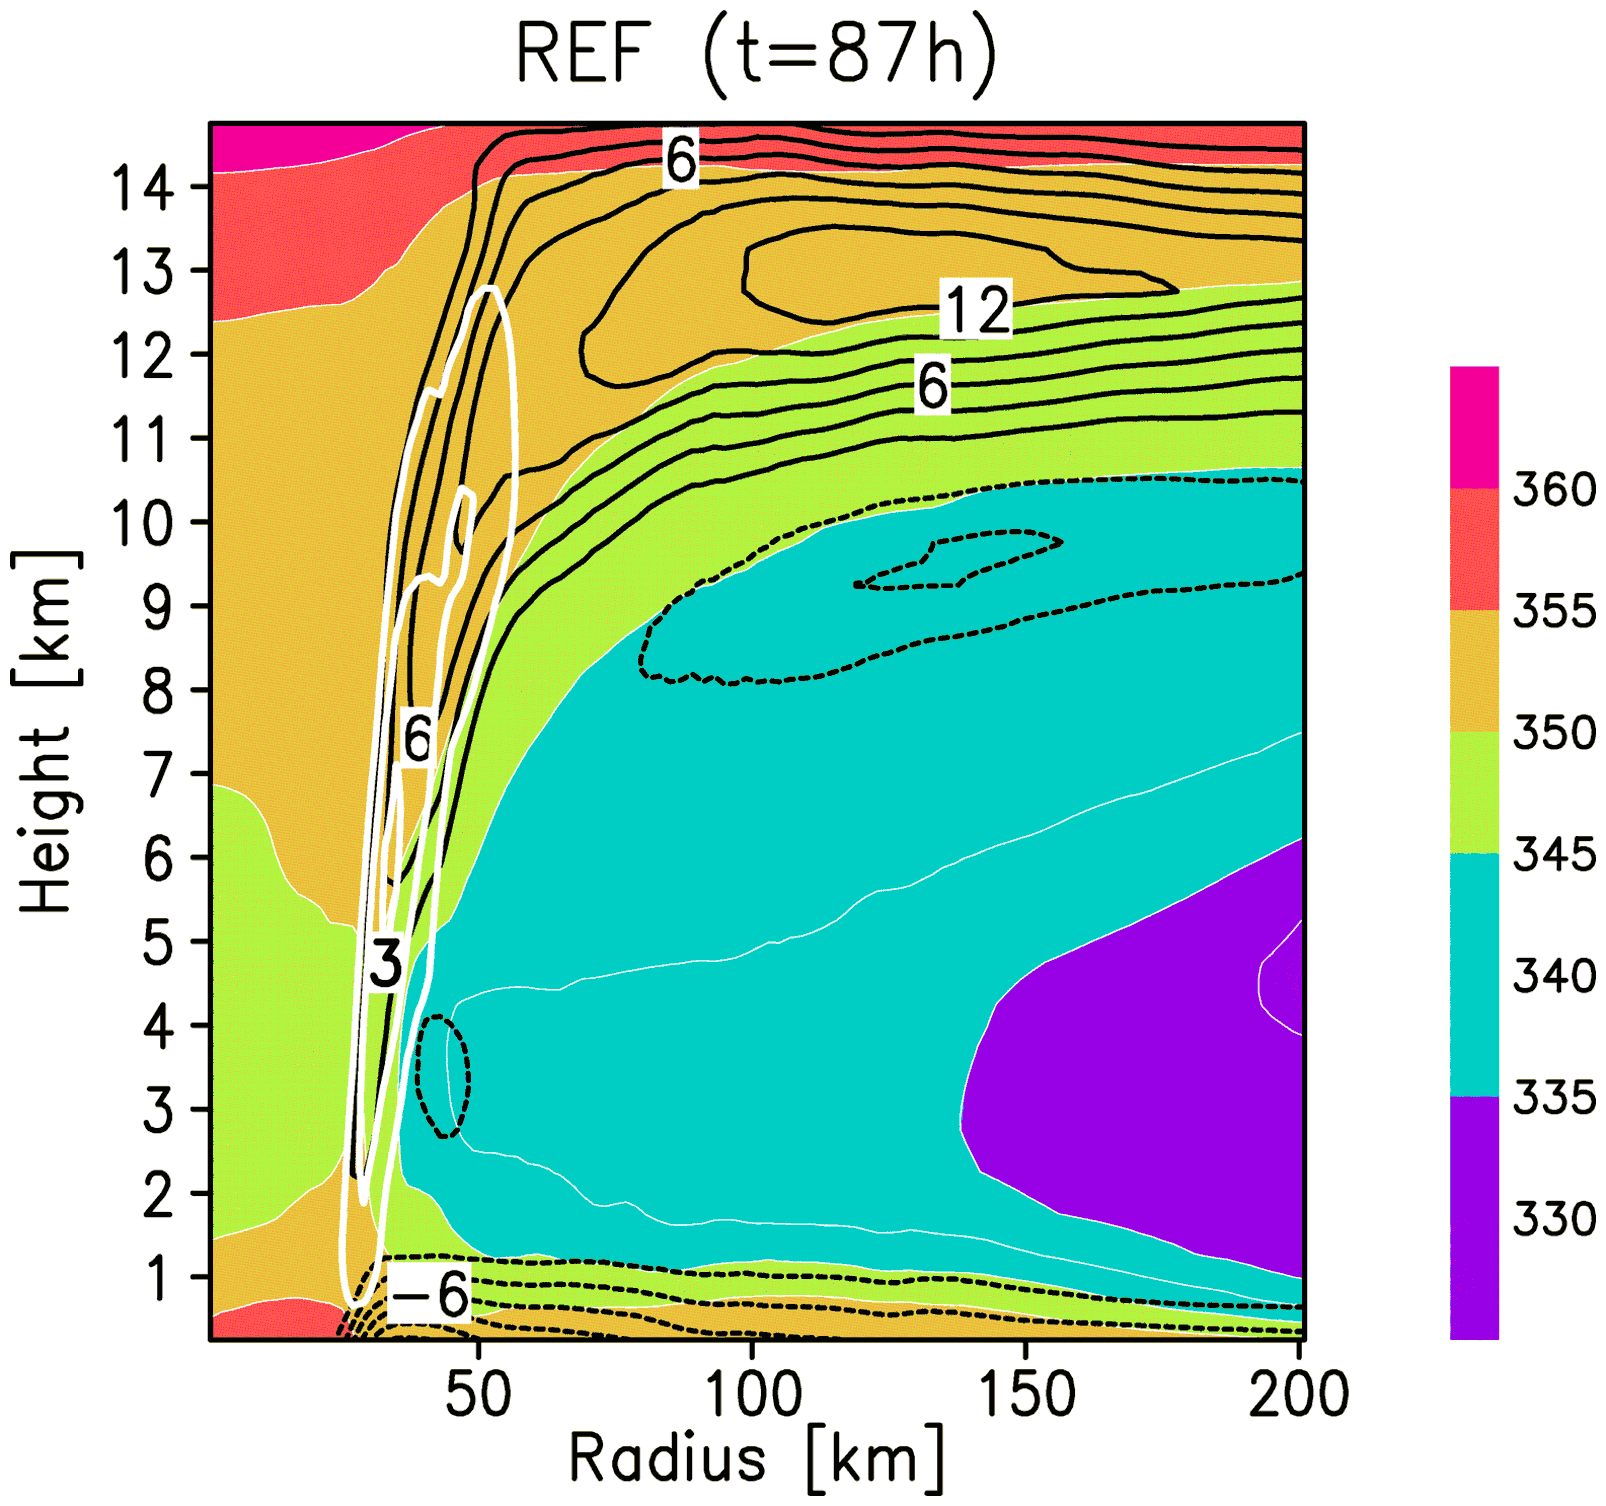
Fig. 13.
Radial cross section of azimuthally averaged EPT (coloured shadings, K), radial wind (black isolines, contour interval 2 m/s) and vertical wind (thick white isolines, contour interval 1 m/s) for CM1 experiment REF at t = 87 h.