
Figure 1
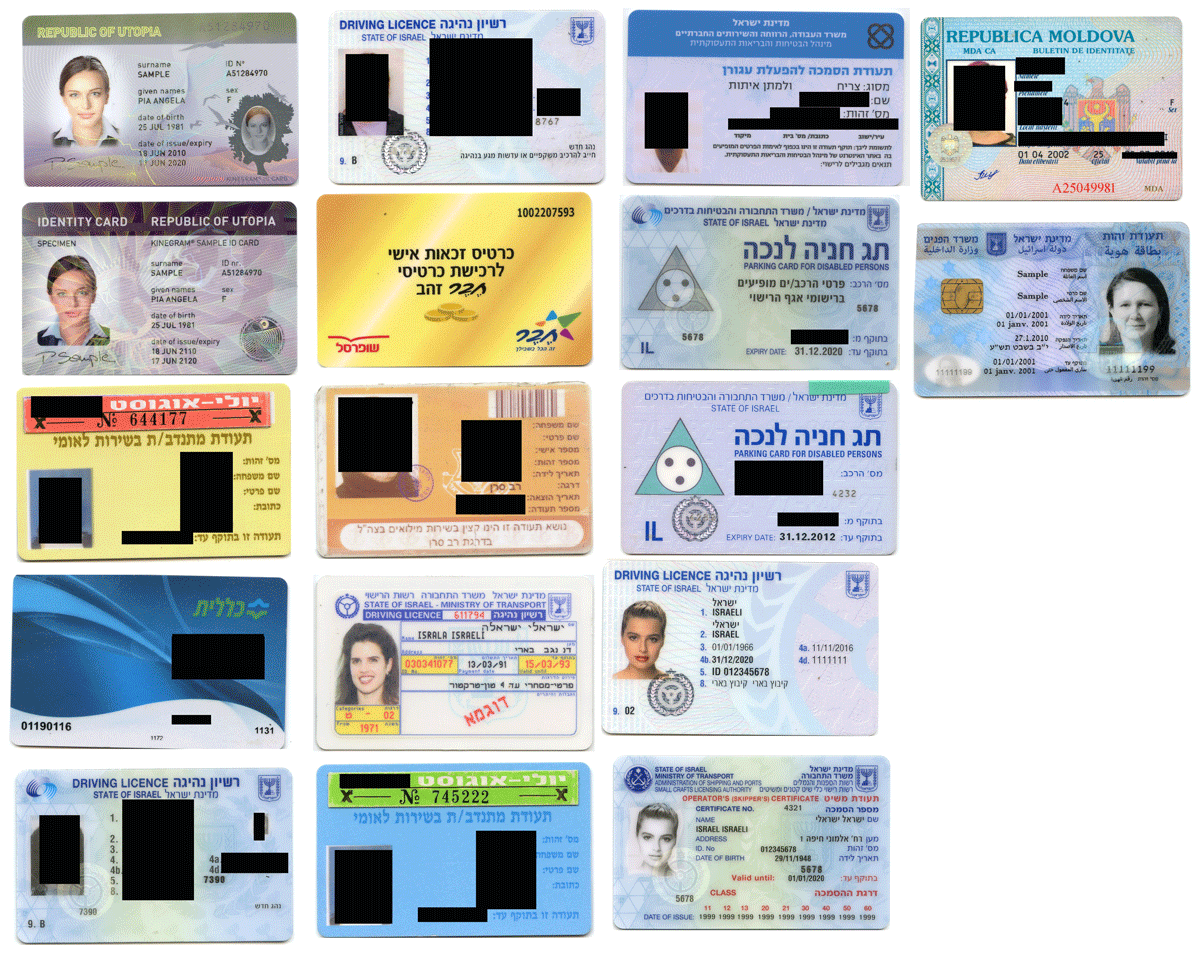
The front side of 17 cards examined.
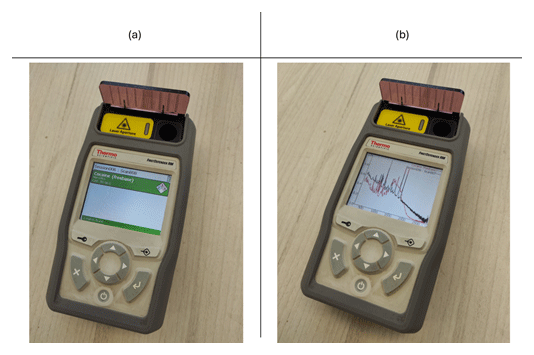
Figure 2
Spectral reading of Cocaine on FirstDefender RM portable instrument. (a) On-screen display of the substances identified, along with the percentage match to the internal spectral libraries. (b) Raman spectra: The black line represents the sample spectra, and the red line represents the reference spectra from the library.
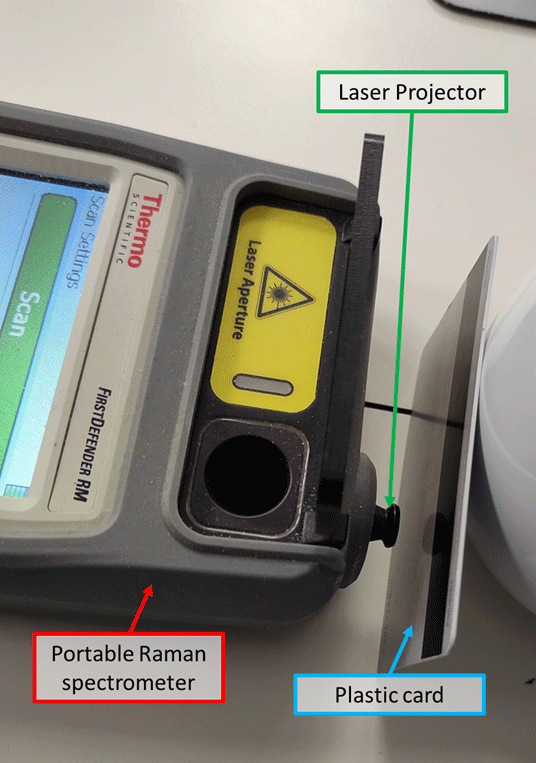
Figure 3
Placement of plastic card in front of FirstDefender RM portable instrument for examination.
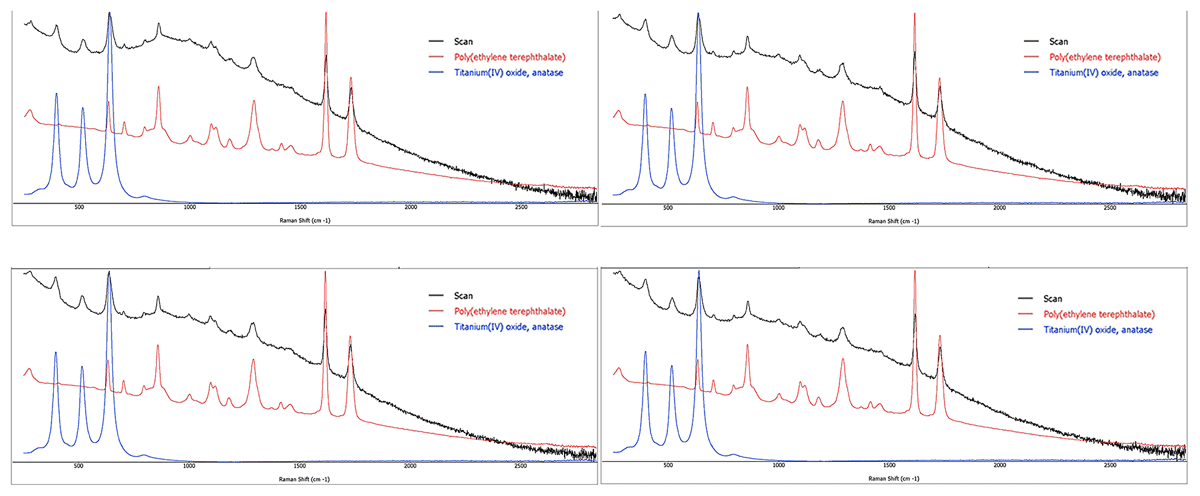
Figure 4
Spectra of card No. 1. Top left readings: 1 from first date, top right reading: 3 from first date. Bottom left readings: 1 from second date, bottom right reading: 2 from second date.
Table 1
Card composition obtained from all reading of all cards.
| POINT # CARD NUMBER | DATE 1 | DATE 2 | ||||
|---|---|---|---|---|---|---|
| I | II | III | I | II | III | |
| 1 | 51% PET 39% TiO2 | 50% PET 41% TiO2 | 50% PET 40% TiO2 | 53% PET 40% TiO2 | 47% PET 40% TiO2 | 46% PET 43% TiO2 |
| 2 | 48% PET 44% TiO2 | 49% PET 44% TiO2 | 50% PET 39% TiO2 | 46% PET 44% TiO2 | 52% PET 41% TiO2 | 46% PET 43% TiO2 |
| 3 | 64% PVC 28% TiO2 | 64% PVC 27% TiO2 | 66% PVC 28% TiO2 | 63% PVC 29% TiO2 | 64% PVC 28% TiO2 | 65% PVC 27% TiO2 |
| 4 | 1 53% Copper (II) Phthalocyanine 26% TiO2 | 2 62% PVC 28% TiO2 | † 61% PVC 26% TiO2 | † 64% PVC 26% TiO2 | * 56% Copper (II) Phthalocyanine 21% TiO2 | † 62% PVC 27% TiO2 |
| 5 | * 53% Copper (II) Phthalocyanine 26% TiO2 | † 64% PVC 27% TiO2 | * 28% Copper (II) Phthalocyanine 41% TiO2 | † 65% PVC 26% TiO2 | * 35% Copper (II) Phthalocyanine 36% TiO2 | * 32% Copper (II) Phthalocyanine 31% Bis (trimethylcelyl) acetylene |
| 6 | 83% PET | 84% PET r | 82% PET | 78% PET | 79% PET | 84% PET |
| 7 | 70% PVC | 71% PVC | 72% PVC-co Vinyl Acetate 14% Paint | 69% PVC | 69% PVC-co Vinyl Acetate 17% Paint | 68% PVC |
| 8 | 47% PVC-co Vinyl Acetate 35% Paint | 48% PVC-co Vinyl Acetate 35% Paint | 45% PVC-co Vinyl Acetate 35% Paint | 49% PVC-co Vinyl Acetate 32% Paint | 47% PVC-co Vinyl Acetate 30% Paint | 45% PVC-co Vinyl Acetate 35% Paint |
| 9 | 81% PET | 81% PET | 83% PET | 82% PET | 80% PET | 79% PET |
| 10 | 71% PET | 78% PET | 82% PET | 78% PET | 80% PET | 81% PET |
| 11 | 82% PET | 86% PET | 82% PET | 82% PET | 83% PET | 82% PET |
| 12 | 85% PC r | 87% PC | 84% PC | 87% PC | 83% PC | 85% PC |
| 13 | 82% PET | 70% PET | Unmatched reading | 81% PET | 81% PET | 76% PET |
| 14 | 60% PVC-co Vinyl Acetate 25% CaCO3 | 61% PVC-co Vinyl Acetate 26% CaCO3 | 63% PVC-co Vinyl Acetate 24% CaCO3 | 62% PVC-co Vinyl Acetate 25% CaCO3 | 61% PVC 27% CaCO3 | 60% PVC-co Vinyl Acetate 24% CaCO3 |
| 15 | 86% PC | 86% PC | 82% PC 12% CaCO3 | 88% PC | 86% PC | 81% PC 13% CaCO3 |
| 16 | 85% PC | 86% PC | 81% PC 12% Paint | 84% PC | 86% PC | 82% PC 13% TiO2 |
| 17 | 84% PC | 84% PC | 82% PC 13% Paint | 84% PC | 83% PC | 80% PC 13% TiO2 |
[i] * Multicolored background.
† White background.
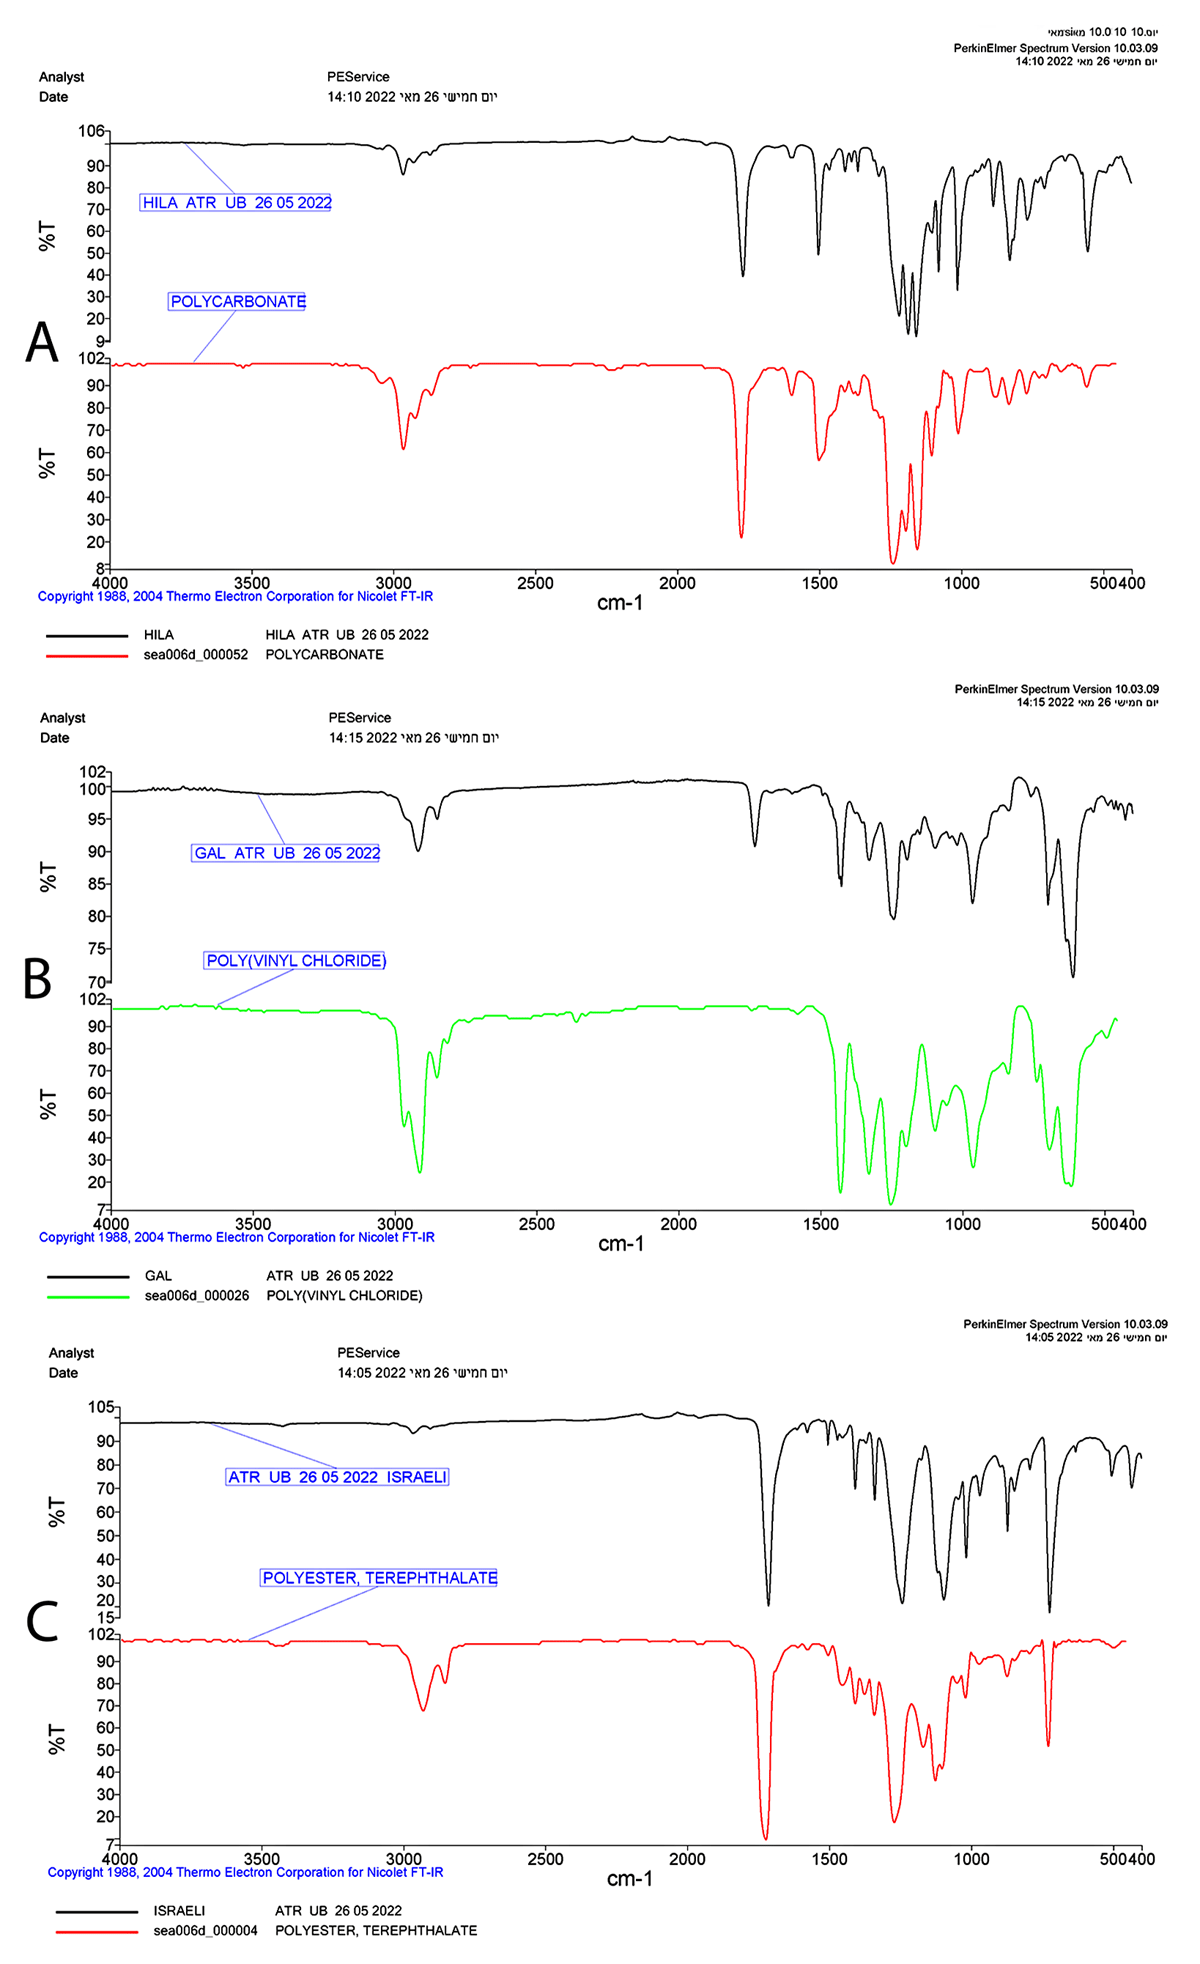
Figure 5
ATR results of cards 17, 12, 9. Black line represents the sample spectra, and the colorful line represents the reference.
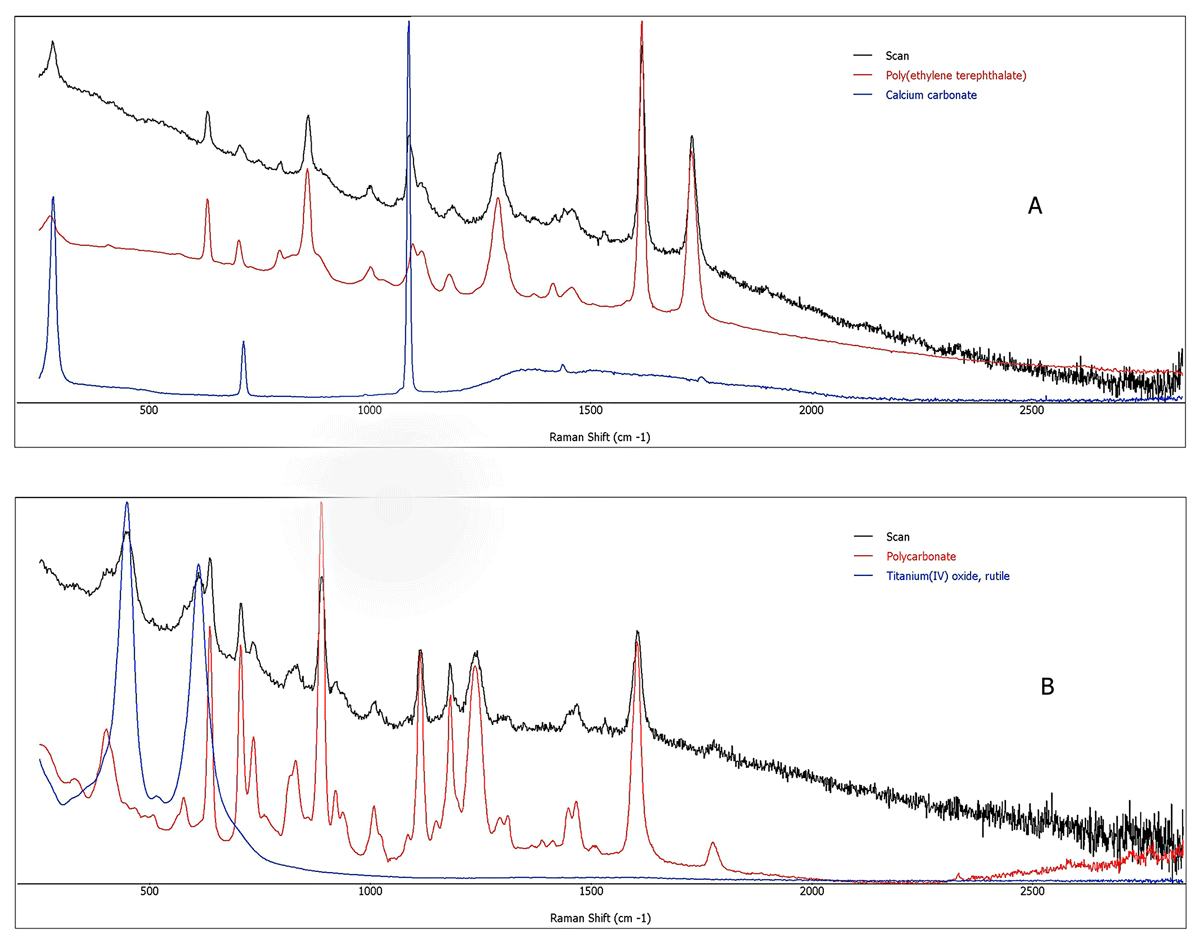
Figure 6
(a) Raman spectra of counterfeit ID card. (b) Raman spectra of specimen ID card.