
Introduction
Security documents have traditionally been printed on paper that included security features, such as watermarks and security fibers. The printing was performed on the paper surface using various printing methods and contained more features, such as optically variable ink (OVI), rainbow printing, UV/IR printing, etc. Additional external features were added, such as specified threads, holograms, foils, and more. The purpose of all of these features is to reduce the ease of counterfeit and protect the documents from fraud. As technology advanced, plastic became more popular and was introduced to the field of security documents due to its durability. Polycarbonate (PC) is becoming more commonly used for security documents such as passport data page, ID documents, and drivers’ licenses (1). Current technology enables the production of multilayer PC cards, which revolutionized the approach to security documents. By engineering the different layers with unique characteristics and adding various security and digital features in between the layers, the PC cards are highly protected against simple counterfeiting. These advancements lead the criminal world to improve their forgery technologies as well. Due to Increasingly sophisticated attempts to counterfeit these documents, it is necessary to advance the methods to identify these counterfeits.
Many analytical methods were developed to examine inks and printing methods, security features (2), or even the paper of security documents, but very few methods were published for identifying polymer substrates (3), and none specifically for PC.
Raman spectroscopy is commonly used in chemistry to provide a highly variable spectrum enabling molecule characterization. Raman spectroscopy’s greatest strength is in its ability to rapidly provide a representative of the chemical structure of an unknown material. This spectrum can be used for identification with high chemical specificity (4), and may be applied to solids, liquids, and gases.
Raman is a well-known method in questioned documents examination as well (5). It may assist in determining the sequence of intersecting lines (6), identification of pen inks (7), inkjet inks (8, 9, 10), toners (11), stamp inks (12), paper (13), and even for determining ink age (14, 15).
In the forensic questioned documents laboratory, there is a large selection of optical and chemical instrumentation, which can be used to examine suspected fake documents. It is recommended to send documents to the laboratory after first-line examination is performed and an indication is received that the document is counterfeit. Manufacturing of layered PC cards is currently expensive and requires advanced manufacturing procedures. Therefore, unsophisticated forgers may prefer to use other cheaper polymers. Hence, identifying the polymer composition of the questioned security document may assist to single out counterfeit security cards. This is merely one of the features of security documents, but it can give a strong indication of a forged document.
Portable or handheld Raman instruments were developed and originally intended for deployment as in-field detectors for the analysis of unknown materials without a full lab setting (16). The portable Raman spectrometer is very useful in environmental studies, agriculture (16), and mineral samples (17, 18).
In the forensic science context, the portable Raman spectrometer is reported as a first-line examination for unknown or dangerous chemicals, such as explosives (19), drugs (20), pharmaceuticals, and poisons (4, 16, 18).
In this paper, we suggest a method to identify the polymer content of cards using portable Raman spectroscopy, and hence, take advantage of an instrument that exists in many airports and is used by field agents as a first-line examination for other purposes, as explained above.
Methods
Twenty-five plastic cards of various types including an ID, driver’s license, transit pass, credit card, etc. were examined using Raman spectroscopy.
Thermo Fisher Scientific© FirstDefender RM portable instrument, which measures the inelastic scattering of monochromatic light from an infrared laser source, was used for the measurements. This instrument has a class IIIB laser with an excitation wavelength of 785 nm. The laser source runs in auto-exposure and auto-accumulation mode, with a resolution of 7 to 10.5 cm–1 FWHM across its range. The instrument (0.8 kg) is equipped with a rechargeable internal lithium-ion battery, allowing practically about four hours of measurements in the field. The instrument records Raman spectra over the wavenumber range of 250–2875 cm–1. The device displays on-screen the names of the substances it has identified, along with the percentage match to its internal spectral libraries. The resulting Raman spectrum can be exported as an image. A single spectrum is produced, representing a superposition of Raman scattering signals from all substances detected in the sample. Additionally, the device displays reference spectra from its library in different colors, indicating the individual components contributing to the overall signal (Figure 2). The device includes the built-in Thermo Scientific master spectral library, which allows the local addition of new reference materials spectra.
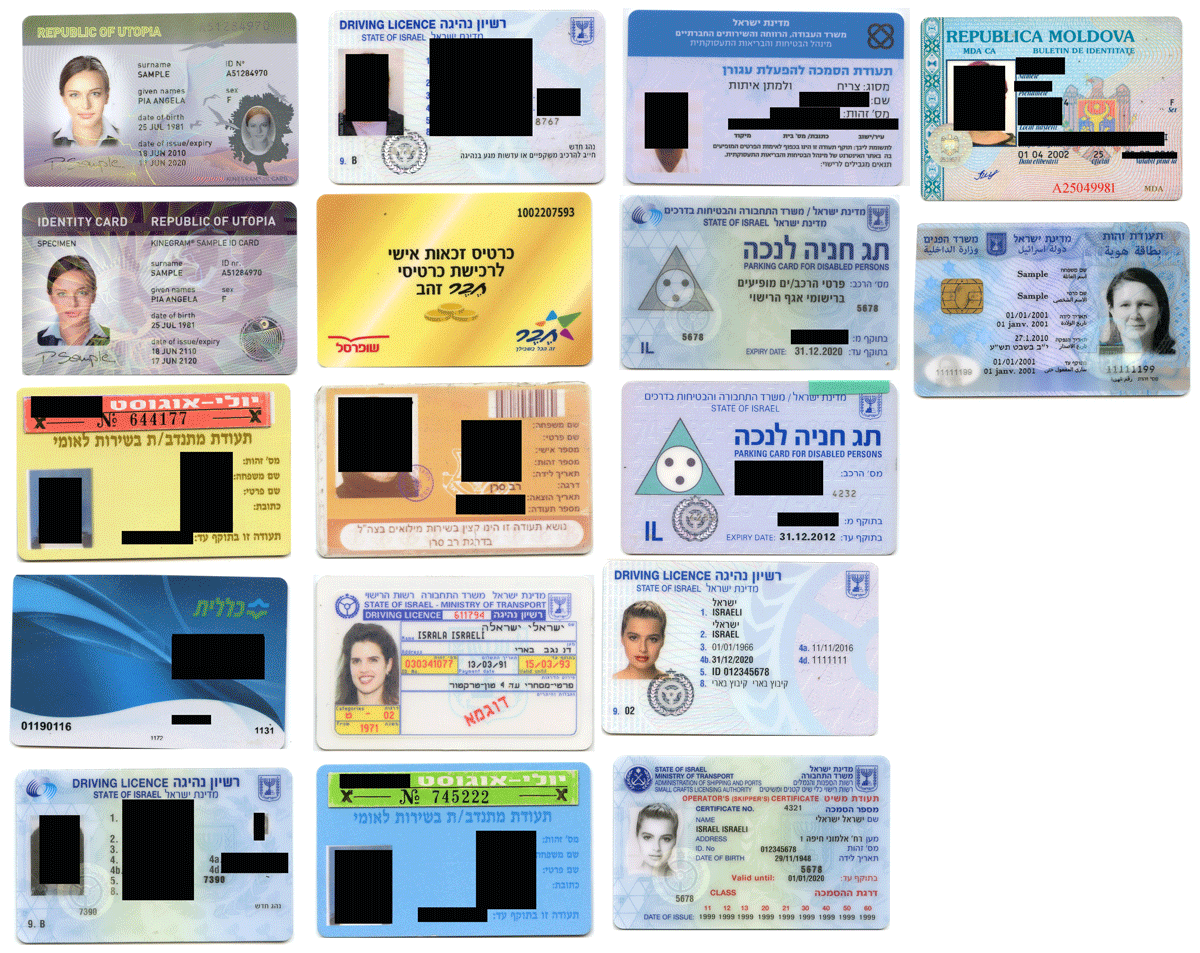
Figure 1
The front side of 17 cards examined.
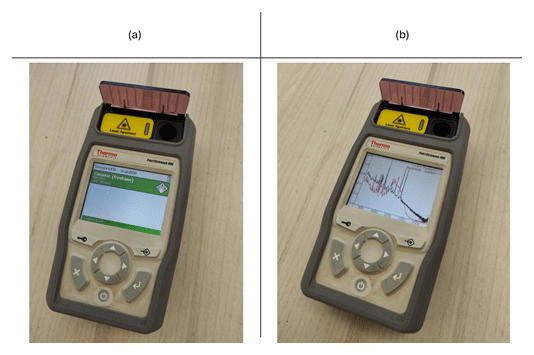
Figure 2
Spectral reading of Cocaine on FirstDefender RM portable instrument. (a) On-screen display of the substances identified, along with the percentage match to the internal spectral libraries. (b) Raman spectra: The black line represents the sample spectra, and the red line represents the reference spectra from the library.
The Thermo Fisher Scientific© FirstDefender RM portable instrument, using a laser with 785 nm excitation wavelength, was chosen because it is commonly used in many field units we have worked with. The wavelength was also found to be well-suited for the analysis of organic materials, offering a favorable balance between fluorescence suppression, Raman scattering intensity, and material identification capability.
The portable Raman spectrometer was placed with the laser projector approximately one centimeter above the card surface (Figure 3).
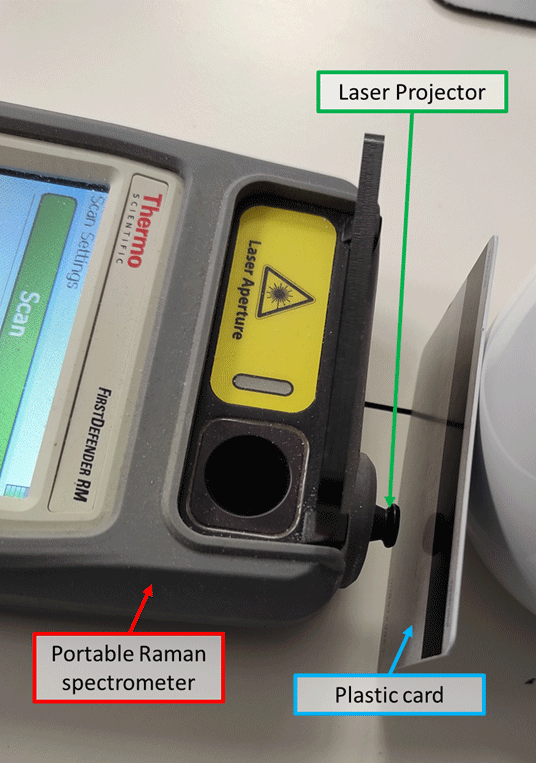
Figure 3
Placement of plastic card in front of FirstDefender RM portable instrument for examination.
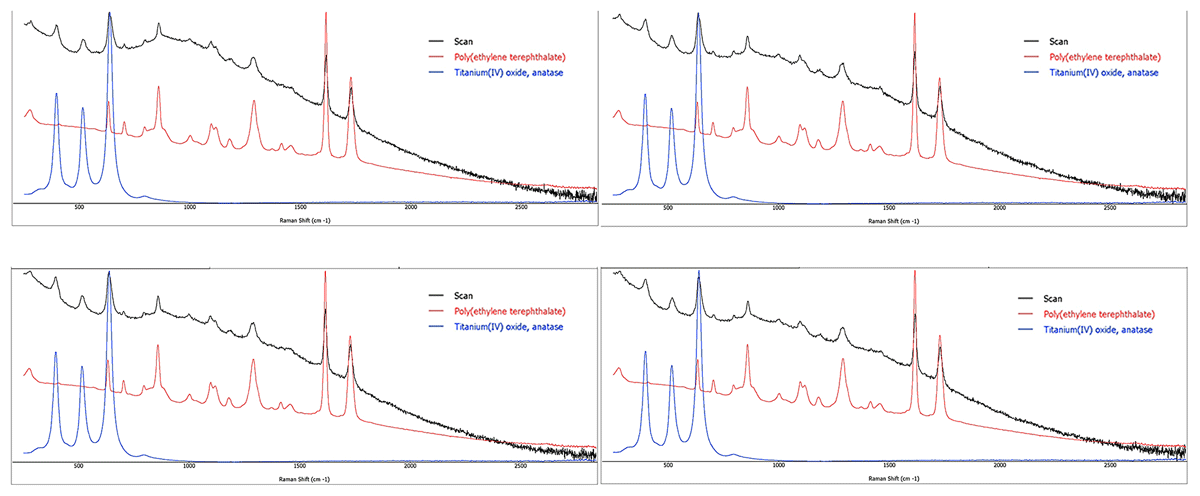
Figure 4
Spectra of card No. 1. Top left readings: 1 from first date, top right reading: 3 from first date. Bottom left readings: 1 from second date, bottom right reading: 2 from second date.
Each card was examined on three random sampling points: two on the front of the card and one on the back. This procedure was repeated twice on two different occasions.
The results were presented on the screen as a verbal identification accompanied by the Raman spectrum. The compound identification is based on the inbuilt Thermo Fisher library programmed on the FirstDefender RM portable instrument. The library includes polymers, explosives, toxic industrial chemicals, chemical warfare agents, narcotics, precursors, white powders, and more. Other organic compounds can be added manually by the user. The image of the measured spectrum and the reference spectrum as well as the raw data can be exported as a file from the memory card of the instrument.
The results were then verified using Fourier transform infrared (FTIR) spectroscopy (FTIR-ATR). The FTIR method was chosen in order to obtain the composition based on two independent methods (ref SWGDRUG). Both Raman and FTIR are classified as A-category identification methods. The FTIR spectrometer was equipped with an UATR (Spectrum Two, PerkinElmer, Waltham, MA) and was measured at wavelengths of 400 to 4000 cm–1. The spectrum was recorded with eight scans, at 25°C; a spectral resolution of 4 cm–1 was obtained.
Results
The measuring time was very rapid—approximately 30 seconds—and some results were even obtained as fast as 10 seconds after beginning the measurement.
Fluorescent-colored cards, metallic-colored cards, black cards, and transparent areas did not produce a useful Raman spectrum, even after one minute of measuring. This is due to the strong fluorescence in the NIR of dark and metallic colors. As for the 17 remaining cards (Figure 1), the readings were selective and characterized the card’s material. Figure 4 shows four spectra obtained from card No. 1. The results presented in Table 1 showed repeatability in the different sampling points and on varying dates. Components read by the Raman as under 10% could not be verified and were not mentioned in the table containing the results.
Table 1
Card composition obtained from all reading of all cards.
| POINT # CARD NUMBER | DATE 1 | DATE 2 | ||||
|---|---|---|---|---|---|---|
| I | II | III | I | II | III | |
| 1 | 51% PET 39% TiO2 | 50% PET 41% TiO2 | 50% PET 40% TiO2 | 53% PET 40% TiO2 | 47% PET 40% TiO2 | 46% PET 43% TiO2 |
| 2 | 48% PET 44% TiO2 | 49% PET 44% TiO2 | 50% PET 39% TiO2 | 46% PET 44% TiO2 | 52% PET 41% TiO2 | 46% PET 43% TiO2 |
| 3 | 64% PVC 28% TiO2 | 64% PVC 27% TiO2 | 66% PVC 28% TiO2 | 63% PVC 29% TiO2 | 64% PVC 28% TiO2 | 65% PVC 27% TiO2 |
| 4 | 1 53% Copper (II) Phthalocyanine 26% TiO2 | 2 62% PVC 28% TiO2 | † 61% PVC 26% TiO2 | † 64% PVC 26% TiO2 | * 56% Copper (II) Phthalocyanine 21% TiO2 | † 62% PVC 27% TiO2 |
| 5 | * 53% Copper (II) Phthalocyanine 26% TiO2 | † 64% PVC 27% TiO2 | * 28% Copper (II) Phthalocyanine 41% TiO2 | † 65% PVC 26% TiO2 | * 35% Copper (II) Phthalocyanine 36% TiO2 | * 32% Copper (II) Phthalocyanine 31% Bis (trimethylcelyl) acetylene |
| 6 | 83% PET | 84% PET r | 82% PET | 78% PET | 79% PET | 84% PET |
| 7 | 70% PVC | 71% PVC | 72% PVC-co Vinyl Acetate 14% Paint | 69% PVC | 69% PVC-co Vinyl Acetate 17% Paint | 68% PVC |
| 8 | 47% PVC-co Vinyl Acetate 35% Paint | 48% PVC-co Vinyl Acetate 35% Paint | 45% PVC-co Vinyl Acetate 35% Paint | 49% PVC-co Vinyl Acetate 32% Paint | 47% PVC-co Vinyl Acetate 30% Paint | 45% PVC-co Vinyl Acetate 35% Paint |
| 9 | 81% PET | 81% PET | 83% PET | 82% PET | 80% PET | 79% PET |
| 10 | 71% PET | 78% PET | 82% PET | 78% PET | 80% PET | 81% PET |
| 11 | 82% PET | 86% PET | 82% PET | 82% PET | 83% PET | 82% PET |
| 12 | 85% PC r | 87% PC | 84% PC | 87% PC | 83% PC | 85% PC |
| 13 | 82% PET | 70% PET | Unmatched reading | 81% PET | 81% PET | 76% PET |
| 14 | 60% PVC-co Vinyl Acetate 25% CaCO3 | 61% PVC-co Vinyl Acetate 26% CaCO3 | 63% PVC-co Vinyl Acetate 24% CaCO3 | 62% PVC-co Vinyl Acetate 25% CaCO3 | 61% PVC 27% CaCO3 | 60% PVC-co Vinyl Acetate 24% CaCO3 |
| 15 | 86% PC | 86% PC | 82% PC 12% CaCO3 | 88% PC | 86% PC | 81% PC 13% CaCO3 |
| 16 | 85% PC | 86% PC | 81% PC 12% Paint | 84% PC | 86% PC | 82% PC 13% TiO2 |
| 17 | 84% PC | 84% PC | 82% PC 13% Paint | 84% PC | 83% PC | 80% PC 13% TiO2 |
[i] * Multicolored background.
† White background.
Verification with FTIR_ATR displayed the same polymer composition as the Raman results (Figure 5). The FTIR merely identified the substrate polymer, unlike the Raman, which identified other components as well.
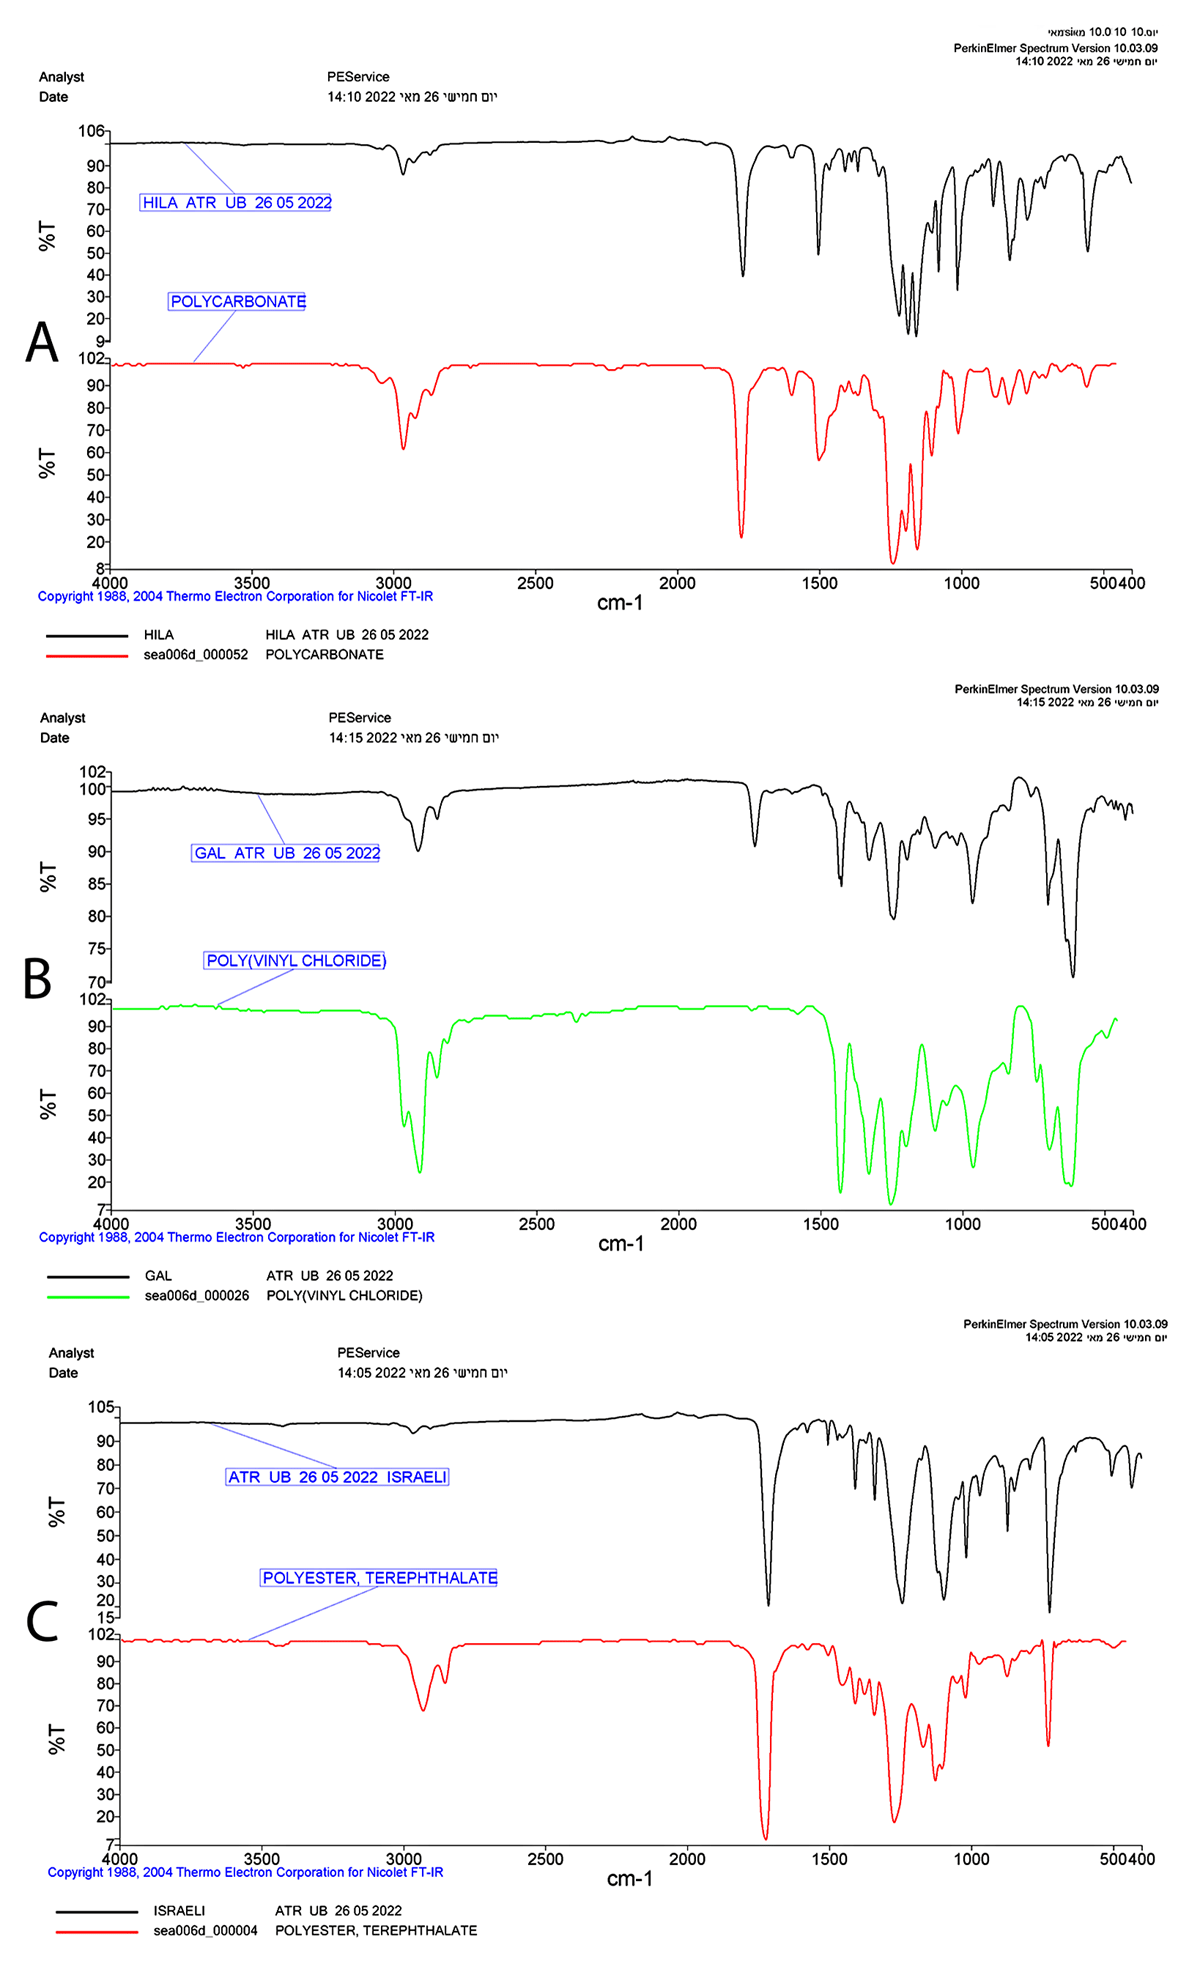
Figure 5
ATR results of cards 17, 12, 9. Black line represents the sample spectra, and the colorful line represents the reference.
The method was tested using counterfeit ID cards from actual cases. The results were compared to a reference specimen (Figure 6). The counterfeit cards exhibited varying compositions, with some primarily composed of PVC and others of PET. Notably, the proportions of each material differed between cards, even those with the same primary component. This variation may provide insights into whether the cards originate from the same source.
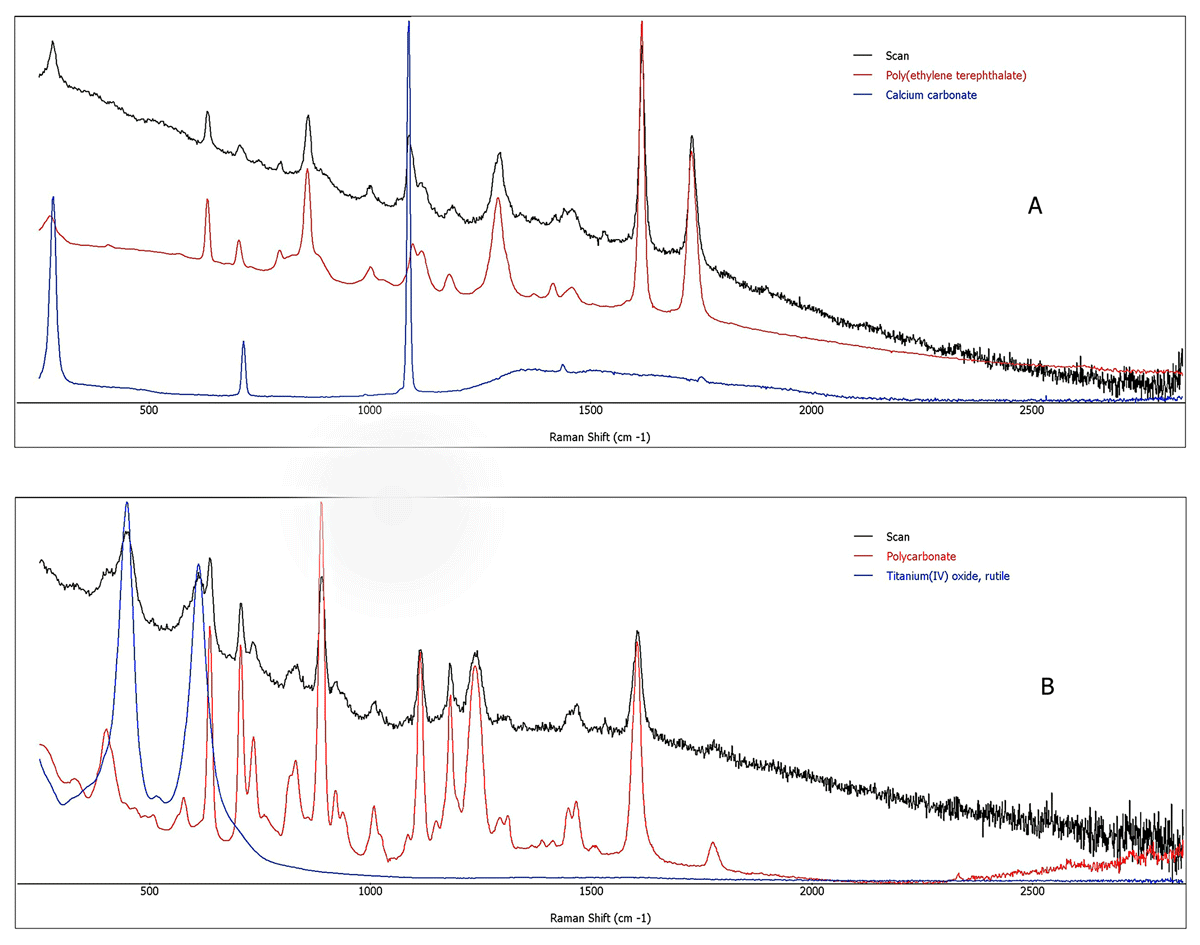
Figure 6
(a) Raman spectra of counterfeit ID card. (b) Raman spectra of specimen ID card.
A dedicated database of genuine and counterfeit cards can be created on the Raman spectrometer in library, created in house to assist first-line examination.
Discussion and Conclusions
The results of this experiment showed repeatability in the different sampling points and on varying dates and were consistent with the results of FTIR-ATR.
The results should be treated as qualitative and not quantitative. The exact composition of the tested cards was unknown to the authors since they are trademarked, and therefore, the percentages found in Table 1 are not out of the total composition of the card (since some materials are not readable by Raman), but rather a percentage out of the Raman reading. It is notable that the percentage ratio within the reading is consistent.
The main limitation of the presented method is the color of the card. It is not suitable for transparent, black, and metallic elements in plastic cards since the polymer cannot be identified with the FirstDefender RM portable instrument.
The experiments performed proved Raman to be a reliable and quick method for identifying the composition of various polymeric cards, including PC. A positive identification of polymeric composition of a questioned card (i.e., a card whose standards are composed of a specific polymer and the questioned card is composed of the same polymer) is not enough in order to ensure that the questioned card is authentic. The polymer content, as stated above, is only one feature in the complex of features composing the questioned document. On the other hand, a negative identification of polymeric composition is a strong rejection of authenticity.
Raman spectroscopy can be implied for forensic intelligence as well. The Raman spectrum of the polymer content in questioned documents is a mapping source of counterfeit cards.
PC and other polymers are commonly used for cards that are of interest to counterfeit, such as identity cards, passports, credit cards, etc. Using a portable Raman spectrometer enables a first-line examination of the polymer composition and may increase the chances of discovering counterfeited documents of this type.
Competing Interests
The authors have no competing interests to declare.