
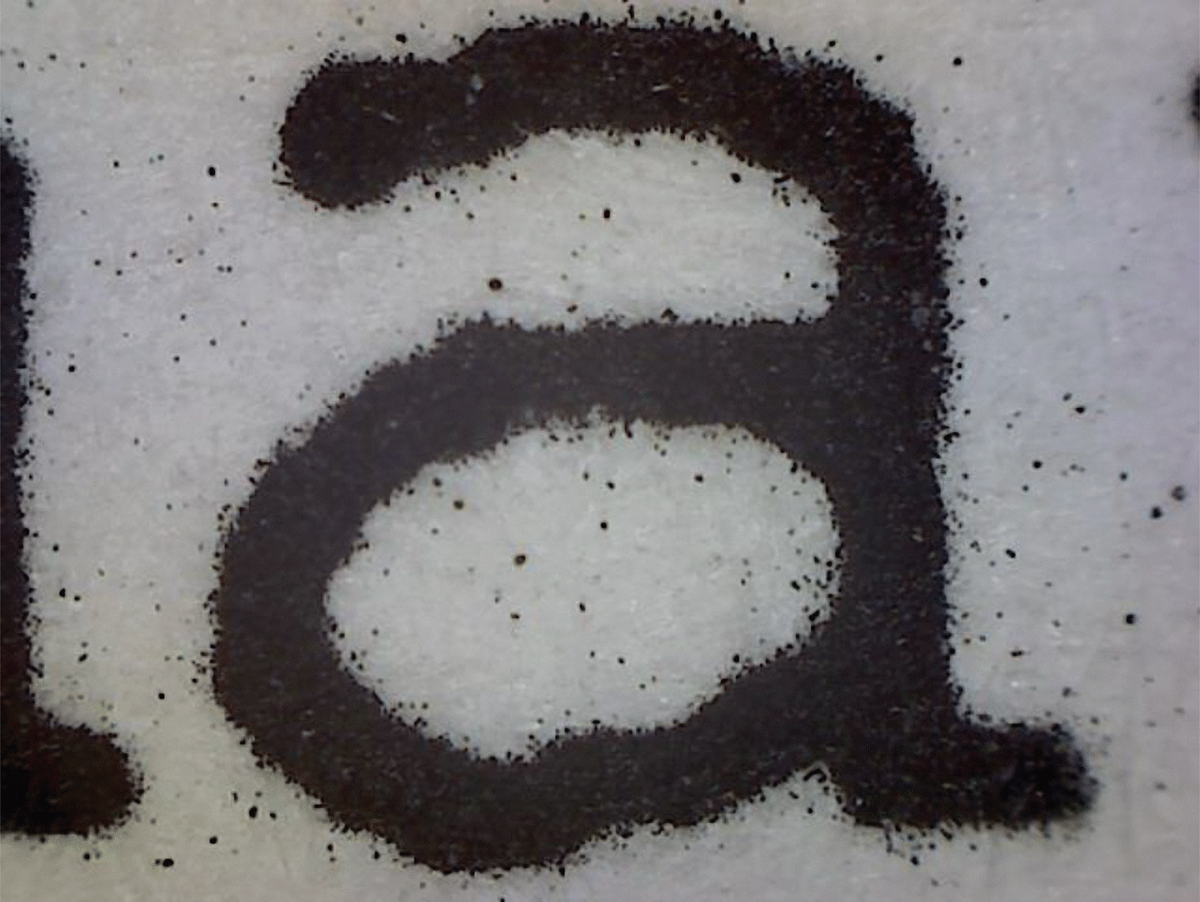
Figure 1
Toner scatter around the characters of the text printed in 1991 (photographed at 140x). The image shows an abundance of black toner particles dispersed throughout the white areas of the document—not only immediately next to the edges of the printed characters (it is termed ‘toner scatter’—a typical ‘noise’ effect occurring during the printing process) but also relatively far from them.
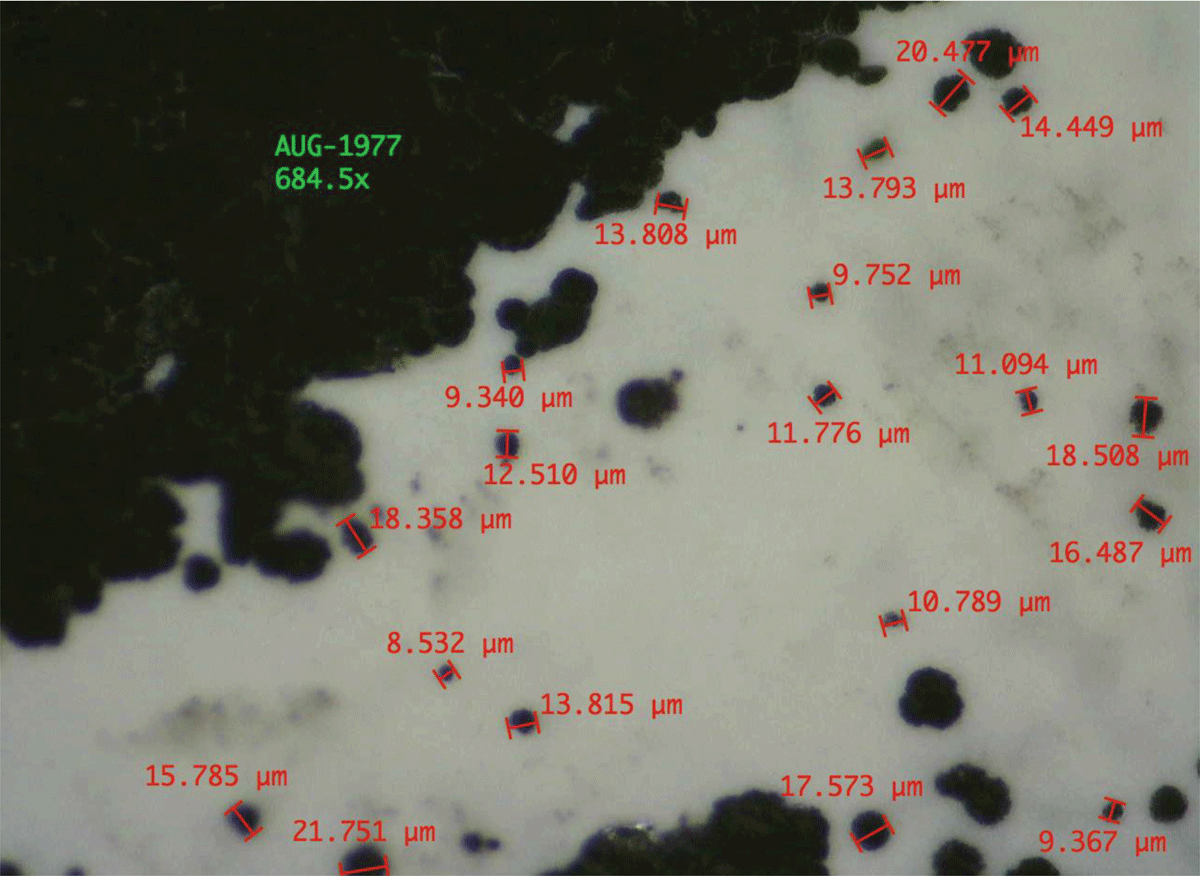
Figure 2
Toner scatter around the characters of the text printed in 1977 (photographed at 684.5x). The sizes of the 19 measured toner particles are between 8.532 and 21.751 microns. The mean value, median and sample standard deviation are approximately 14.1, 13.8 and 3.9 microns, respectively.
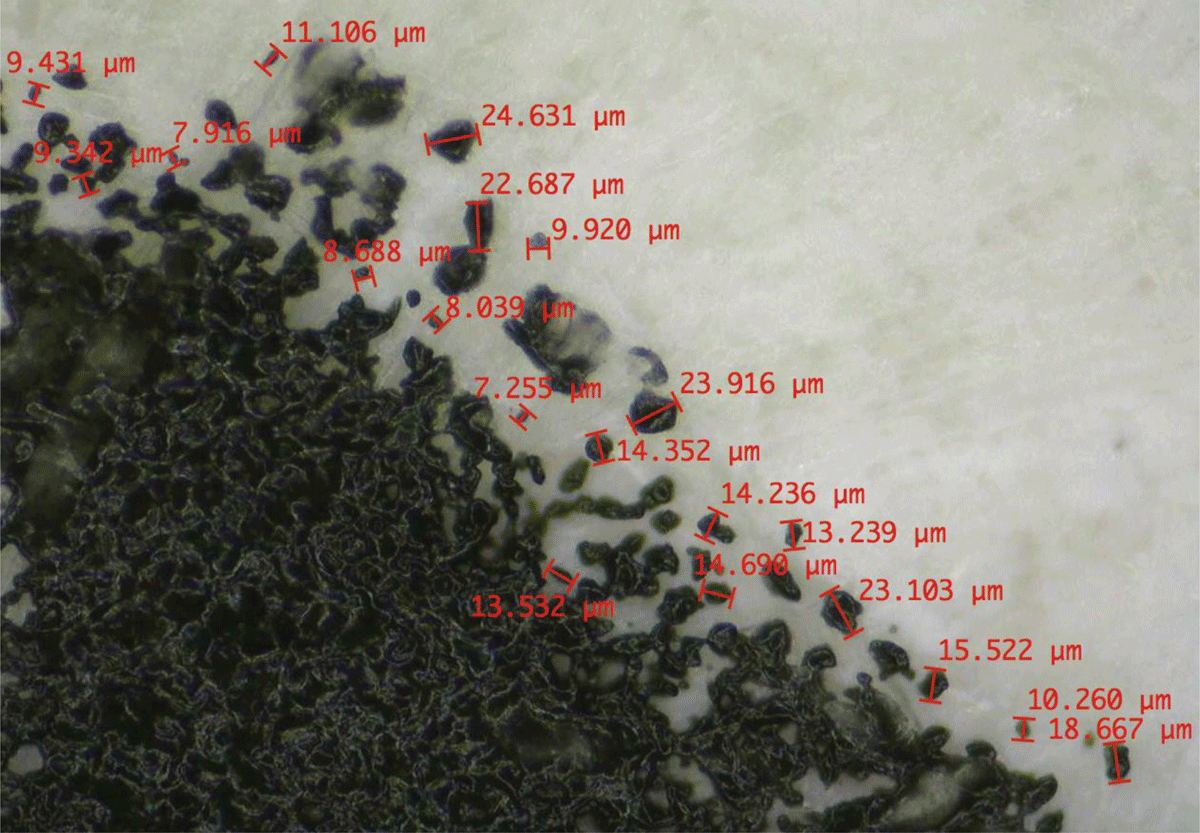
Figure 3
Toner scatter around the characters of the text printed in 1982 (photographed at 680x). The sizes of the 20 measured toner particles are between 7.255 and 24.631 microns. The mean value, median and sample standard deviation are approximately 14.0, 13.4 and 5.7 microns, respectively.
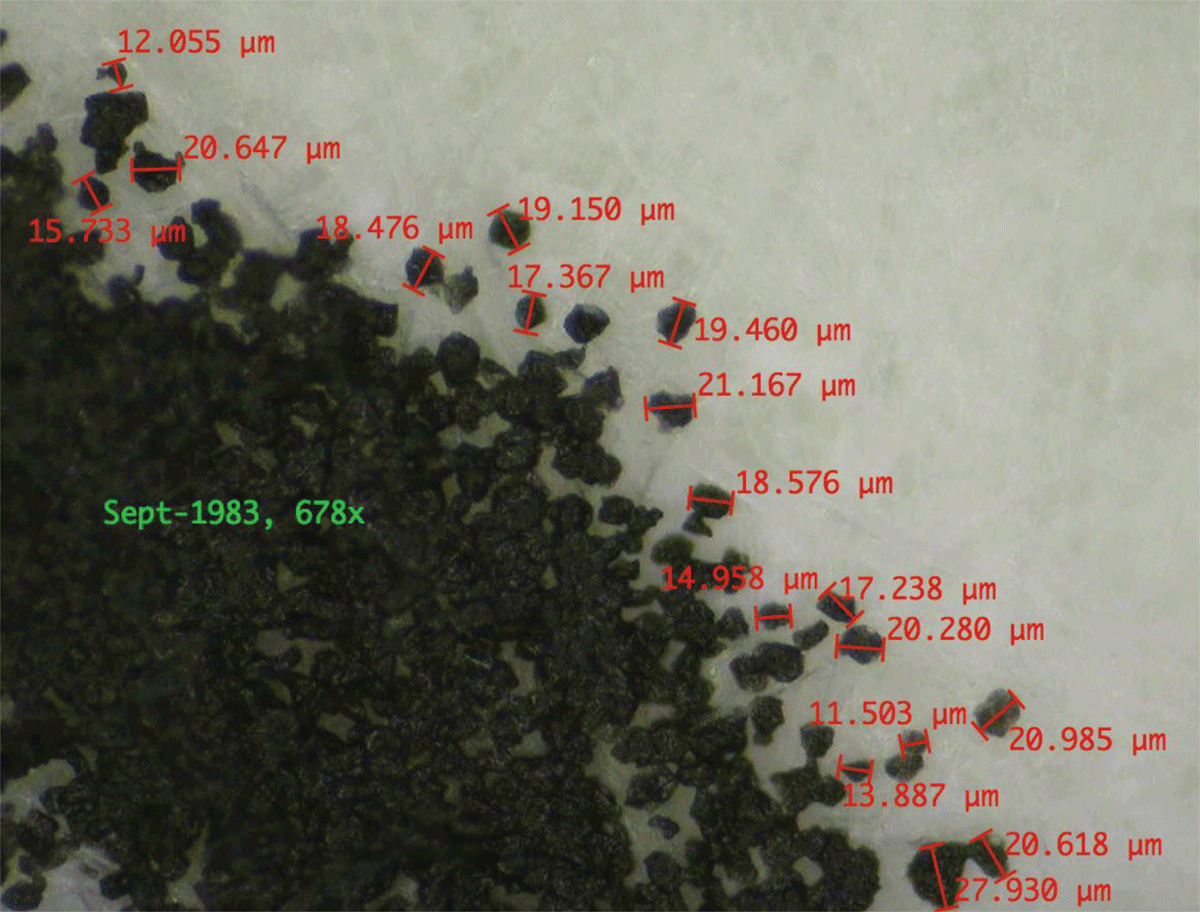
Figure 4
Toner scatter around the characters of the text printed in 1983 (photographed at 678x). The sizes of the 17 measured toner particles are between 11.503 and 27.930 microns. The mean value, median and sample standard deviation are approximately 18.2, 18.5 and 3.9 microns, respectively.
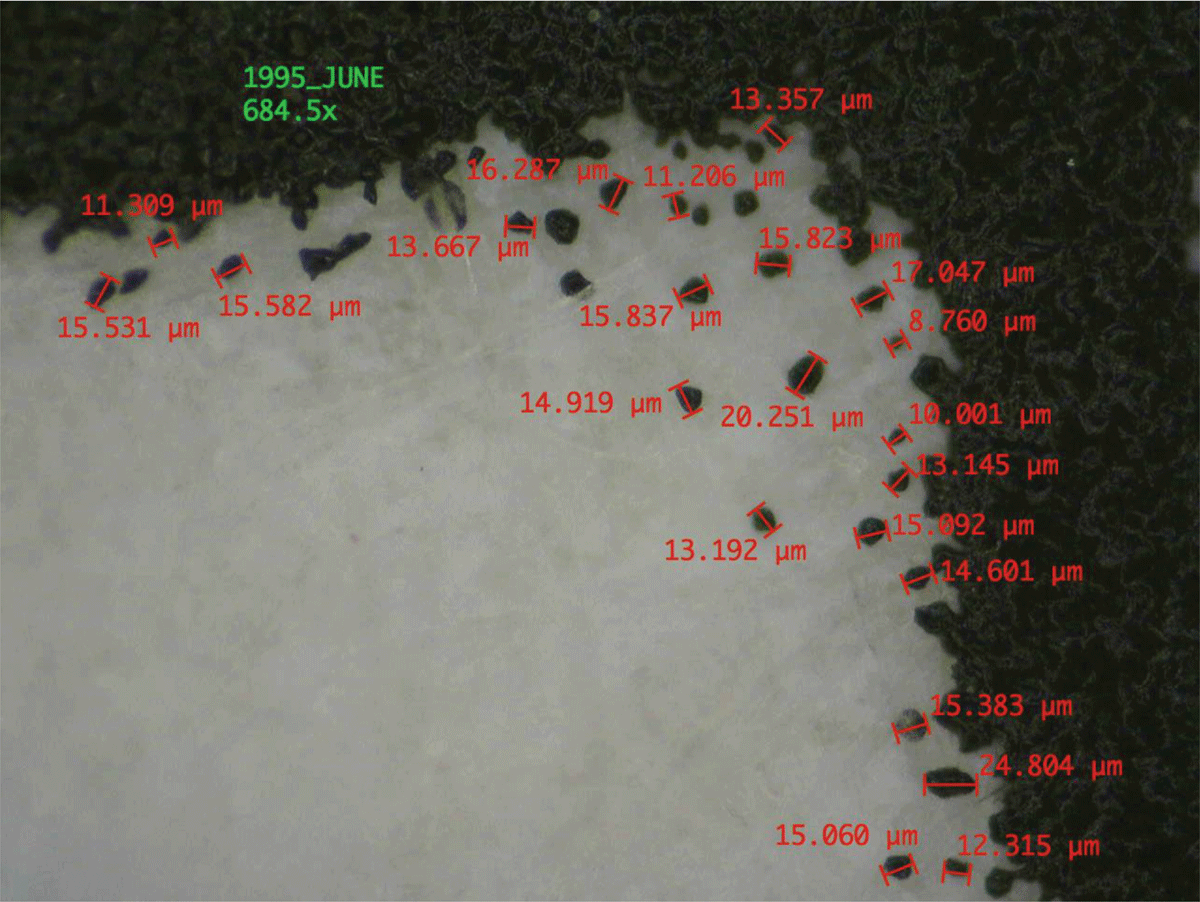
Figure 5
Toner scatter around the characters of the text printed in 1995 (photographed at 684.5x). The sizes of the 22 measured toner particles are between 8.760 and 24.804 microns. The mean value, median and sample standard deviation are approximately 14.7, 15.0 and 3.4 microns, respectively.
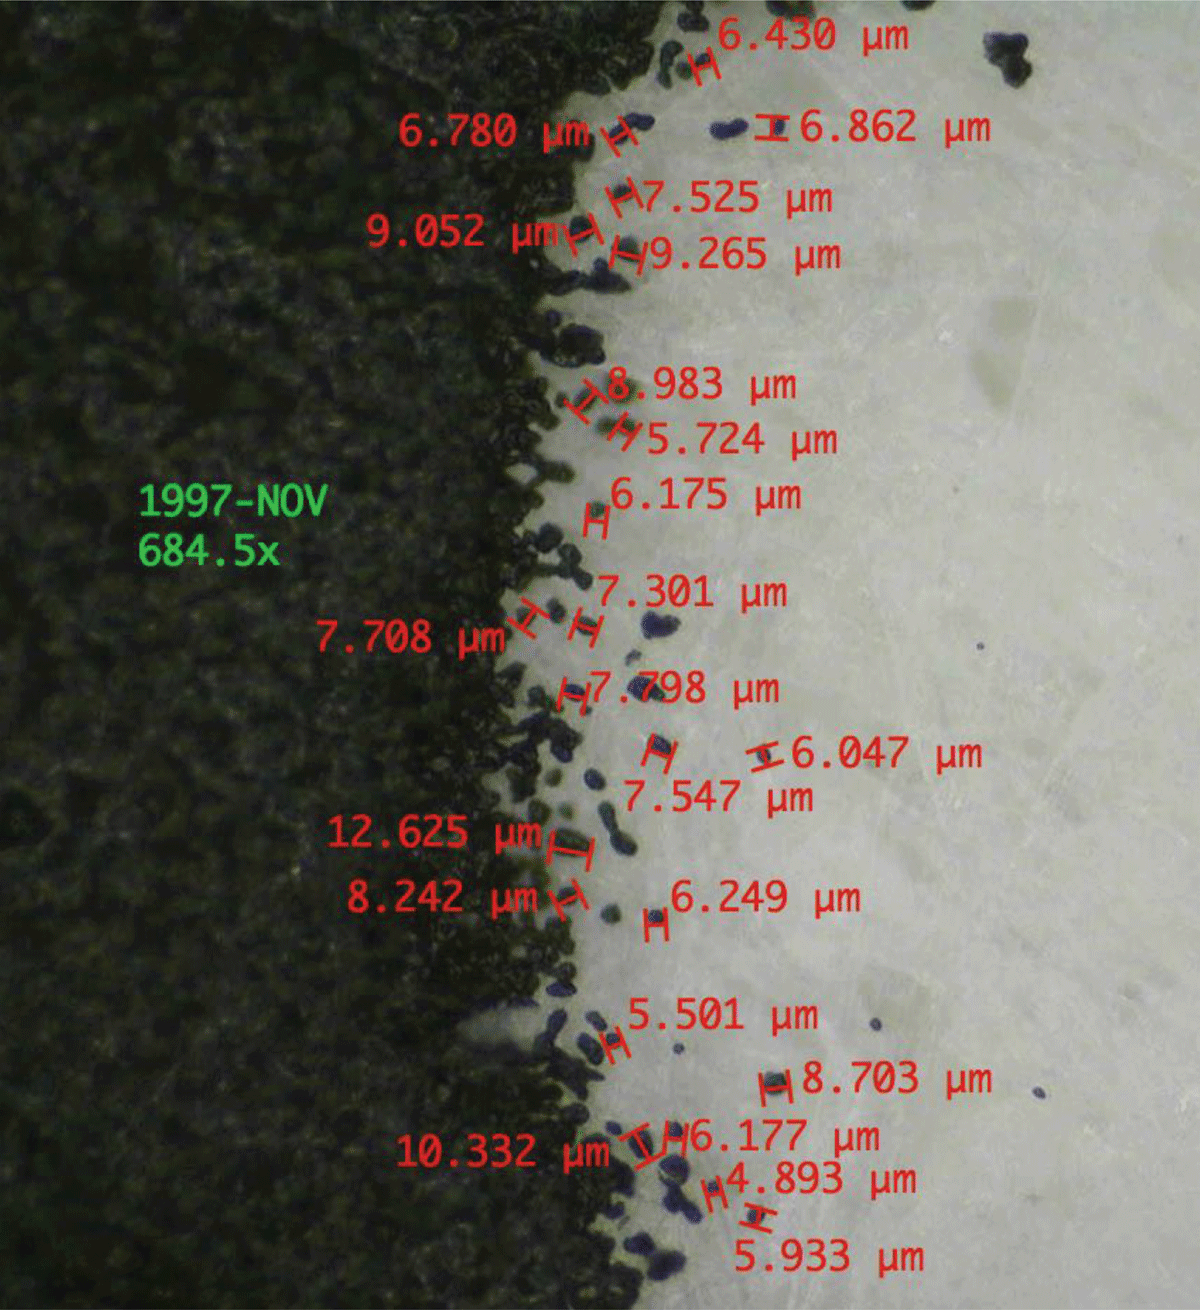
Figure 6
Toner scatter around the characters of the text printed in 1997 (photographed at 684.5x). The sizes of the 23 measured toner particles are between 4.893 and 12.625 microns. The mean value, median and sample standard deviation are approximately 7.5, 7.3 and 1.8 microns, respectively.
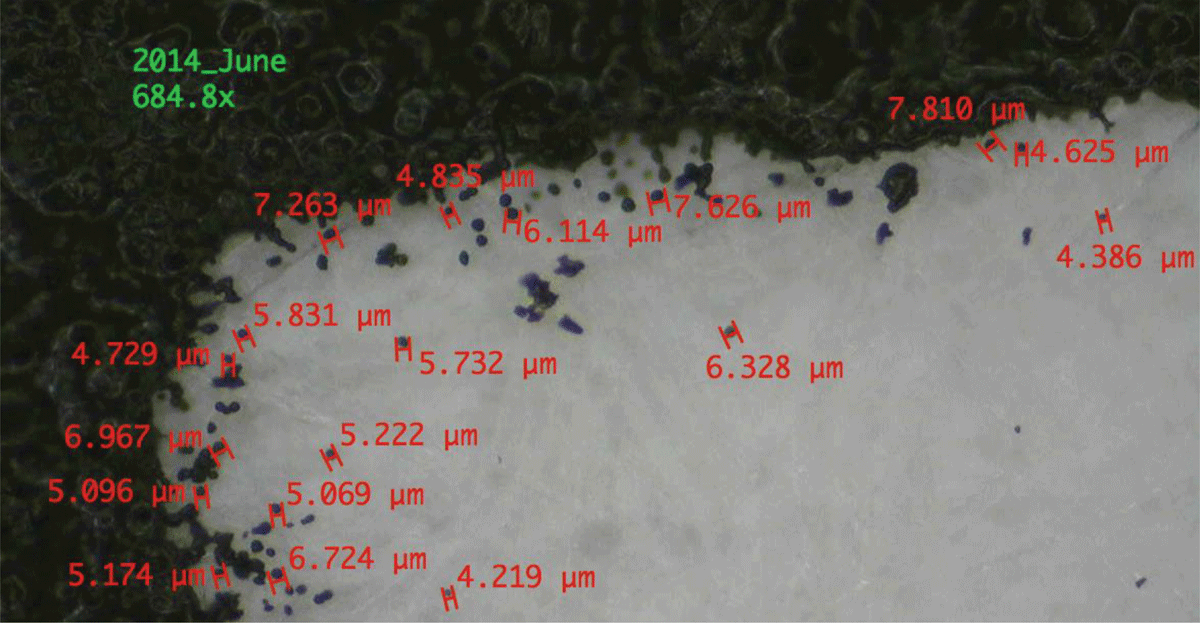
Figure 7
Toner scatter around the characters of the text printed in 2014 (photographed at 684.8x). The sizes of the 18 measured toner particles are between 4.219 and 7.810 microns. The mean value, median and sample standard deviation are approximately 5.8, 5.5 and 1.1 microns, respectively.
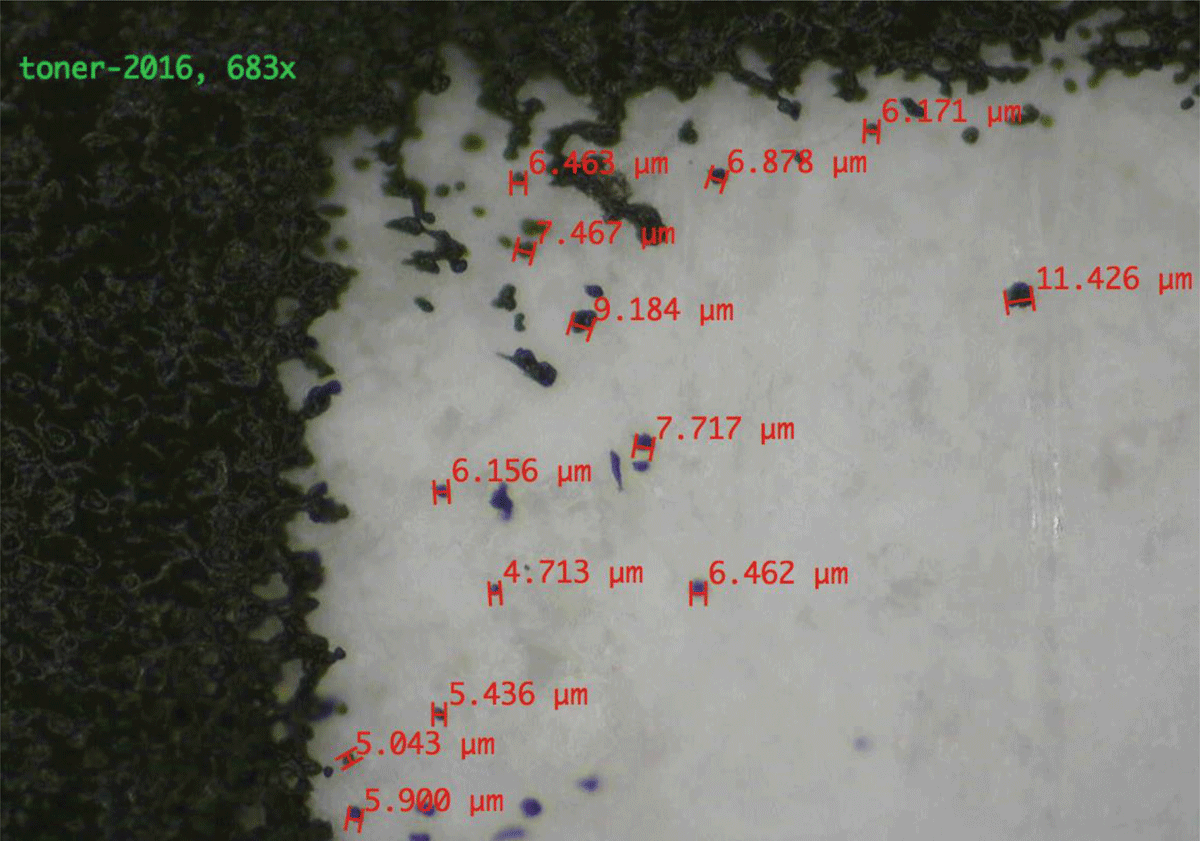
Figure 8
Toner scatter around the characters of the text printed in 2016 (photographed at 683x). The sizes of the 13 measured toner particles are between 4.713 and 11.426 microns. The mean value, median and sample standard deviation are approximately 6.8, 6.5 and 1.8 microns, respectively.