
Introduction
Electrophotographic printing devices (home and office machines, such as photocopiers, laser printers, and some types of multifunction machines capable of scanning, copying, faxing, and printing) typically use dry toner particles for image creation. Toners are very complex mixtures of a variety of raw materials (binder polymers, dyes/ pigments, waxes, charge control agents, surface additives, etc.) all with their own specific function in the hard copy creation process. There are two major types of toners – conventional toner, produced by the conventional mechanical milling (grinding) process, and Chemically Prepared Toner (CPT), produced through a chemical polymerization process.
Conventional toner and CPT are distinguishable from one another in many ways. First, they significantly differ in composition. Second, particle sizes of conventional toner are typically more widely distributed compared to chemical toner. And finally, particle shapes of these two types of toner usually differ significantly. Conventionally prepared toner particle shape is typically determined by mechanical or jet milling, which produces rough, granular shaped toner particles with a low degree of uniformity in shape. In contrast, one of the major features of CPT technology is the capability to select a desired particle shape – from smooth surfaced spherical toner to rougher surfaced potato shaped toner or even rough popcorn or raspberry shaped toner [1].
In each of the two types of toner, conventional and CPT, toner formulations typically vary from manufacturer to manufacturer in both formulation (chemical composition) and granule size (particle size of toner). In the previous work, it was shown that the analysis of the chemical composition of toners using such widely accepted methods of analytical chemistry as TLC, GC-MS and FT-IR microscopy can be effectively used for toner comparison in page substitution cases (i.e. in the cases in which it is necessary to establish whether there is evidence showing that one or more pages of a multi-page document produced with toner-based electrophotographic technology were inserted or substituted) [2]. In the present work, the particle size of toner on printed and copied documents was examined microscopically with the aim to determine whether this type of forensic analysis can reliably determine the average particle size of the toner used to produce a printed (copied) document and thus assist forensic document analysts both in page substitution cases and in document dating cases in which it is necessary to establish whether the toner was available on the date that appears on the contested document. This determination may be useful in document dating cases because it is known that the chemical composition and also the particle size and shape of toner have undergone significant changes at certain points in the past. Prior to October 1992, the particle size of conventional toner was, on average, significantly larger than 10 microns (it was suited to printing at 300 dpi). For example, in 1989, Nakamura and Kutsuwada examined over 1000 toner particles “on the images formed by the plain paper copier” for four types of toner that were on the market at that time, and they determined that the particle size of toner averaged 14–16 microns [3]. Such large toner particles were satisfactory for the laser printers that were used in the late 1980s and offered 300dpi output (such as the first “personal” version of the HP LaserJet printer series – a desktop laser printer HP LaserJet IIP introduced in September 1989), but this particle size was too large to allow a higher level resolution in printing. To reach a higher than 300-dpi level resolution in printing, in October 1992, HP announced the HP LaserJet 4 with a new “Microfine toner powder” [4]. The Microfine toner was in average 8 microns in size, and these 8-micron printed dots, packed closer using the Resolution Enhancement technology developed by HP, enabled LaserJet resolutions to double to 600 dpi. That is, the 8-micron toner was suited to printing at both 300 and 600 dpi.
Another significant change in both chemical composition and particle size of toner was the introduction of CPT. Although basic research on CPT manufacturing methods has been ongoing for many years, only in the mid-1990s to mid2000s were several printers successfully commercialized that were based on the CPT technology [5, 6]. The typical particle size of CPT toner is between 3 and 8 microns (5 microns in average) [1]. Different CPT technologies have different particle shape range capabilities.
Based on the information considered above, it is evident that the microscopic examination of the particle size and shape of toner present on a questioned document may establish whether the toner was or was not available on the date that appears on the document. For example, if a document purportedly printed, say, in the 1980s, has been printed using toner that on average is 8 microns or smaller, that would provide strong evidence that the text was not printed in the 1980s, as dated, and it was actually printed after the time when the 8-micron toner was first commercially available, that is in or after October 1992.
Methods and Materials
Toner and Paper Samples (known dated documents)—Twenty-seven B&W photocopies and laser printed documents (specimens) were examined in this work. The specimens were prepared over a period of approximately 39 years – from 1977 to 2016. Specifically, the documents were printed/copied in the following years: 1977 (1 document), 1980 (1), 1982 (1), 1983 (1), 1989 (2), 1990 (2), 1992 (1), 1995 (2), 1997 (2), 2000 (2), 2001 (2), 2005 (2), 2010 (2), 2012 (2), 2014 (2), and 2016 (2).
The specimens dated in the 2010s were printed on HP Office paper (92 brightness, 20 lb weight, manufactured in USA) and OfficeMax Laser paper (96, 24 lb, USA) using HP LaserJet 3030 Allin-One and HP LaserJet P3015 printers. The other specimens were printed or copied on various types of white paper of unknown manufacturers using laser printers and photocopiers of unknown makes and models.
Sampling Device—Hypodermic needle-like apparatus, the Harris Micro-PunchTM (Electron Microscopy Sciences, Hatfield, PA), which removes ca. 0.5-mm and 1.0- mm samples (micro plugs) of toner-on-paper. The bored toner samples are removed with a plunger.
Methodology and Instruments—Toner particles within the confines of printed characters and scattered around printed characters and images were examined macro- and microscopically using 10x magnifying glasses, a Zarbeco MiScope-2MP digital microscope with magnifications 40x and 140x, and a Dino-Lite digital microscope at magnifications between 670x to 690x. Figure 1 shows an example of significant toner scatter around printed characters that sometimes can be seen when examining texts/images produced with malfunctioning printing devices or with older printers/copiers used decades ago.
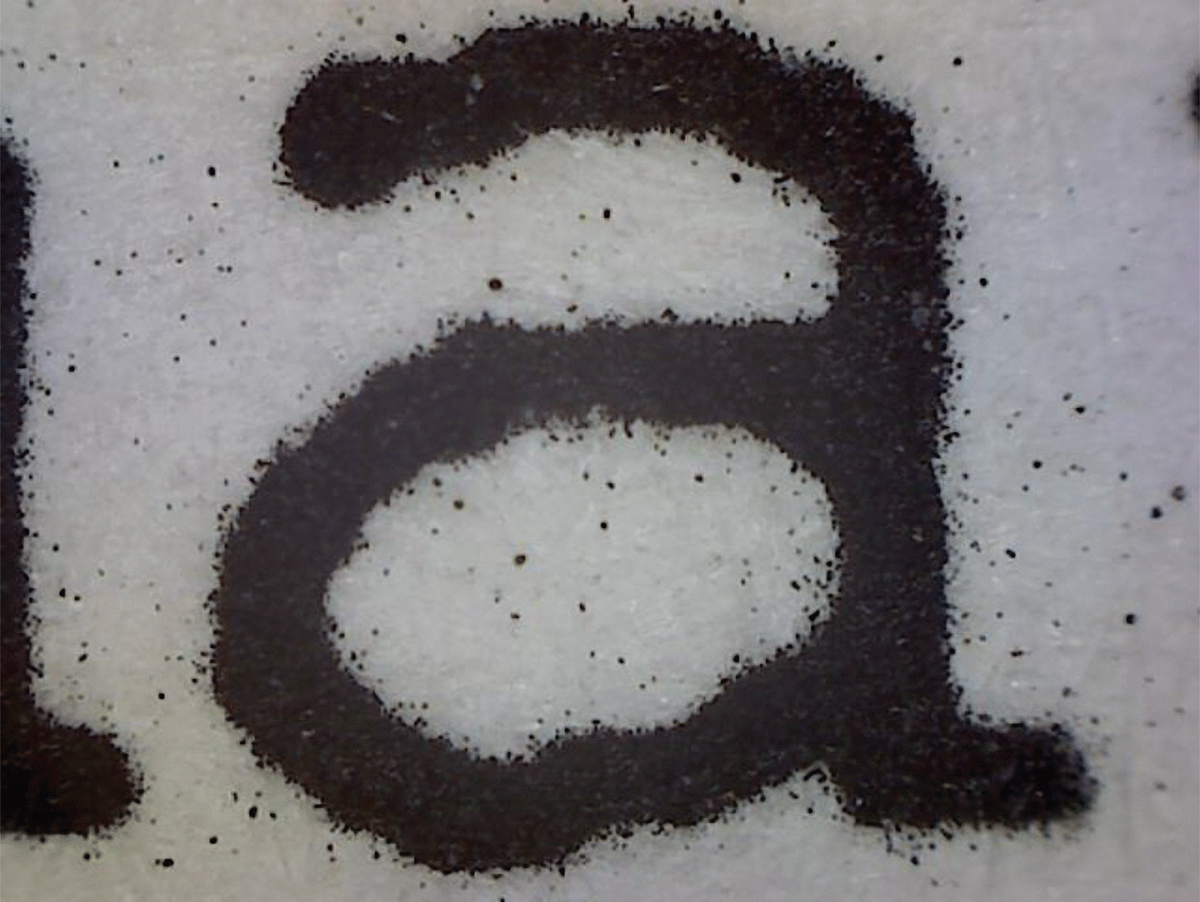
Figure 1
Toner scatter around the characters of the text printed in 1991 (photographed at 140x). The image shows an abundance of black toner particles dispersed throughout the white areas of the document—not only immediately next to the edges of the printed characters (it is termed ‘toner scatter’—a typical ‘noise’ effect occurring during the printing process) but also relatively far from them.
To measure the size of the toner particles scattered around printed characters, the Dino-Lite digital microscope equipped with the DinoXcope software, as well as an S-1934 Planotec silicon test specimen for incident light microscopy (Electron Microscopy Sciences, Hatfield, PA), were used. The test specimen (mounted on black slide) consists of horizontal and vertical lines etched into a single silicon crystal (0.5 mm thick) of overall dimensions 5 x 5 mm. The dividing lines are about 1.9 µm in width, 10 µm apart (10 µm pitch), and are formed (‘written’) by electron beam lithography. Also, a broader marking line is written every 500 µm. Overall, the lines on the test specimen form a square mesh of coarse lines of 500 µm spacing with 50 intermediate fine lines of 10 µm spacing. In this study, the test specimen was used before and after each series of measurements to check the ability of the microscope to accurately measure the 10 µm distance between the lines written on the test specimen. Such an ‘external calibration’ procedure was used to exclude a possibility for systematic errors affecting the measurements conducted on different days and therefore make sure that all toner particles were measured accurately.
Microscopy of Toner Samples taken from Documents—Toner particles were examined microscopically both on the documents (specimens) themselves and on 0.5-mm and 1.0-mm samples (micro plugs) of toner-on-paper taken from the documents. In the latter case, the toner-on-paper samples were taken using the above-mentioned Harris Micro-Punch and placed on a piece of Scotch removable double-sided tape. The side of the tape that did not bear the samples was attached to a compact disk (CD). The CD bearing the toner-on-paper samples was placed under the microscope to measure the size of scattered toner particles. After the toner particles were measured under the microscope, the CD disk was placed in a jewel CD case that holds the CD in place and thus secures the toner samples. Such a procedure for the storage of toner samples was used in this study to guarantee the integrity of the samples after their examination in the event they were needed for additional measurements or other examinations.
Results and Discussion
Toner particles are typically too small to be visible to the naked eye, but they can be easily observed, and their size measured, under a highpower compound (not stereo1) microscope. Any small area of a printed line, say 1-mm by 1-mm square, contains hundreds of individual (singular) toner particles.2 These hundreds of toner particles (most of which are located on top of one another) partially overlap with the formation of aggregates when they melt and bond (fuse) to the paper of the printed or photocopied document at the end of the printing process—when the paper passes through rollers in the fuser assembly where intense heat (up to 200°C) and pressure instantly fuse the plastic toner. The formed aggregates of the fused and overlapped toner particles fill out the areas between the edges of printed lines, and it is practically impossible to accurately define boundaries and thus measure the sizes of any of the toner particles that have formed these aggregates.
In this work, numerous printed lines have been examined under the microscope, and the microscopic examination has revealed only small quantities of solitary toner particles outside the agglomerates of fused and overlapped toner particles within the confines of the lines. Based on this result, it seems evident that the most practical way to accurately measure the size of individual (solitary) toner particles on printed/ copied documents is to microscopically examine so-called “stray” solitary toner particles that are typically present (randomly distributed) in significant quantities near any printed line or image. Such stray toner particles are called “toner scatter” or “background noise” (see Figure 1 on previous page).
Figures 2, 3, 4, 5, 6, 7, 8 show the results of the measurements of individual toner particles scattered around the characters produced by printers/ copiers in the period from 1977 to 2016.
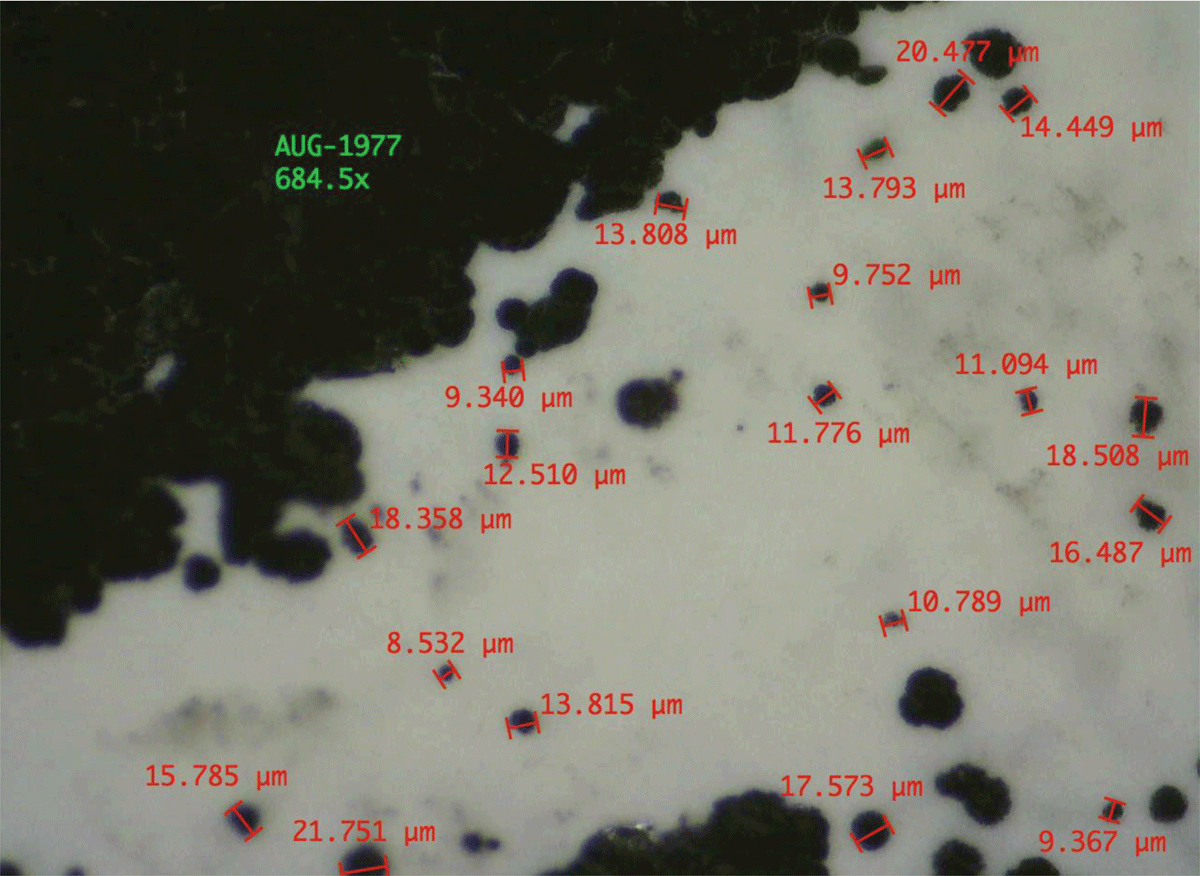
Figure 2
Toner scatter around the characters of the text printed in 1977 (photographed at 684.5x). The sizes of the 19 measured toner particles are between 8.532 and 21.751 microns. The mean value, median and sample standard deviation are approximately 14.1, 13.8 and 3.9 microns, respectively.
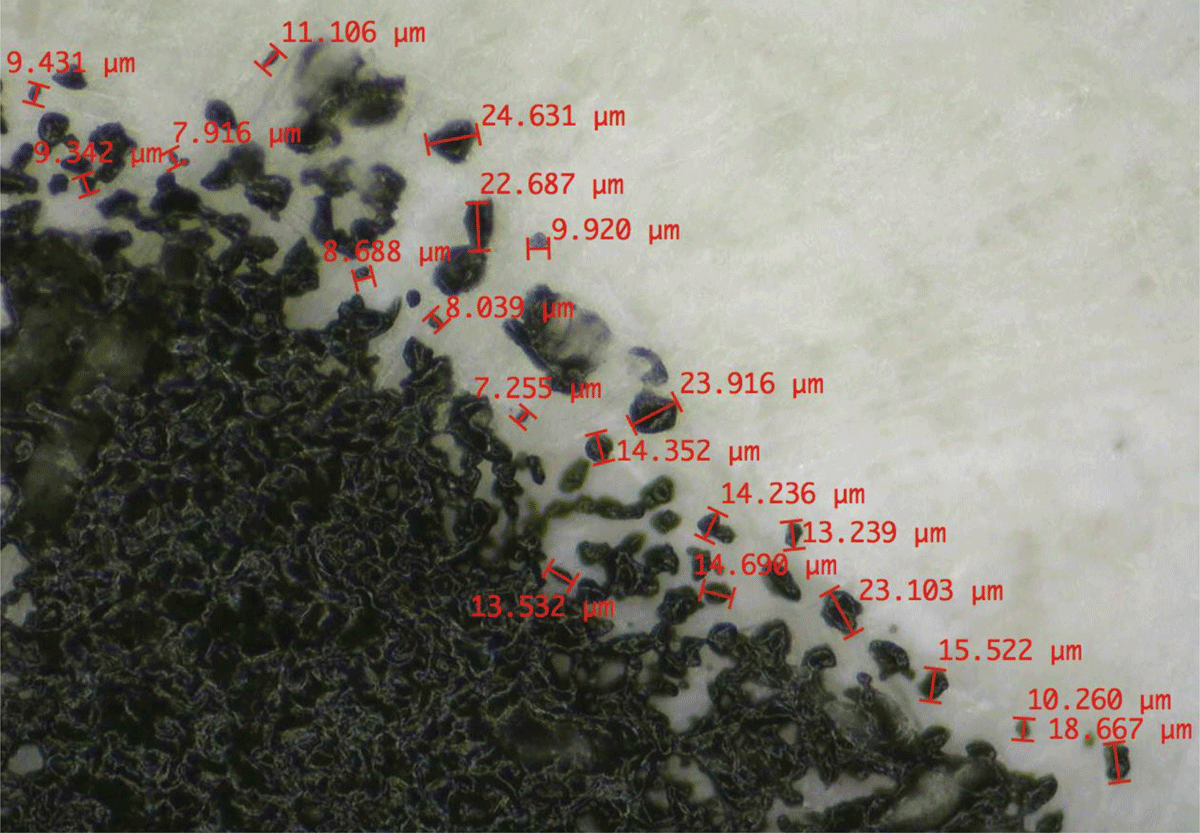
Figure 3
Toner scatter around the characters of the text printed in 1982 (photographed at 680x). The sizes of the 20 measured toner particles are between 7.255 and 24.631 microns. The mean value, median and sample standard deviation are approximately 14.0, 13.4 and 5.7 microns, respectively.
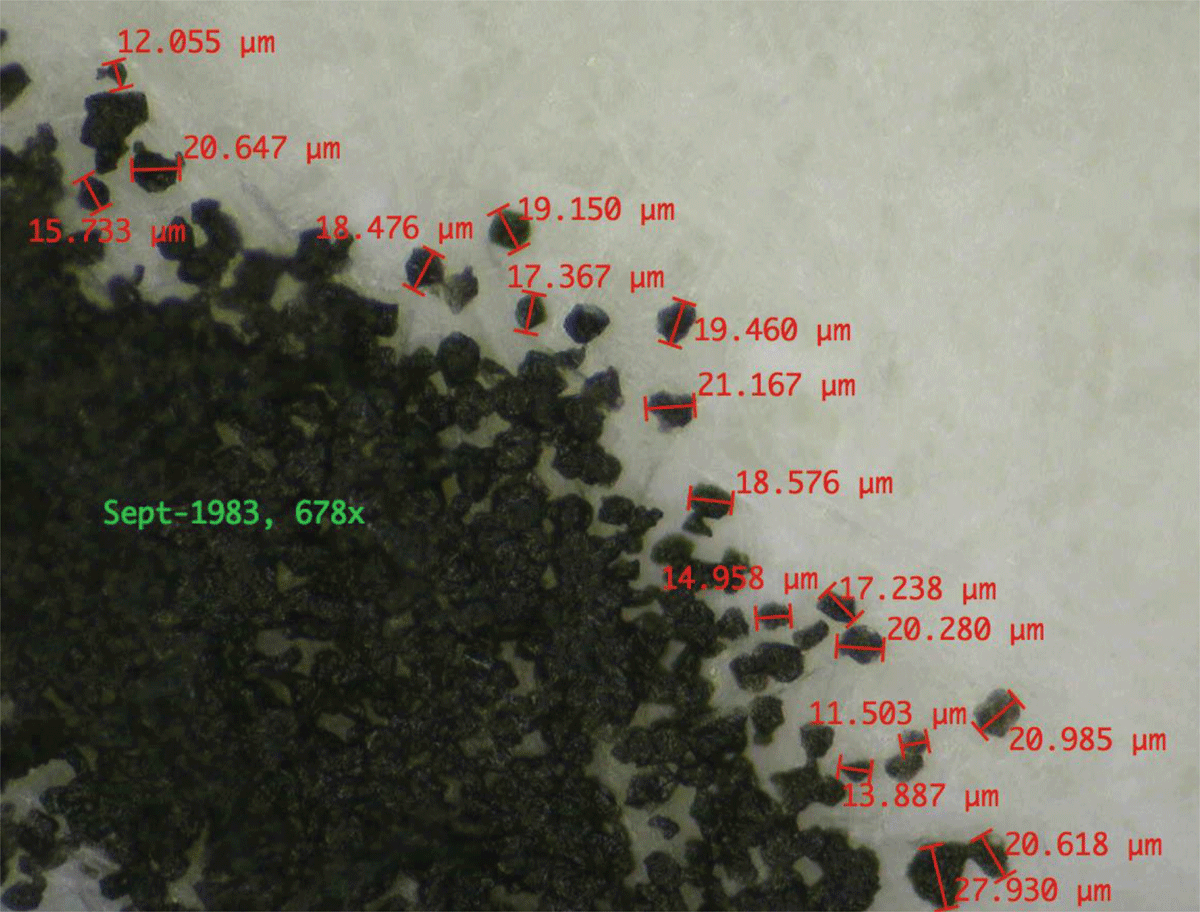
Figure 4
Toner scatter around the characters of the text printed in 1983 (photographed at 678x). The sizes of the 17 measured toner particles are between 11.503 and 27.930 microns. The mean value, median and sample standard deviation are approximately 18.2, 18.5 and 3.9 microns, respectively.
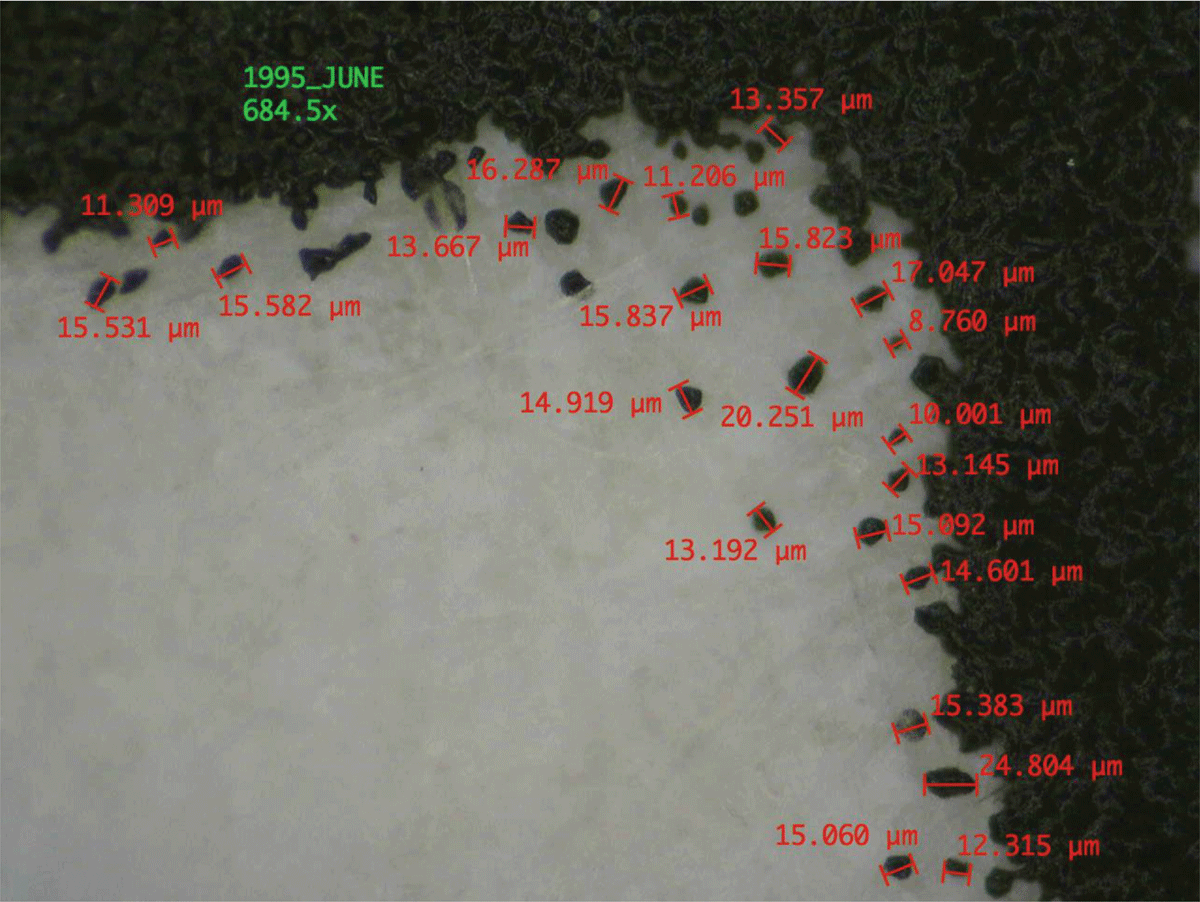
Figure 5
Toner scatter around the characters of the text printed in 1995 (photographed at 684.5x). The sizes of the 22 measured toner particles are between 8.760 and 24.804 microns. The mean value, median and sample standard deviation are approximately 14.7, 15.0 and 3.4 microns, respectively.
The results obtained in this work show that they are in full agreement with the previous publications reporting as follows:
the particle size of toner used in laser printers and copy machines in the 1970s, 1980s and the beginning of the 1990s was, on average, significantly higher than 10 microns [3] (see Figures 2, 3, 4, 5 above);
the conventional toner of less than 10 microns in size started to be used in commercially available printers and copiers only after a so-called “microfine” (“8 microns”) toner was released with the HP LaserJet 4 in October 1992 [4] (see Figure 6 that follows); and
CPT toner (typically rounded and more evenly sized toner particles that are, on average, approximately 5 microns in size) started to be used in commercially available printers since the mid-1990s. The 5-micron toner was suited to printing at up to 1200 dpi [1] (see Figures 7 and 8 that follows).3
In conclusion, it is important to stress that to accurately determine the average particle size of toner used to create a printed document (text, image), it is necessary to measure tens of toner particles to obtain a statistically valid result. This is based on the observations that some documents, which were microscopically examined in this work, showed that 1) some conventional toners had widely distributed particle size (from as small as 6 microns to as large as over 30 microns toner particles), and 2) some CPTs contained ‘outliers’ – toner particles of smaller than 4 microns and larger than 12 microns.
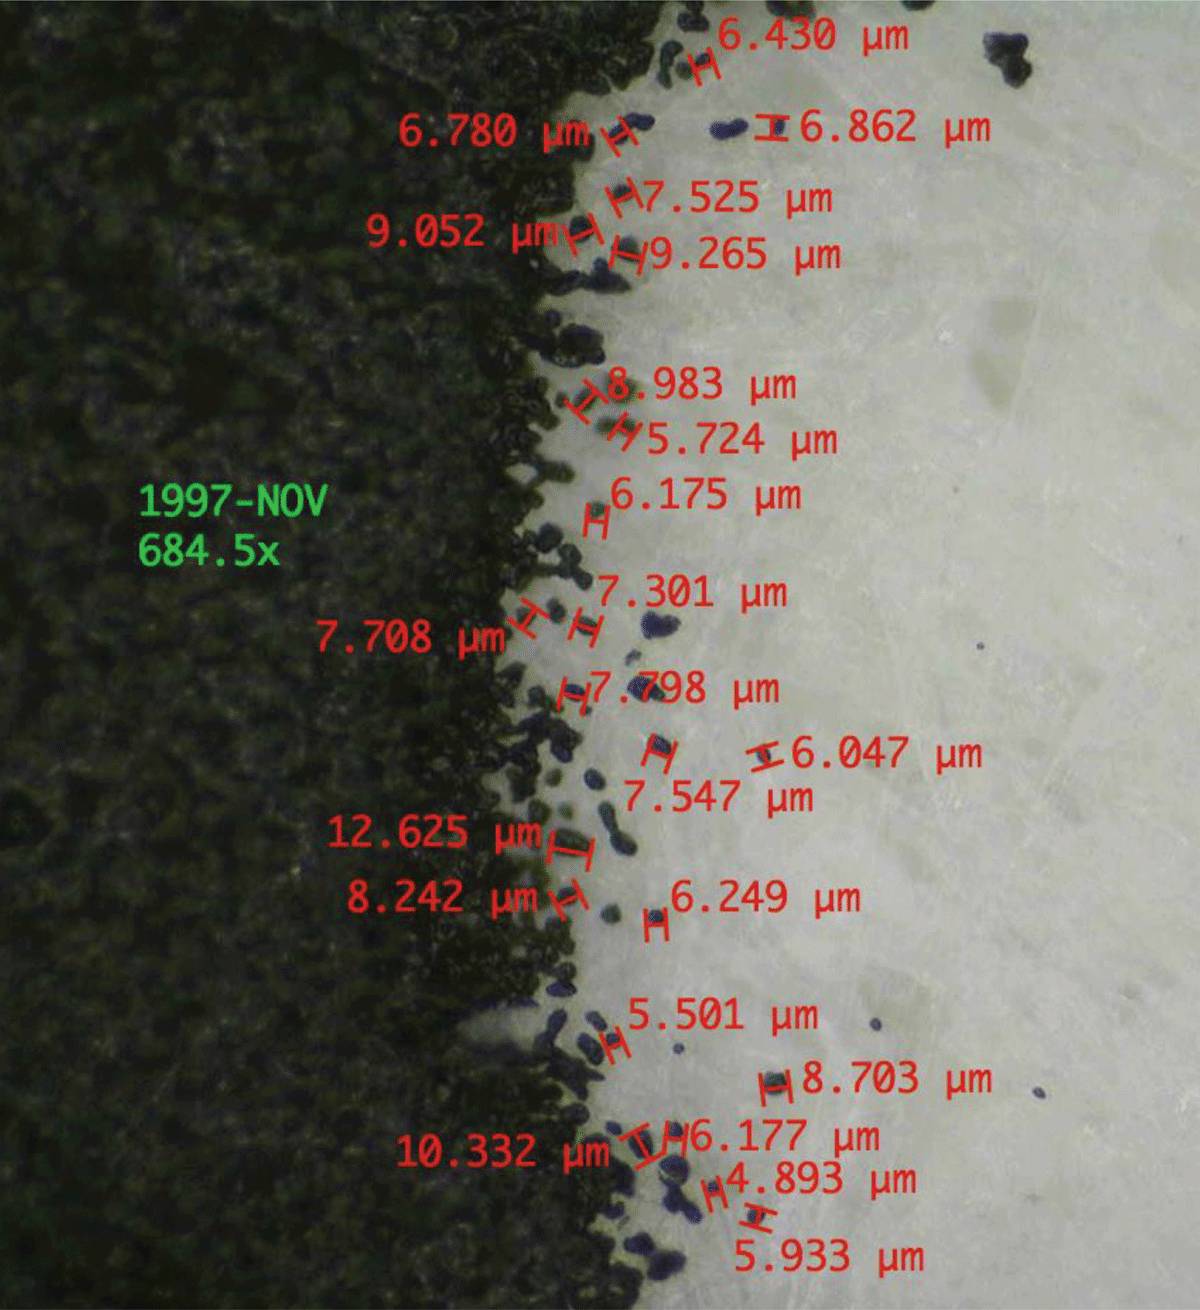
Figure 6
Toner scatter around the characters of the text printed in 1997 (photographed at 684.5x). The sizes of the 23 measured toner particles are between 4.893 and 12.625 microns. The mean value, median and sample standard deviation are approximately 7.5, 7.3 and 1.8 microns, respectively.
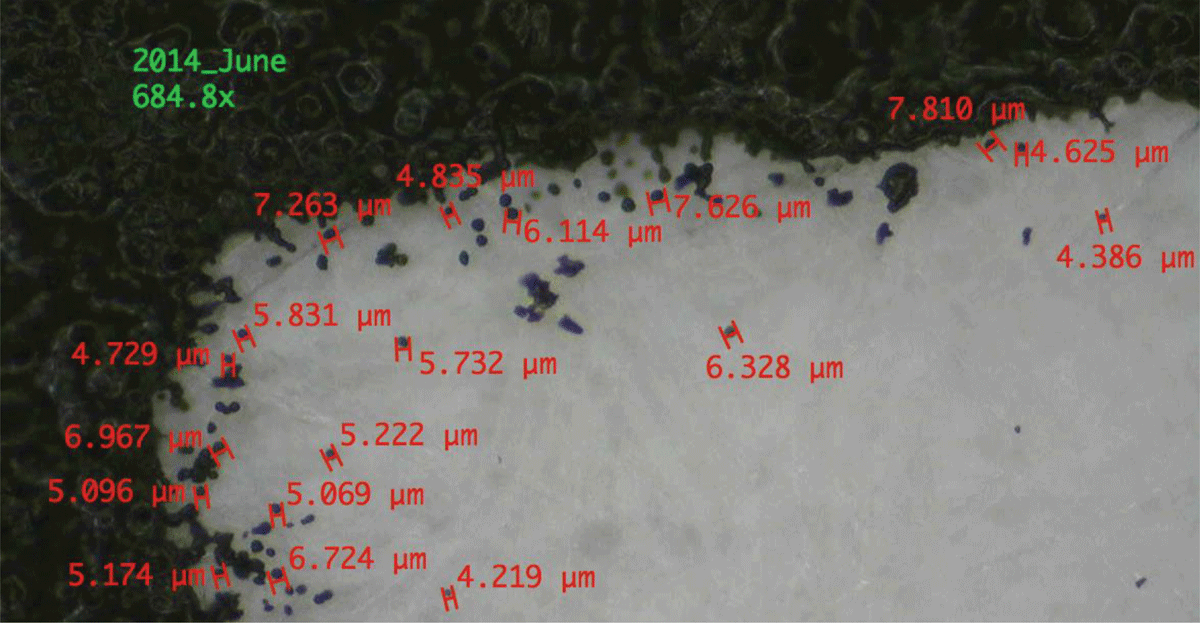
Figure 7
Toner scatter around the characters of the text printed in 2014 (photographed at 684.8x). The sizes of the 18 measured toner particles are between 4.219 and 7.810 microns. The mean value, median and sample standard deviation are approximately 5.8, 5.5 and 1.1 microns, respectively.
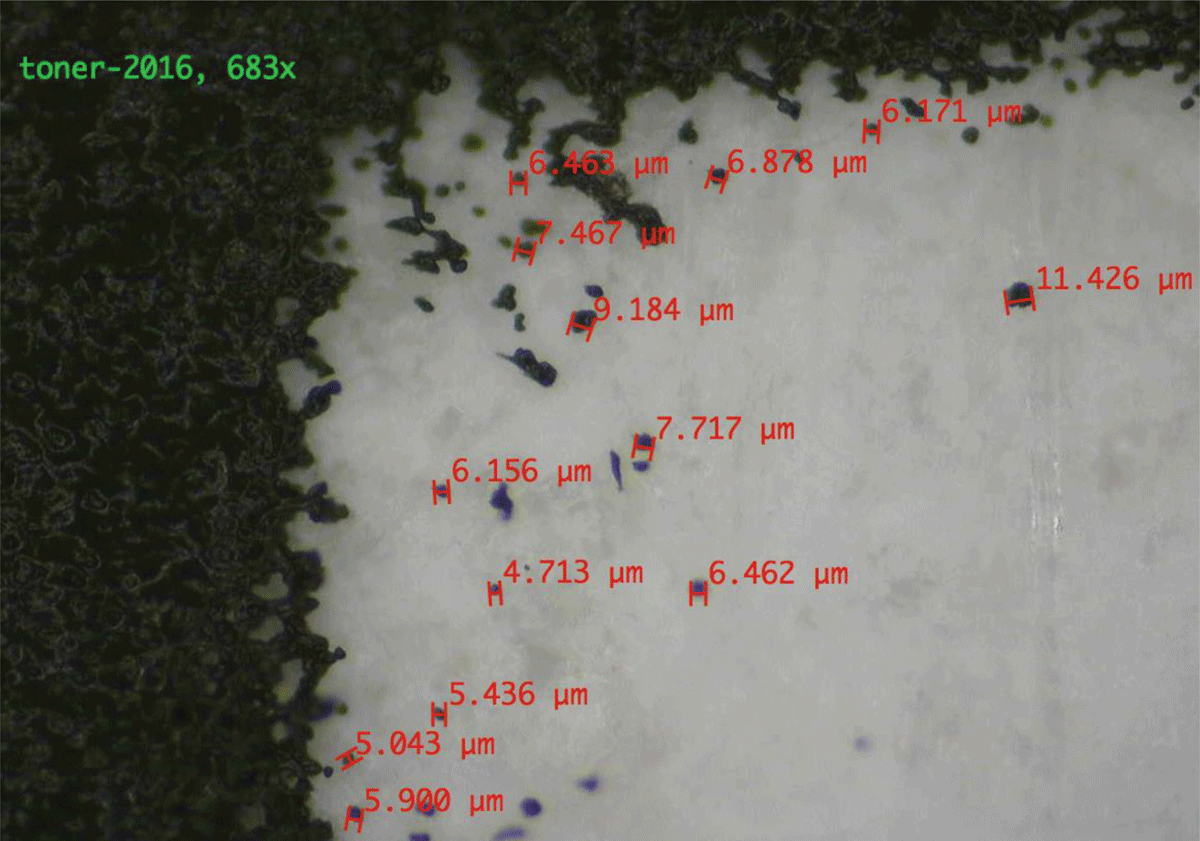
Figure 8
Toner scatter around the characters of the text printed in 2016 (photographed at 683x). The sizes of the 13 measured toner particles are between 4.713 and 11.426 microns. The mean value, median and sample standard deviation are approximately 6.8, 6.5 and 1.8 microns, respectively.
Conclusion
This paper shows that the microscopic examination of toner particles scattered around printed characters can reliably determine the average particle size of the toner used to produce a printed (copied) document. This, in its turn, can be of assistance in page substitution cases, for example, when a document examiner compares pages of a multipage document to determine whether there is evidence that certain pages were not printed/ copied contemporaneously with the others and may have been substituted (inserted in the document) at a later time. Additionally, in document dating cases, one can establish that a toner on a contested document has a particle size that is significantly smaller than what may be observed in commercially available toners produced on or around the date appearing on the document.
Notes
[1] The stereo (stereoscopic) microscope is an optical microscope variant designed for low magnification observation of a sample. Some stereo microscopes can deliver a useful magnification up to 100x, comparable to a 10x objective and 10x eyepiece in a normal compound microscope, although the magnification is often much lower. This is around one tenth the useful resolution of a normal compound optical microscope.
[2] It takes approximately 150 million toner particles (ca. 6 microns each) to cover only about 5 percent of a page, and there are approximately 5,900 toner particles in a single printed period [7].
[3] During the period of time from 2001 to 2006, the production of black CPT increased from around 1% to almost 10% of all black toners [6].
Acknowledgment
I am most grateful to David S. Moore for providing me with old documents that were examined in this work-specifically the documents that were printed/copied in the 1970s and 1980s.