
Table 1.
Handwriting stroke parameters used in this study and their operational definitions3.
| Stroke Parameter | Definition |
|---|---|
| Duration | Time interval (sec) between the first and last samples in a stroke |
| Vertical Amplitude | Vertical vector difference between beginning and end of a stroke (cm). |
| Horizontal Amplitude | Horizontal vector difference between begin and end of a stroke |
| Peak Velocity | First derivative of vertical displacement (cm/s) |
| Peak Acceleration | Second derivative of vertical displacement (in cm/s2) |
| Straightness Error | Straightness error or the normalized standard deviation from a straight baseline is the RMS difference from the straight line fitted through the stroke divided by the stroke distance (StraightErr = (1/length) * sqrt (Sum (y(t) - yd(t))**2 / N)). A perfectly straight stroke will have straightness error of 0. It is orientation free. |
| Slant | The angle or inclination of the axes of letters relative to the perpendicular to the baseline of the writing (in radians). |
| Pen Down Duration | Ratio of pen up duration to total duration. The value ranges from 0 to 1. 0 corresponds to no pen down and 1 corresponds to all pen down and the values in between show the ratio. |
| Loop Surface | Surface or the area of the loop enclosed by the previous and present stroke in cm**2. The surface is not normalized. If the the crossing does not occur within the previous stroke, although a loop has been formed, the loop area will be zero. |
| Pen Pressure | Relative axial pressure on the pen tip when the pen is on the paper (ranging from 0-2047). |
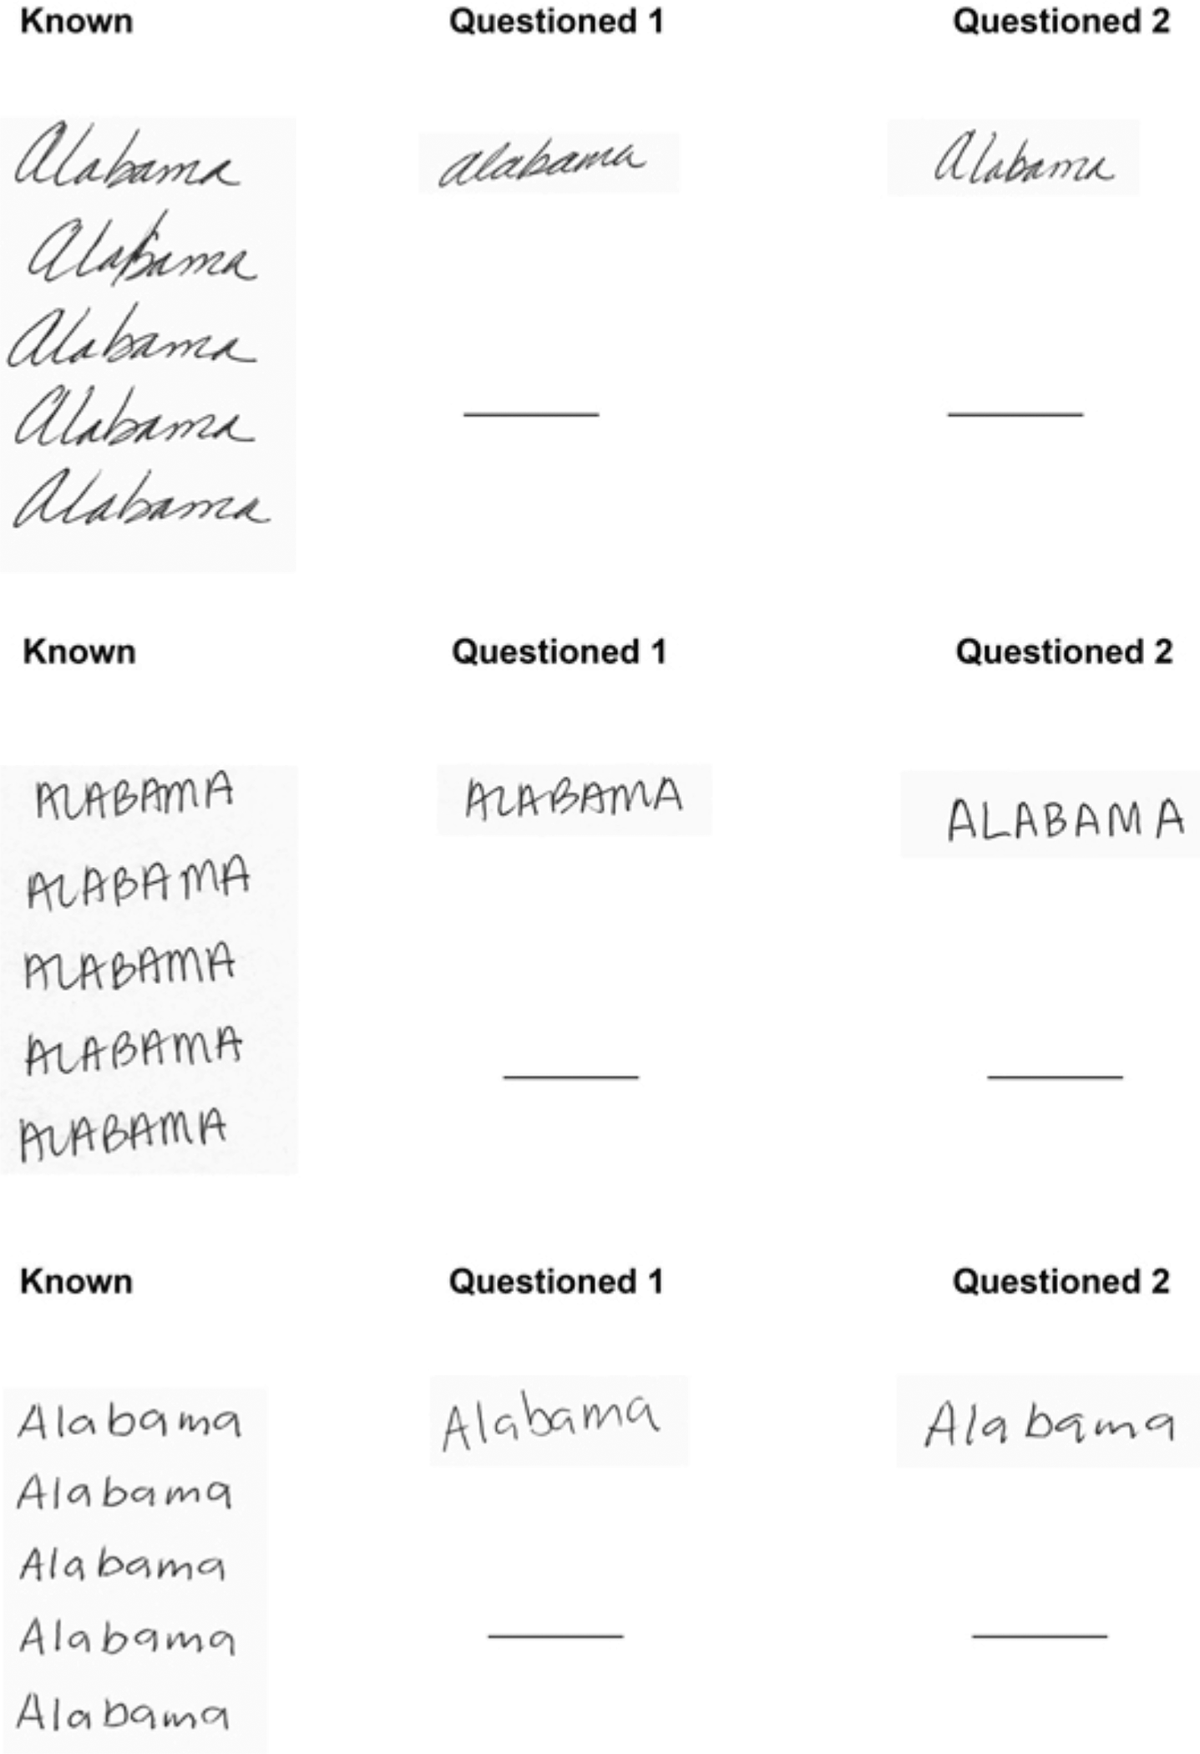
Figure 1.
Sample scoresheets showing 5 known specimens (left) and two questioned specimens for cursive (top), block (middle), and script (bottom) handwriting.
Table 2.
Absolute Z-scores for differences in kinematic parameters between K and Q samples for the true accept and true reject classifications for cursive, block, and script style handwriting. Shown are those parameters with p-values ≤ 0.10 for difference tests between accept and reject opinions.
| Stroke Direction | Parameter | Accept | Reject | Statistic |
|---|---|---|---|---|
| Cursive | ||||
| Up | Straightness Error | 0.23 (0.12) | 0.81 (0.76) | t=2.10 (p ≤ 0.05) |
| Up | Peak Velocity | 0.23 (0.14) | 0.48 (0.31) | t=1.99 (p < 0.10) |
| Up | Pen Pressure | 0.55 (0.32) | 1.92 (2.08) | t=1.83 (p < 0.10) |
| Down | Peak Velocity | 0.19 (0.15) | 0.51 (0.22) | t=3.35 (p ≤ 0.01) |
| Down | Pen Pressure | 0.75 (0.50) | 2.13 (1.76) | t=2.13 (p ≤ 0.05) |
| Down | Slant | 0.14 (0.11) | 0.37 (0.31) | t=1.93 (p < 0.10) |
| Block Print | ||||
| Up | Pen Pressure | 0.16 (0.10) | 0.46 (0.23) | t=3.24 (p > 0.005) |
| Down | Pen Down Duration | 0.13 (0.09) | 0.32(0.26) | t=1.82 (p < 0.10) |
| Script Print | ||||
| Down | Peak Acceleration | 0.36 (0.32) | 0.84 (0.63) | t=2.13 (p < 0.05) |
| Down | Pen Pressure | 0.26 (0.24) | 0.65 (0.61) | t=1.75 (p > 0.10) |
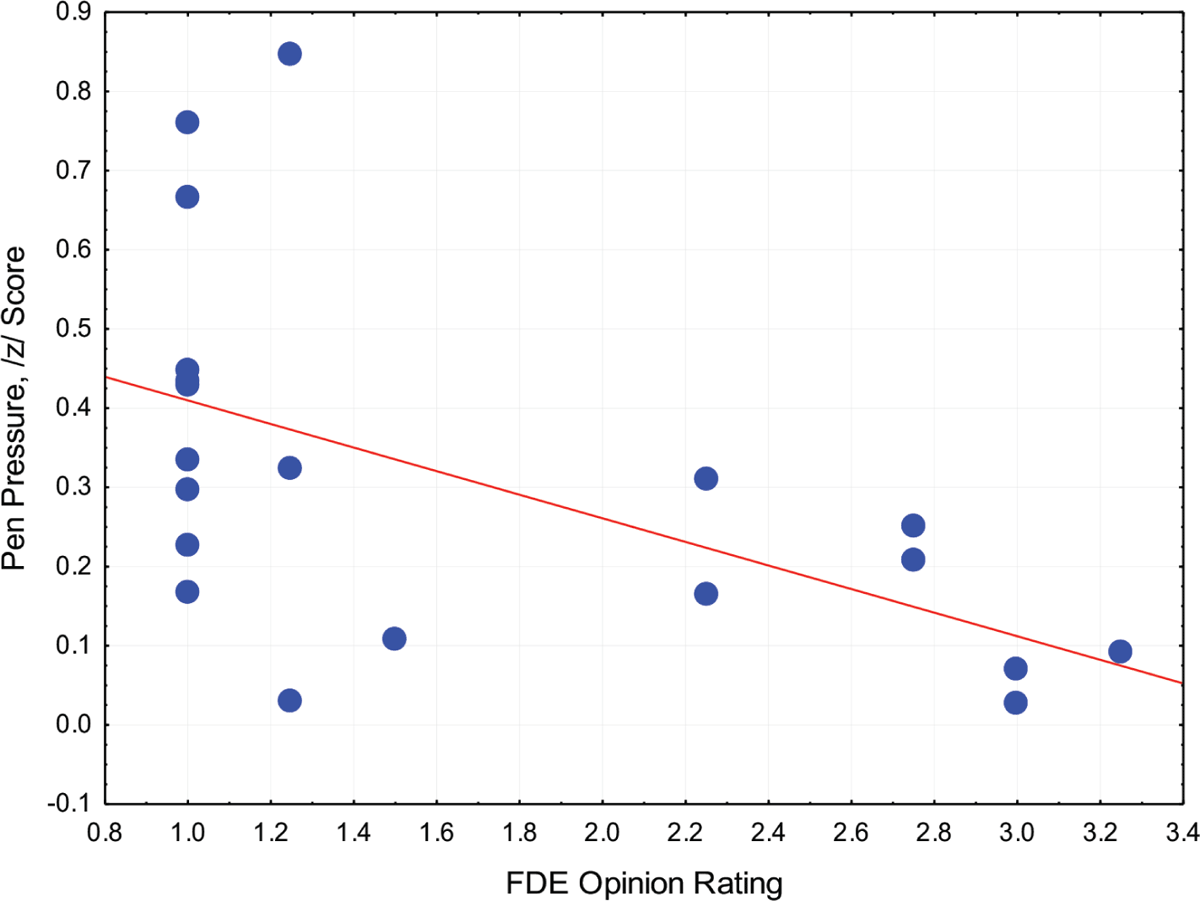
Figure 2
Scatterplot of the relationship between standardized difference score (z) and FDE opinion rating for pen pressure from cursive downstrokes. Shown in the graph is the line of best fit derived from a linear regression model.
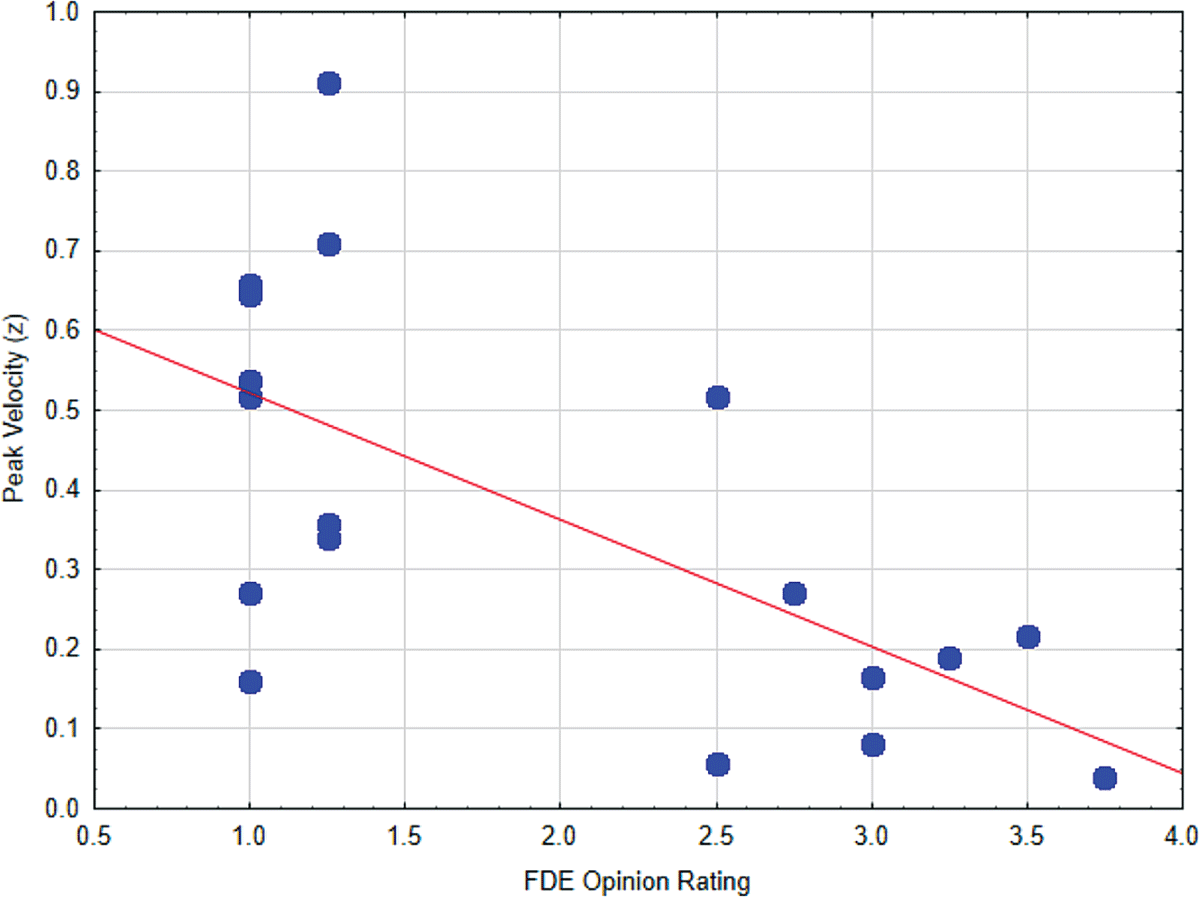
Figure 3
Scatterplot of the relationship between standardized difference score (z) and FDE opinion rating for peak velocity from cursive downstrokes. Shown in the graph is the line of best fit derived from a linear regression model.