
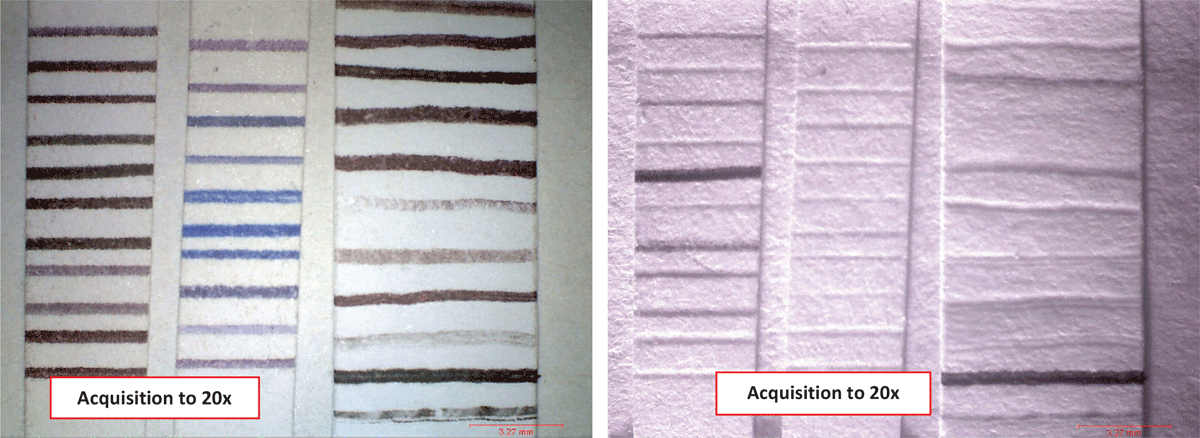
Figure 1
Detail of a series of inks: in the visible spectrum with diffused lighting on the left and in the NIR with a strong grazing light on the right, with an orientation of the light beam from south to north.
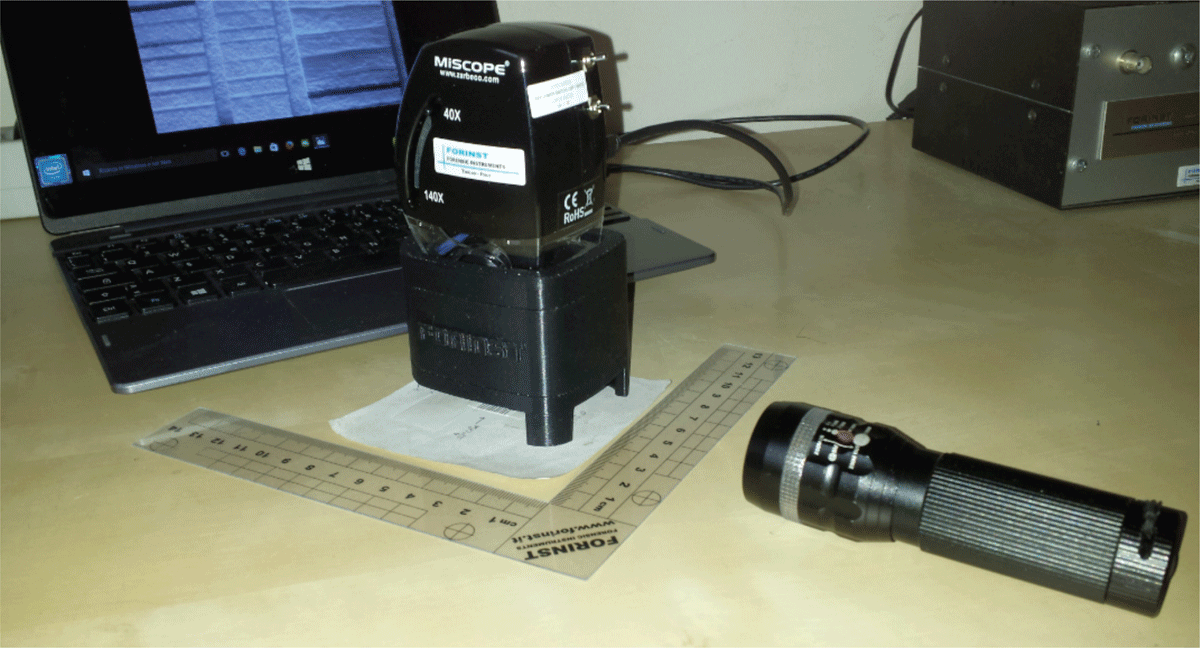
Figure 2
The multispectral digital microscope used to acquire the images shown in Fig. 1.
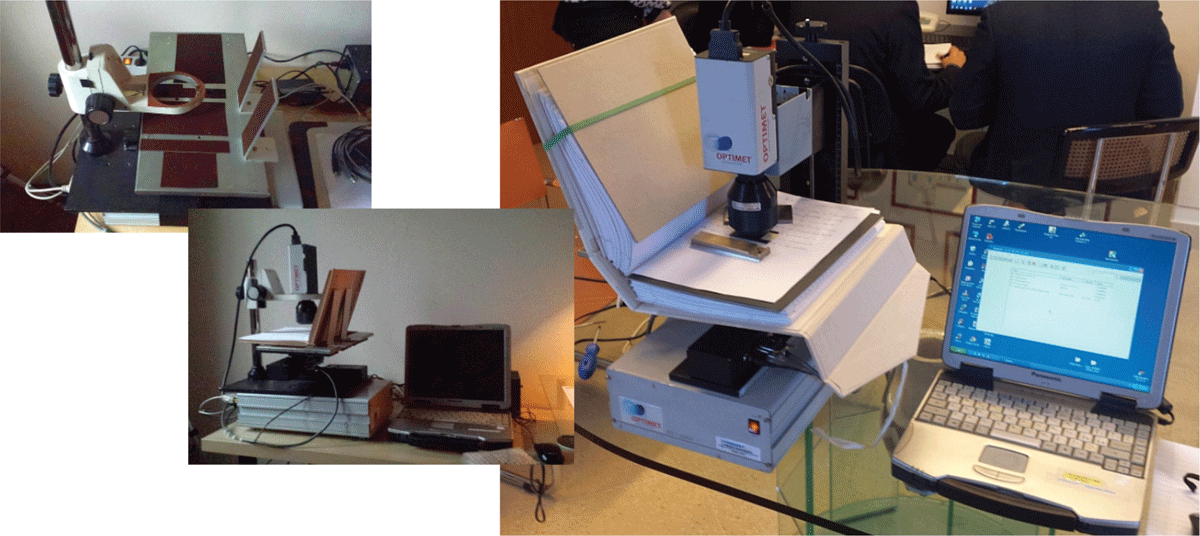
Figure 3
The 3D portable units for scanning directly from a courtroom, a notary’s office, and so on.
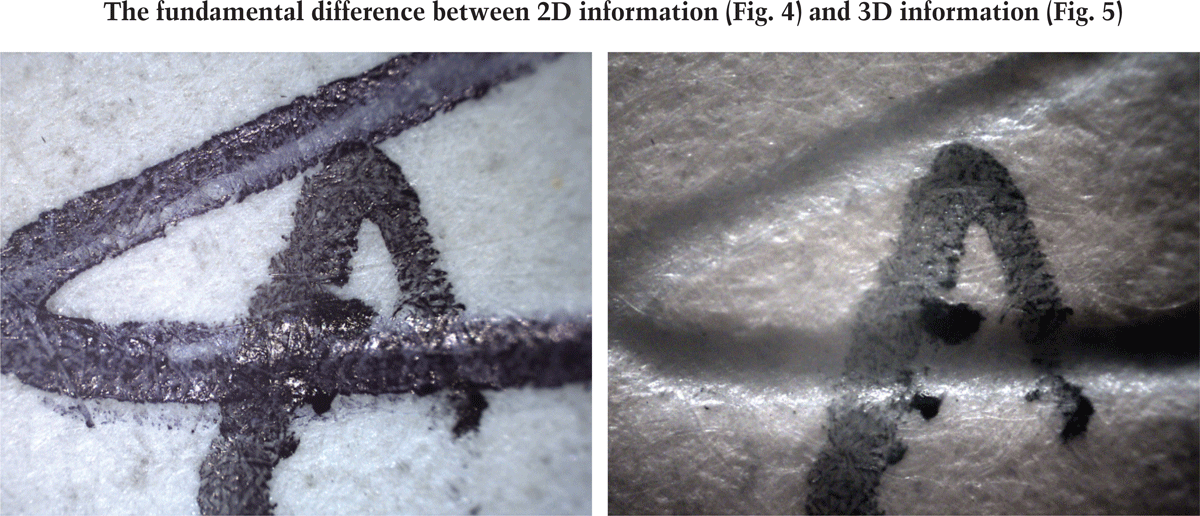
Figure 4
The fundamental difference between 2D information and 3D information.
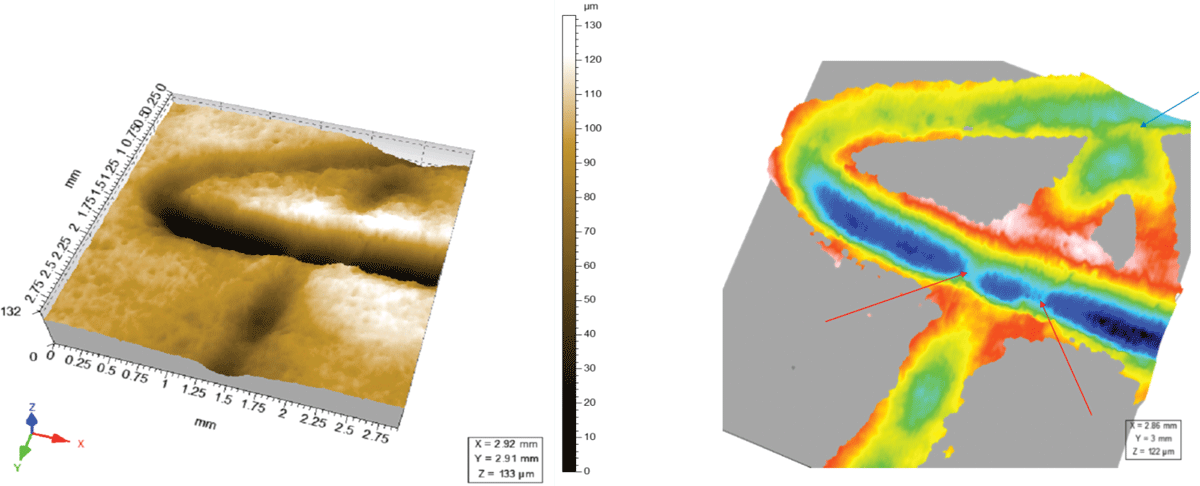
Figure 5
Detail of the intersection point between the two graphic elements referred to in Fig. 4 as a result of a 3D scan of the same object.
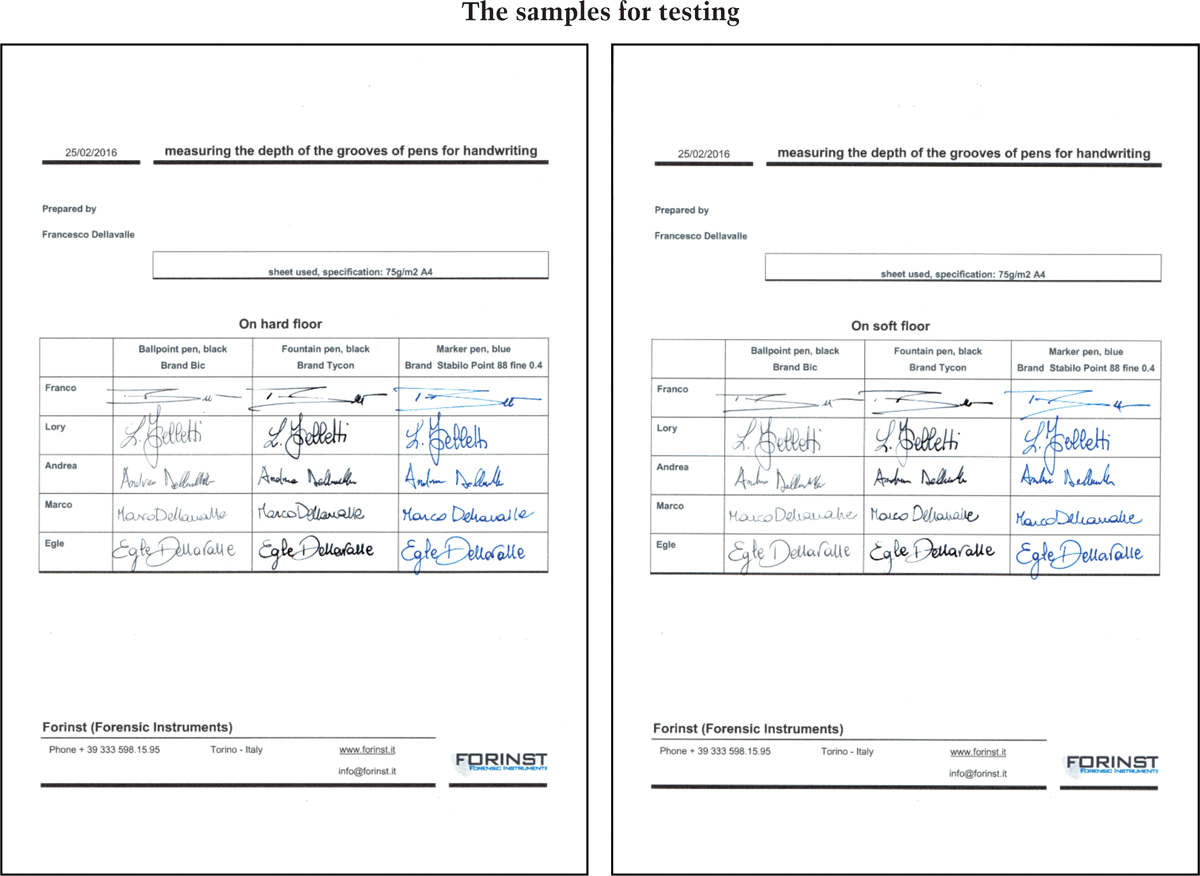
Figure 6
The two sheets used to perform the test.
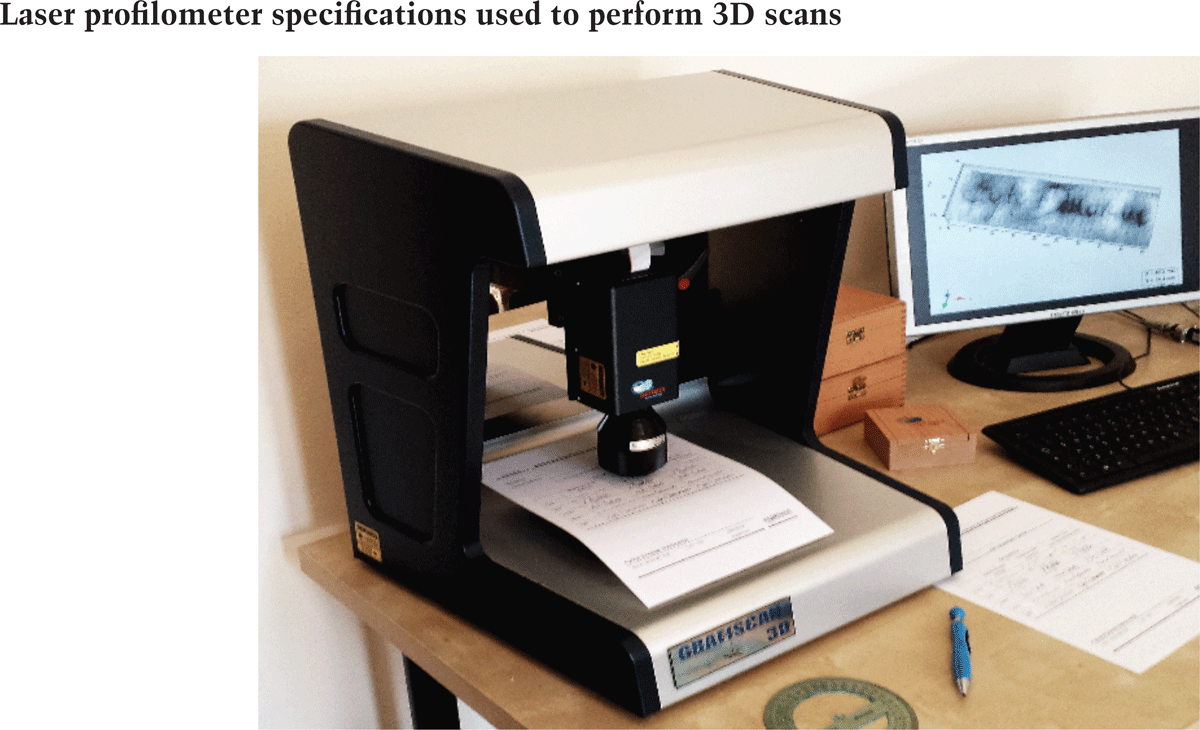
Figure 7
The Conoscan 4000 scanning system, (also called Grafiscan 3D by the author) used to perform the measurements.
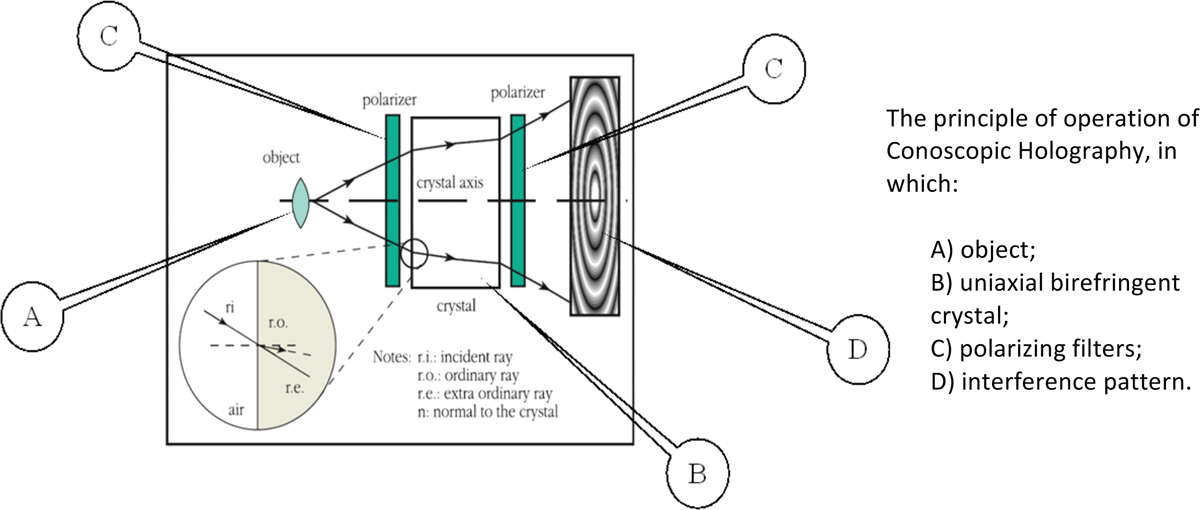
Figure 8
Block diagram of the measurement based on a Conoscopic Holography system.
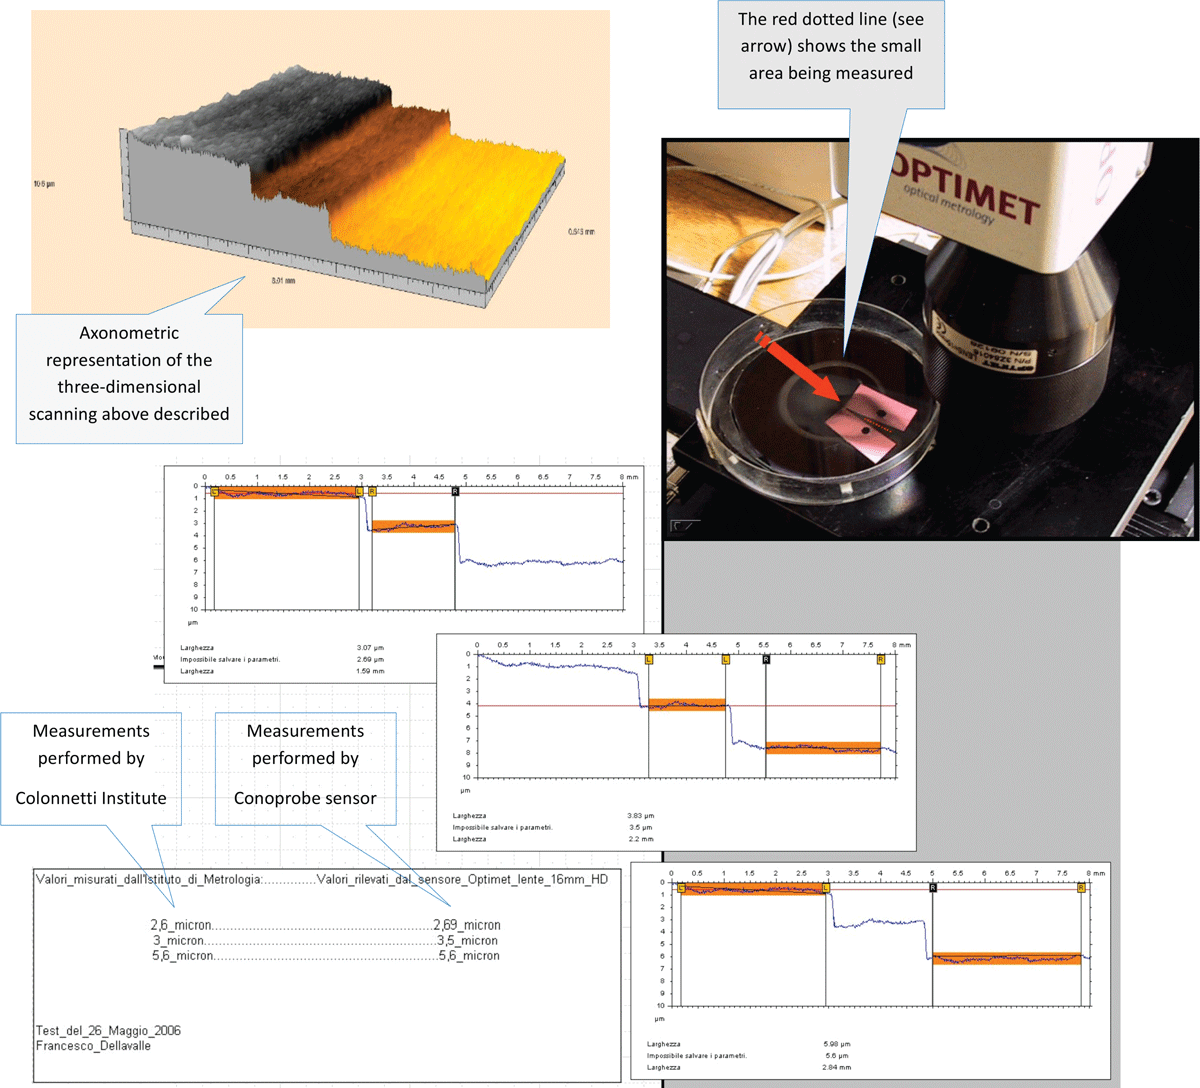
Figure 9
The measurement of the reference sample of the Metrology Colonnetti Institute in Turin.
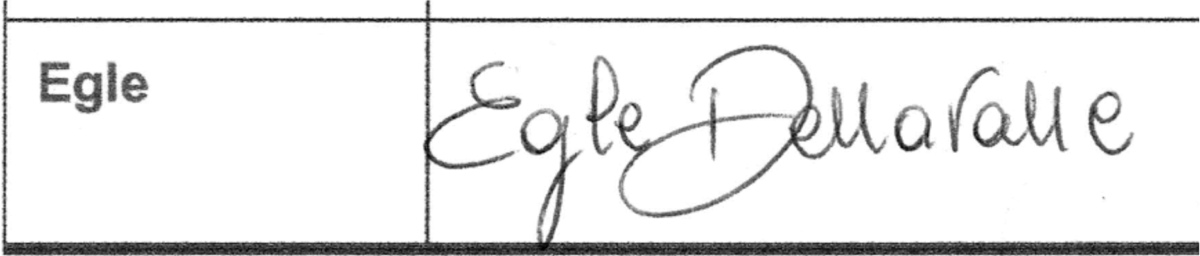
Figure 10
The target acquired by traditional 2D scanners.
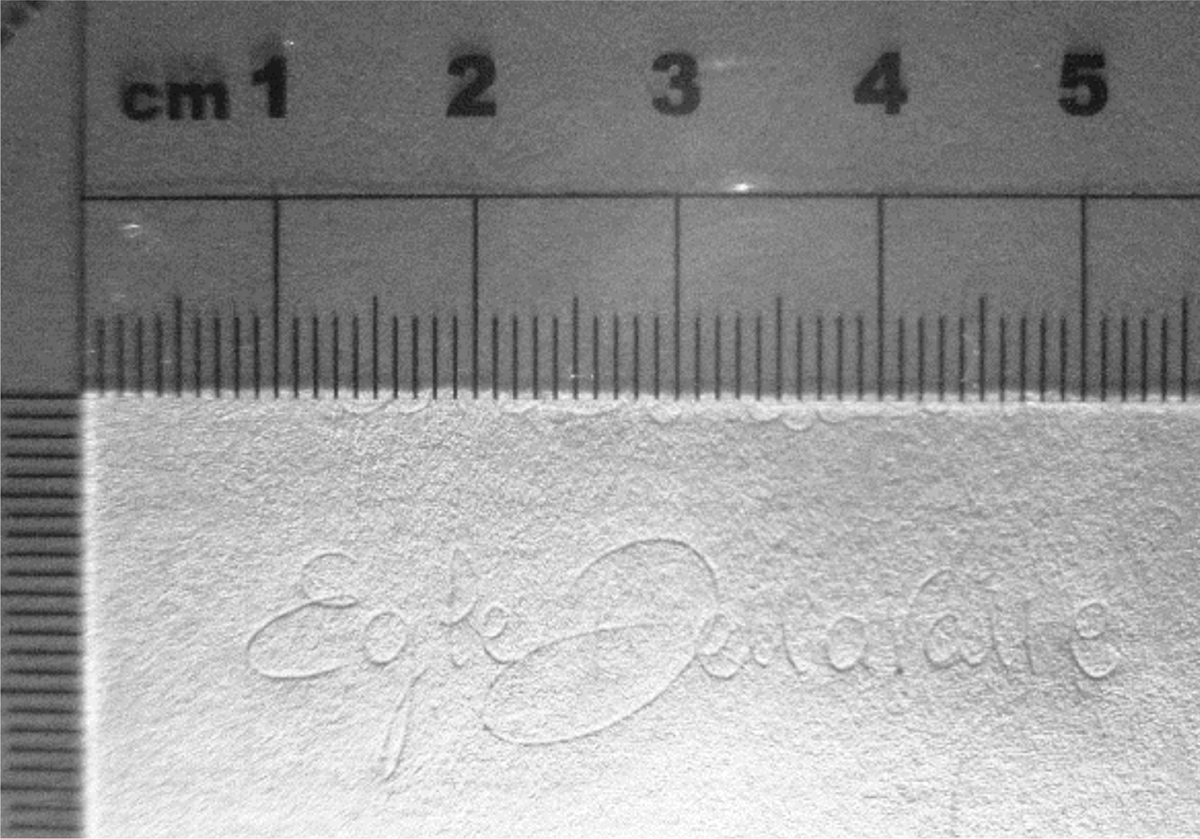
Figure 11
The target acquired with a strong grazing light NIR radiation.
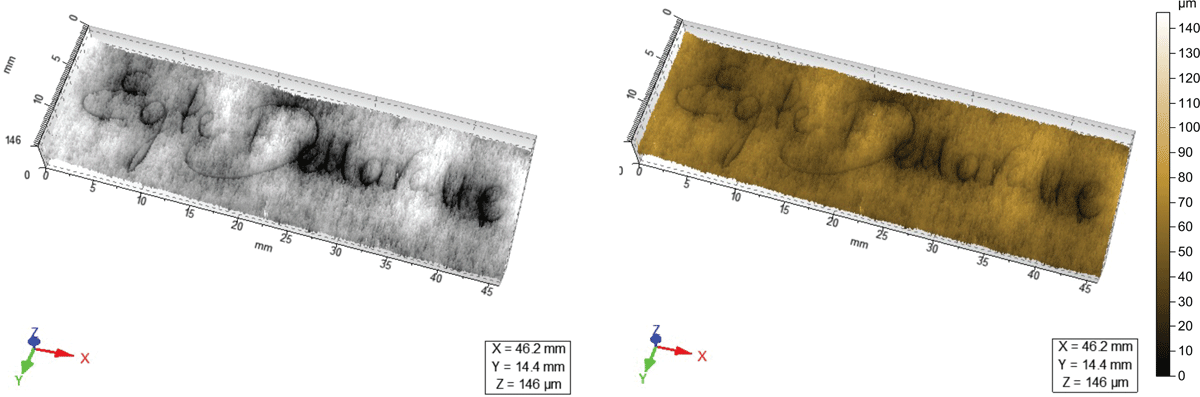
Figure 12
The same target of Fig. 10 acquired by 3D scanners.
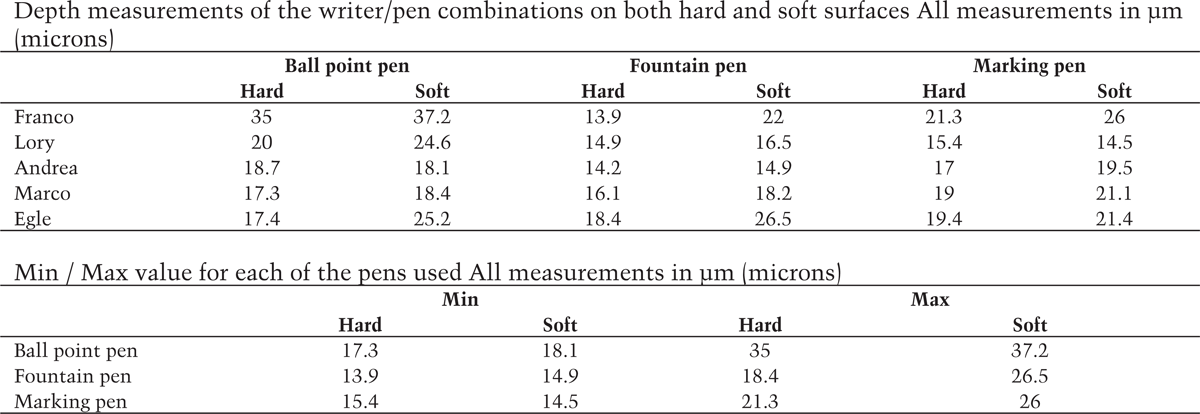
Figure 15
Final table describing the results obtained
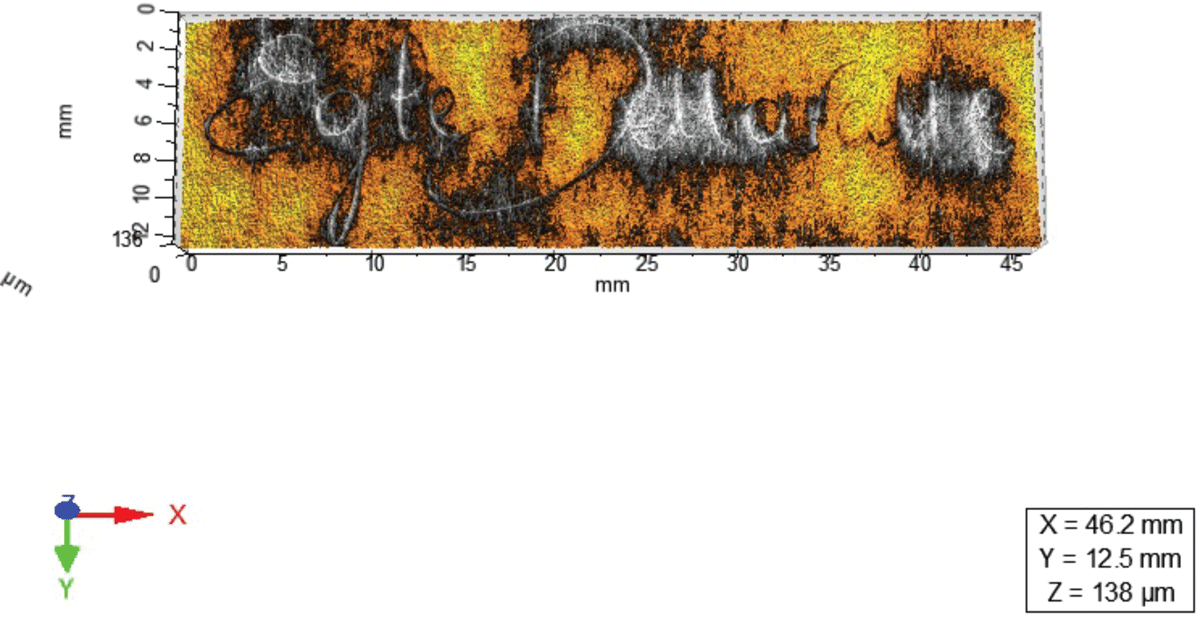
Figure 13
The same target as that of Fig. 10 acquired by 3D scanners.
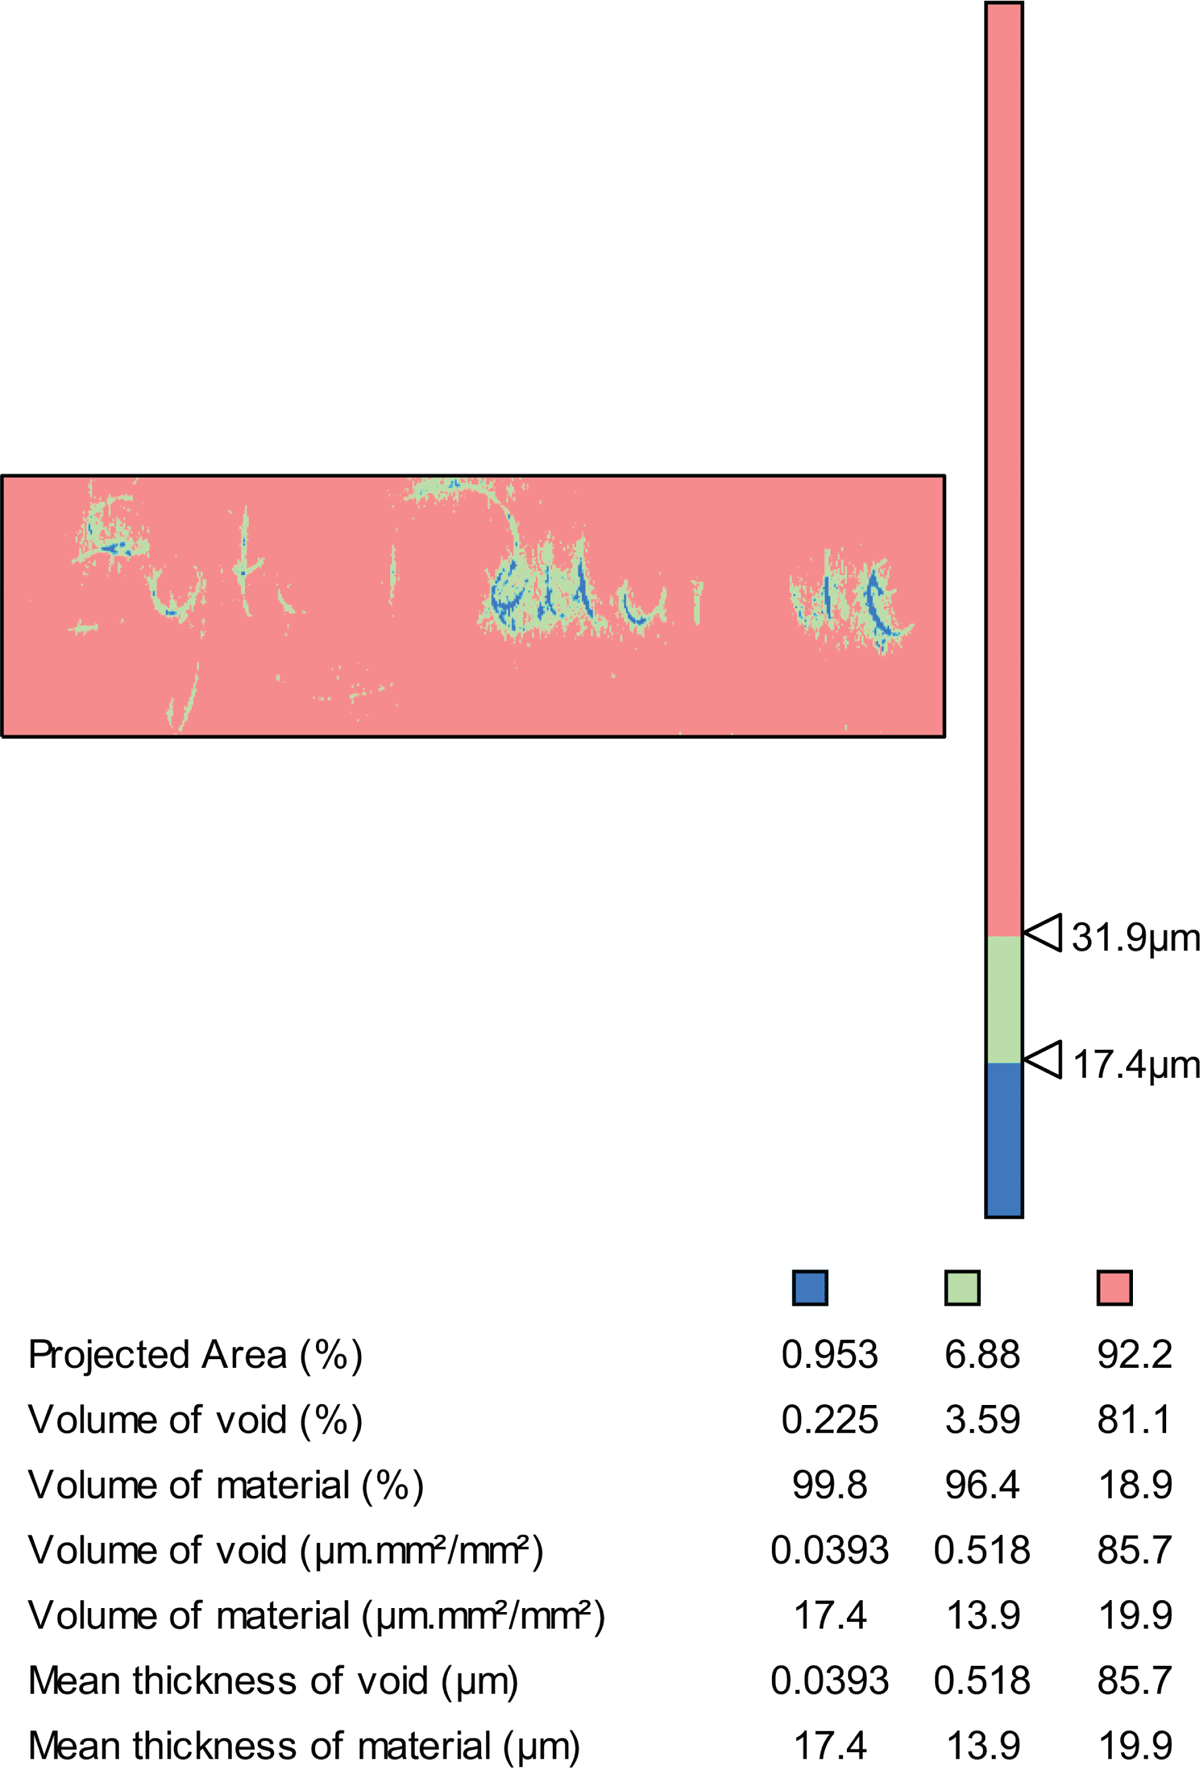
Figure 14
The measure of “Slices” in the Egle signature.
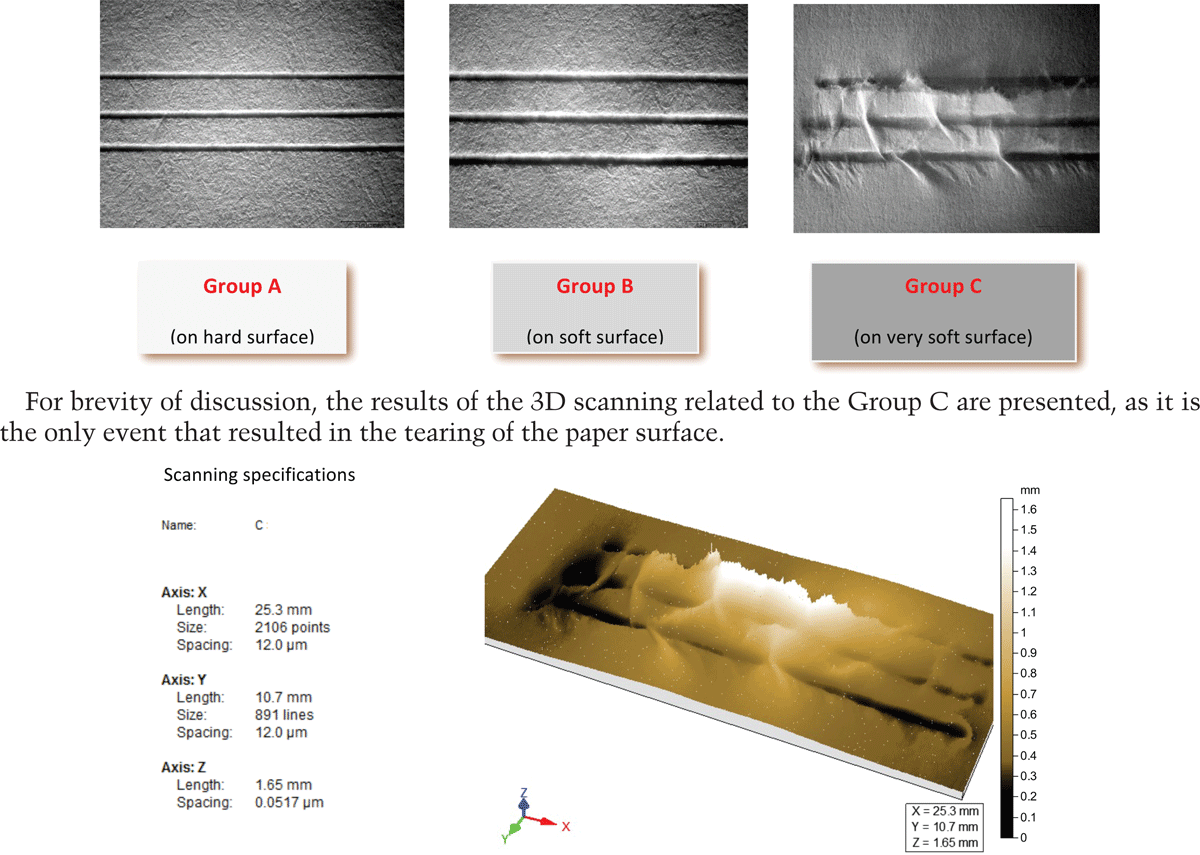
Figure 16
Group C acquired by 3D scanning.
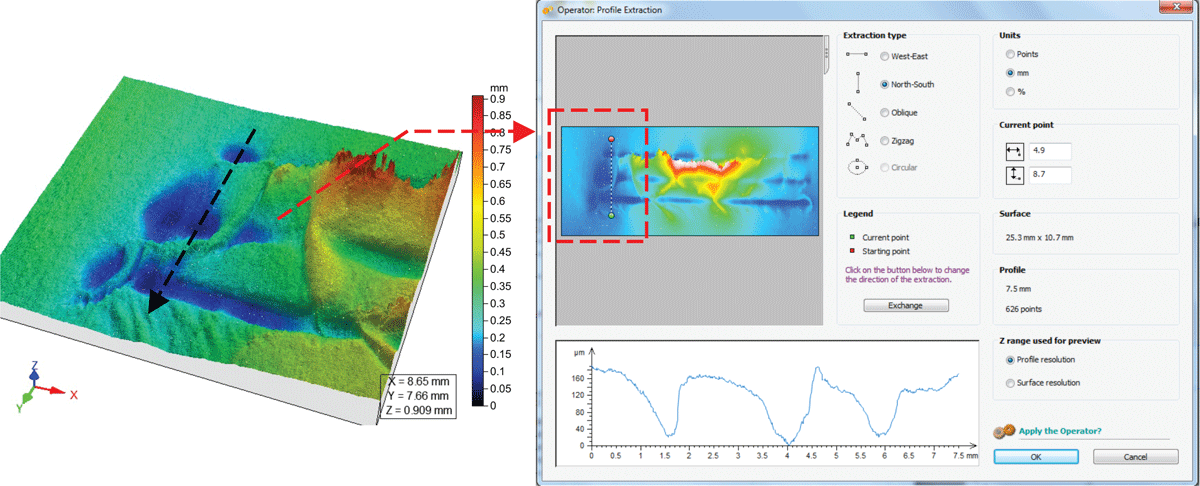
Figure 17
Extrapolation of a profile in the C Group acquired by 3D scanners.
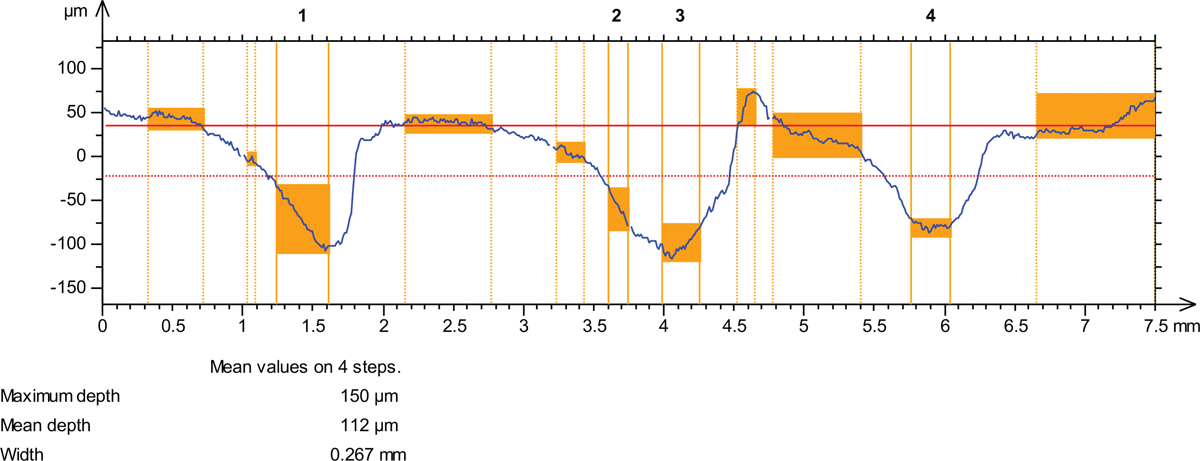
Figure 18
Extrapolation of a profile in the C Group acquired by 3D scanners.
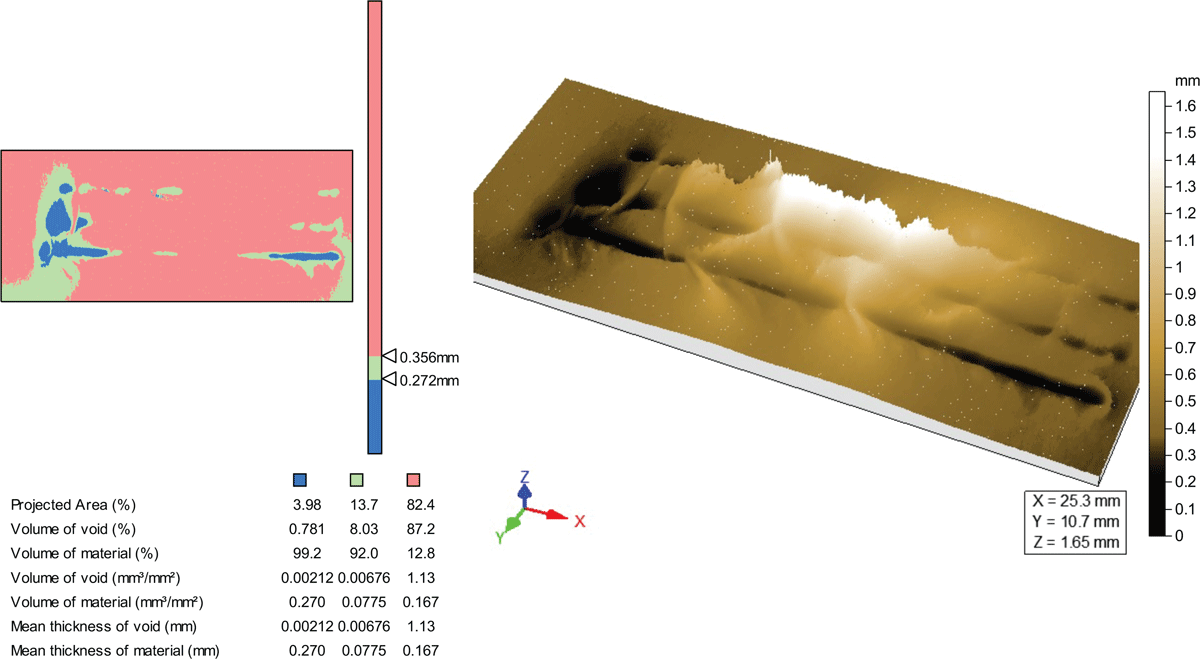
Figure 19
The measure of “Slices” in Group C.
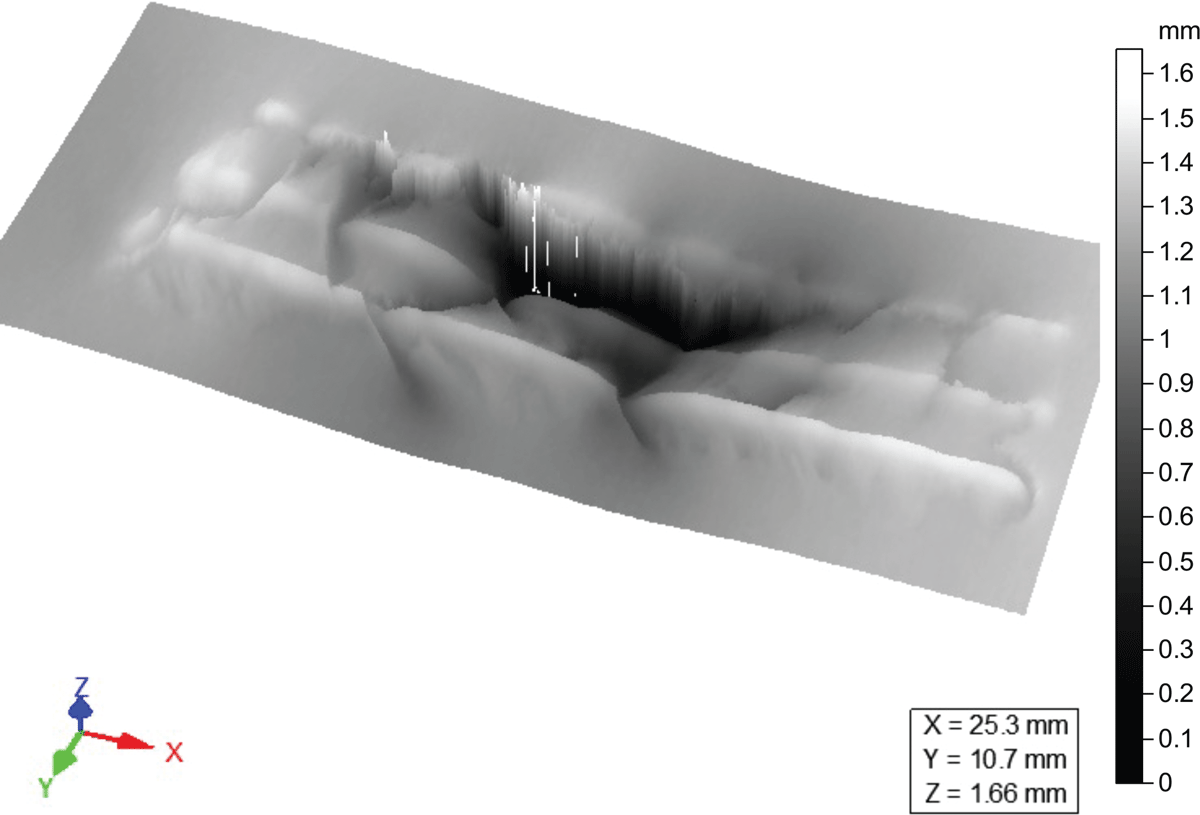
Figure 20
The cloud of points of Fig.16 with the measured depths reversed on the azimuthal axis.