
The case
In 2013 a judge addressed one of the authors for specialist technical advice and requested the following:
“Instrumentally determine the pressure delivery applied to the check signature under investigation in order to ascertain whether the signature had been affixed by a human hand or by mechanical means, since a deep incision of the paper fibers was observed, though the tool used was a broad-tip marker.” [1].
The author decided to tackle the problem starting from the following hypotheses:
It is well known how a handwriting executed on paper from a pen used for handwriting deforms the paper fibers [2].
This deformation creates a groove in the sheet, sometimes also noticeable to the naked eye, especially on the opposite side of the same sheet, where the convexity is clearly perceptible.
In the majority of cases, the technique used to observe the grooves for the purpose of establishing their indentation is achieved by means of optical microscopy with medium illumination and/ or strong grazing light with respect to the paper sheet [3].
A barrier, however, is represented by the ink released from the pen, which in most cases “hides” the groove.
To better understand this important detail, suppose you want to measure the depth of the bed of a mountain stream after a violent rainstorm: the water turns brown and prevents us from seeing the bottom of the stream. The problem, therefore, is to “remove” the water (which in our case is obviously represented by the ink of the pen), to observe how deep the stream bed is (namely, the indentation that the stream produced in the ground).
To facilitate the operation, a simple and effective technique is used: reflective IR with grazing light.
With the paper strongly illuminated by grazing light of infrared radiation with an emission peak of at least 680 nanometers (however it is better if the source is in the NIR exceeding 800 nanometers), in the most cases, the handwritten inks disappear (especially the blue ones), as the dyes or pigments of the ink compounds do not absorb the infrared radiation. This same phenomenon also happens for some of the darker colors (black, etc.).
A test sheet was created which contained a series of black inks from ballpoint pens on the left, a series of blue ballpoint inks in the center, and on the right, a series of black inks from other types of pens (e.g., marker pens). The three strips of ink have been previously cut out of a sheet of paper, and then pasted together, onto another sheet. This in order to have in a narrow area a considerable number of inks to be analyzed. Fig. 1 shows images of this test sheet in the visible spectrum and in NIR at 840 nm.
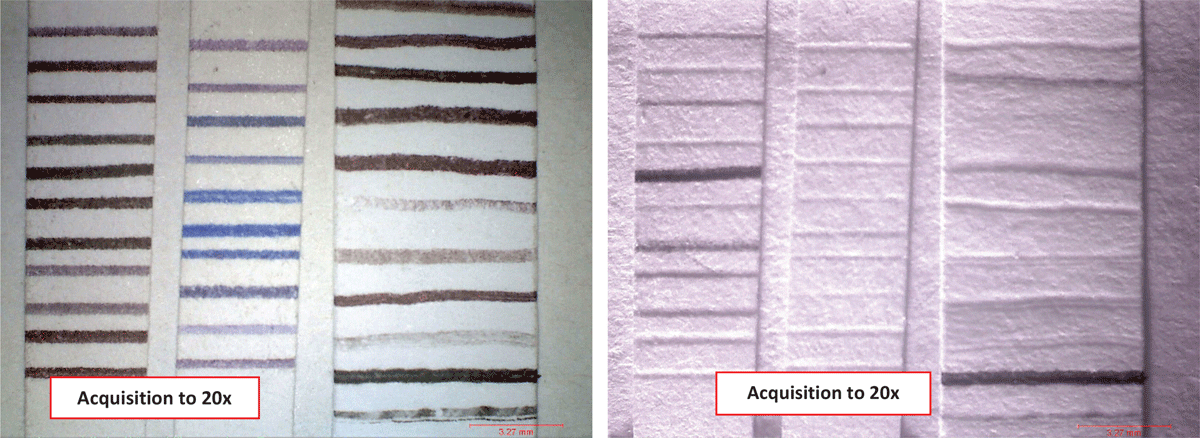
Figure 1
Detail of a series of inks: in the visible spectrum with diffused lighting on the left and in the NIR with a strong grazing light on the right, with an orientation of the light beam from south to north.
It is easy to observe that:
All the blue inks “disappear” from the image, while some of the black ones (generated by ball pens and markers) disappear only partially and/or do not disappear at all;
In all cases in which the inks “disappear” from the image, it is possible to clearly observe the presence of grooves and the pressure variations among them.
Fig. 2 shows the digital portable microscope [4], used to acquire the multi-spectral images shown in Fig. 1. The picture also shows a flashlight equipped with a condenser lens for varying the focus of the light beam in the NIR through a Power LED 1 watt, with emission peak at 840 nm.
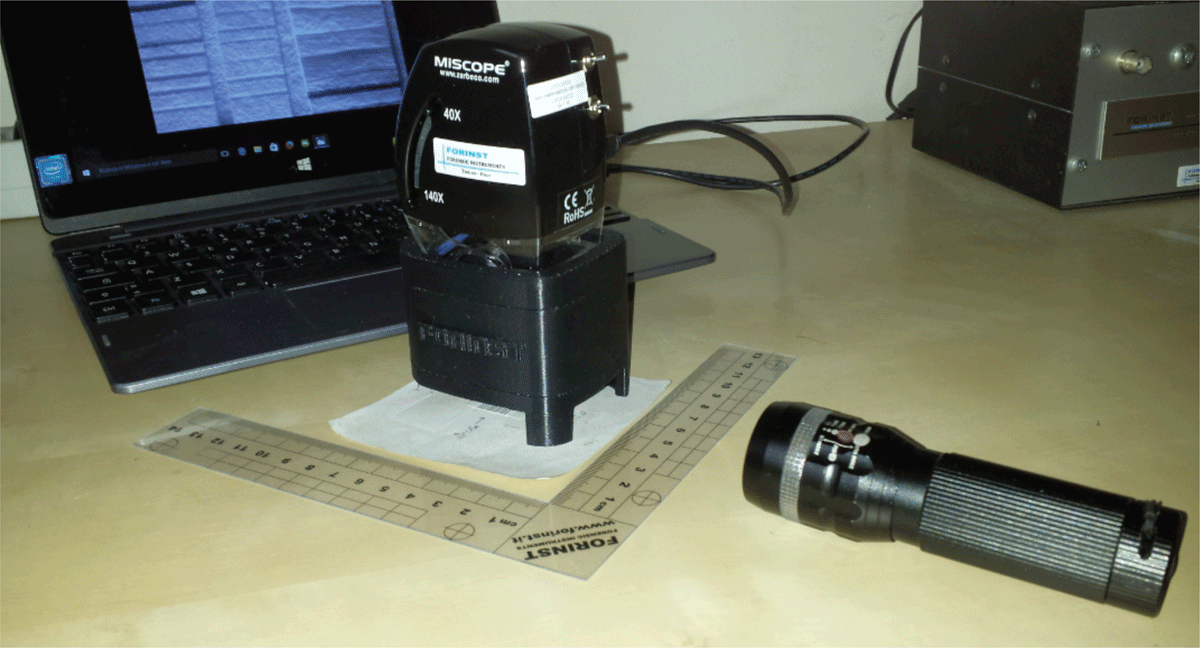
Figure 2
The multispectral digital microscope used to acquire the images shown in Fig. 1.
While this methodology is an effective way to image the grooves present in handwriting, another tool is needed to measure the depth of the grooves generated by the tip of the pen.
Solution
The case presented was solved with the use of a 3D laser profilometer, as described below.
Laser profilometry was necessary in order to detect the measurements along the third axis (Z) to evaluate not only the depth of the grooves in high definition, but also the pressure variation along the entire handwriting that emerged from the path of the pen tip.
The measurement instrument, which has proved particularly suitable for this application, is the 3D Grafiscan, or the apparatus called Conoscan 4000 developed by Optimet [5] to measure profiles with sub-micron resolution.
The apparatus was appropriately customized by the author to operate with any type of paper texture and graphics, both in handwriting and print, by executing a series of experiments with the use of dozens of different pens for handwriting and numerous mechanical print media (business machines).
However, the sensor had to be modified in order to work properly on any type of graphic elements (in handwriting and in print).
The change consisted of:
Adding a polarizing filter in the optical path inside the Conoprobe device (between the Optimet’s custom lens and the sensor). This arrangement modification was necessary to limit the “spike” (i.e.: points not measured) because it was too reflective, as in the case of a very dense ball pen ink (yet still “liquid”), or in the case of particular types of toner, which are extremely reflective;
Mechanical modification, which involves holding as “flat” as possible the paper sheet surface area, whose target must be scanned in 3D because when you use the 16 mm lens—to work in Hi Res mode—the maximum working range is 0.2 mm. Below this working range, along the Z axis, the sensor does not measure anything. This happens quite frequently, especially when the surface of the document to be scanned is wrinkled, folded, and in poor condition; it is much easier than the height in Z of the sheet (even only in a small area to be scanned in 3D) exceeds 0.2 mm. The author currently uses two 3D units: the Optimet Conoscan 4000 (for use only in the laboratory) and the remaining unit, opportunely customized and lightened mechanically, to perform the scans directly in a courtroom, a notary’s office, or similar location away from the laboratory. In the latter case, the author had to make a further mechanical support to hold a notarial book (open) on the motorized axes: see Fig. 3.
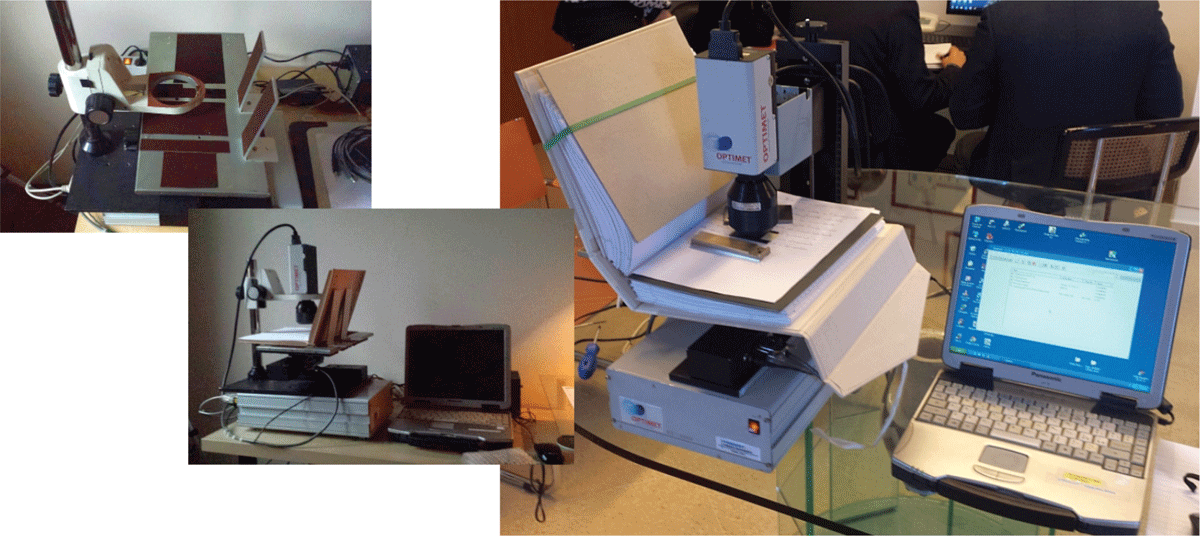
Figure 3
The 3D portable units for scanning directly from a courtroom, a notary’s office, and so on.
The results were excellent and two practical examples (limited to graphs plotted in handwriting) are shown and discussed to demonstrate the potential of the technique.
Introduction
The 3D technique has been widely used in the past by the author for both industrial and scientific applications. In 2003 a paper on the time sequence between signatures / texts in case of intersecting between two graphic elements was explained [6].
The application consisted of the 3D analysis of the points of intersection between two pen strokes using Conoscopic Holography [7]. This method1 was also subsequently the subject of research (Schirripa et al. [8]).
Fig. 4 shows an example of an image of two handwritten strokes that intersect each other. The left one was acquired in the visible spectrum of diffused light, while the right one in NIR mode with a radiation beam from south to north. What is observed in the second image is the following detail: one of the two inks “disappears” completely, thus giving clear evidence of the presence of a deep groove. Conversely, the ink that is visible complicates the assessment of the second groove.
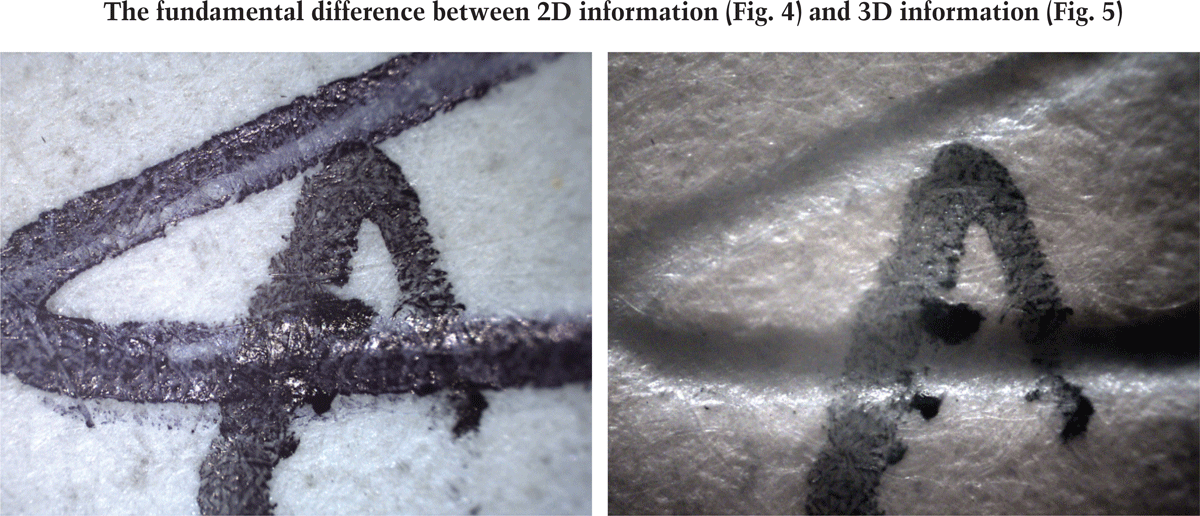
Figure 4
The fundamental difference between 2D information and 3D information.
The images of Figure 5 was acquired using the Grafiscan 3D system. The result of the scan is a “cloud of points”, where the Cartesian coordinates X, Y and Z of each point acquired by the paper texture were converted into an axonometric representation. Thanks to the high detail obtained by this instrument, now you can easily observe the following:
the significant disparity of depth between the two grooves (see the Left Slide in a brownish hue)
the time sequence of affixing (see Right Slide, pseudo color): the lightest track was penned second: see the two small ridges indicated by the arrows, blocking the “river bed” represented by the groove of the second section. There is also a further—but just as important detail—to confirm what has already been seen: the second portion of the path “invaded” the groove of the first section, forming a small loop at the point indicated by the arrow in blue.
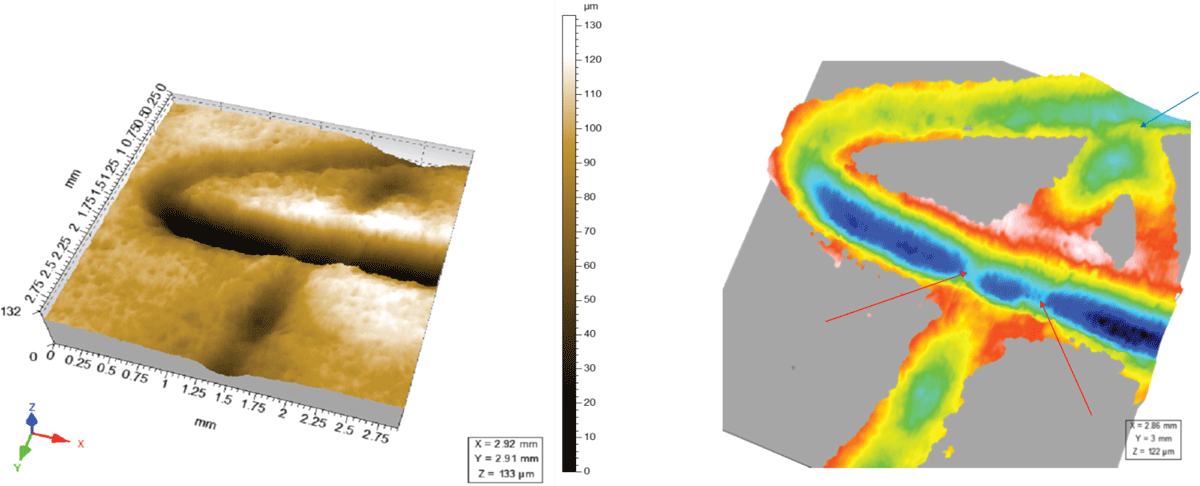
Figure 5
Detail of the intersection point between the two graphic elements referred to in Fig. 4 as a result of a 3D scan of the same object.
The Method
To perform comparative measurements of the manuscript grooves’ depths, the author used five signatures made by five different writers (the author, his wife and three children, one of which is left-handed), as follows;
Each person signed with three different writing instruments: a ballpoint pen, a fountain pen and a fine-tipped marker;
The signatures were affixed to two sheets of white paper: on the first sheet, the writings were perfomed on a hard surface (a desktop of lacquered wood), on the second sheet, the surface was softer (five blank sheets of paper were placed below it).
Figure 6 shows/illustrates the sheets on which the signatures were collected: two sheets of white paper A4 format 80 gsm, referred to as Sheet Type A (placed on the hard surface) and Sheet Type B (placed on a softer support surface).

Figure 6
The two sheets used to perform the test.
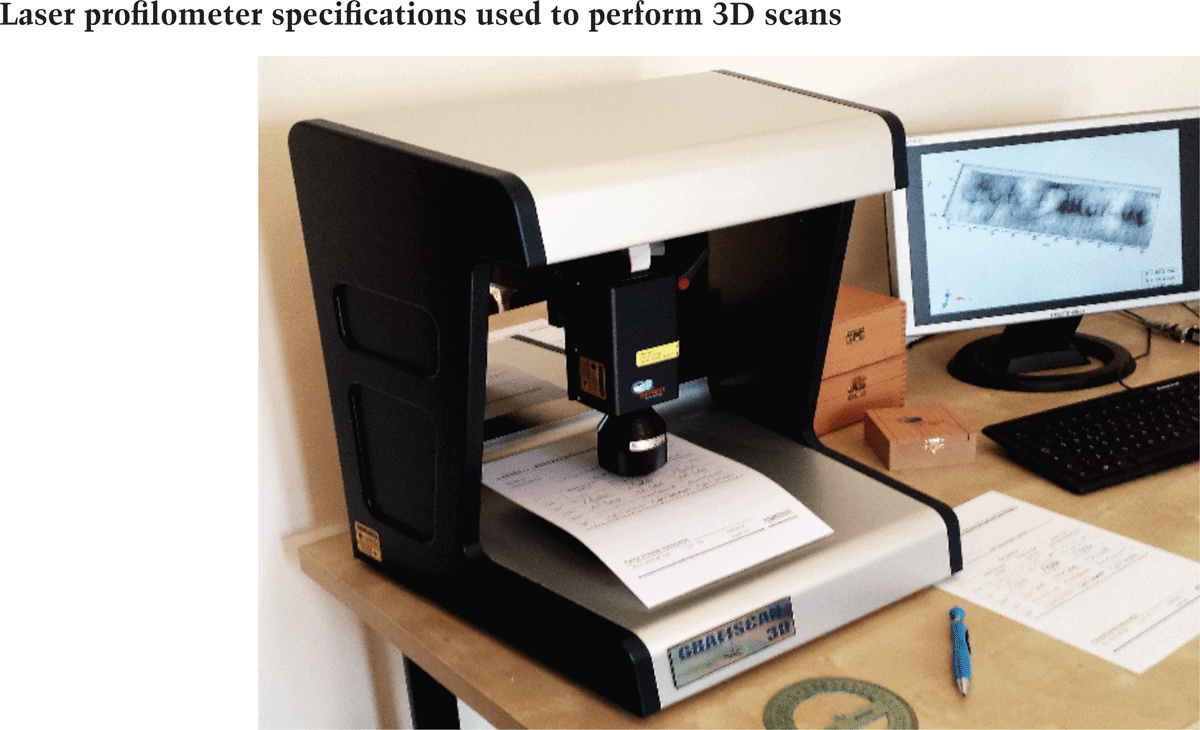
Figure 7
The Conoscan 4000 scanning system, (also called Grafiscan 3D by the author) used to perform the measurements.
Working principle of the Laser profilometer:
The sensor (appropriately optimised for this specific application) allows detecting the superficial paper texture and returning the coordinates acquired in the form of “point cloud” (triads in space X, Y and Z, where Z is the coordinate representative of the height/depth of the grooves with respect to the paper).
The interferometric system essentially consists of an opto-electronic measurement head connected to an X-Y translation system with two motorized mechanical axes of precision and a third driven axis (for handling the Z axis), in order to facilitate the correct setting of the operating distance between sensor and target. The choice of the size and relative area for setting up the scanning of the paper texture is made through a camera built into the instrument. The processing unit (PC) handles the movement of the head along a straight line and the point-by-point recording of the surface elevation value. The threedimensional maps are derived by examining the area of interest along equally spaced parallel lines.
An equipment kit: three software modules for managing motorized axes and a measuring head, an export point cloud, result processing, image printing and measurement report. The physical principle on which the system bases its operation is conoscopic holography.
The analysis method
Regarding the “point cloud”: 3D basics [9]
A three-dimensional object is, as the word says, defined on three Cartesian axes X, Y and Z, i.e. height, width and depth. The difference between 2D and 3D is very simple, a 2D image is the photograph of an object, 3D image is the object itself. In the state of the art to insert a 2D image into a computer, simply use a scanner or a digital camera.
Instead, to insert a 3D image into a computer, you need to rebuild the object in all its features, in other words, to do a “round” of the object within a computer. To make such an appearance so complicated there are many 3D modeling software (3D Studio Max, Maya, Lightwave 3D, etc.).
We can also easily clarify some concepts that are the basis of a 3D image or format or model.
File format: three-dimensional files have an extension (OBJ, 3DS, MAX, MTX, MTS, IGS, STL, etc.) whereas two-dimensional files have properties (GIF, JPG, TIFF, BMP, PSD, etc.).
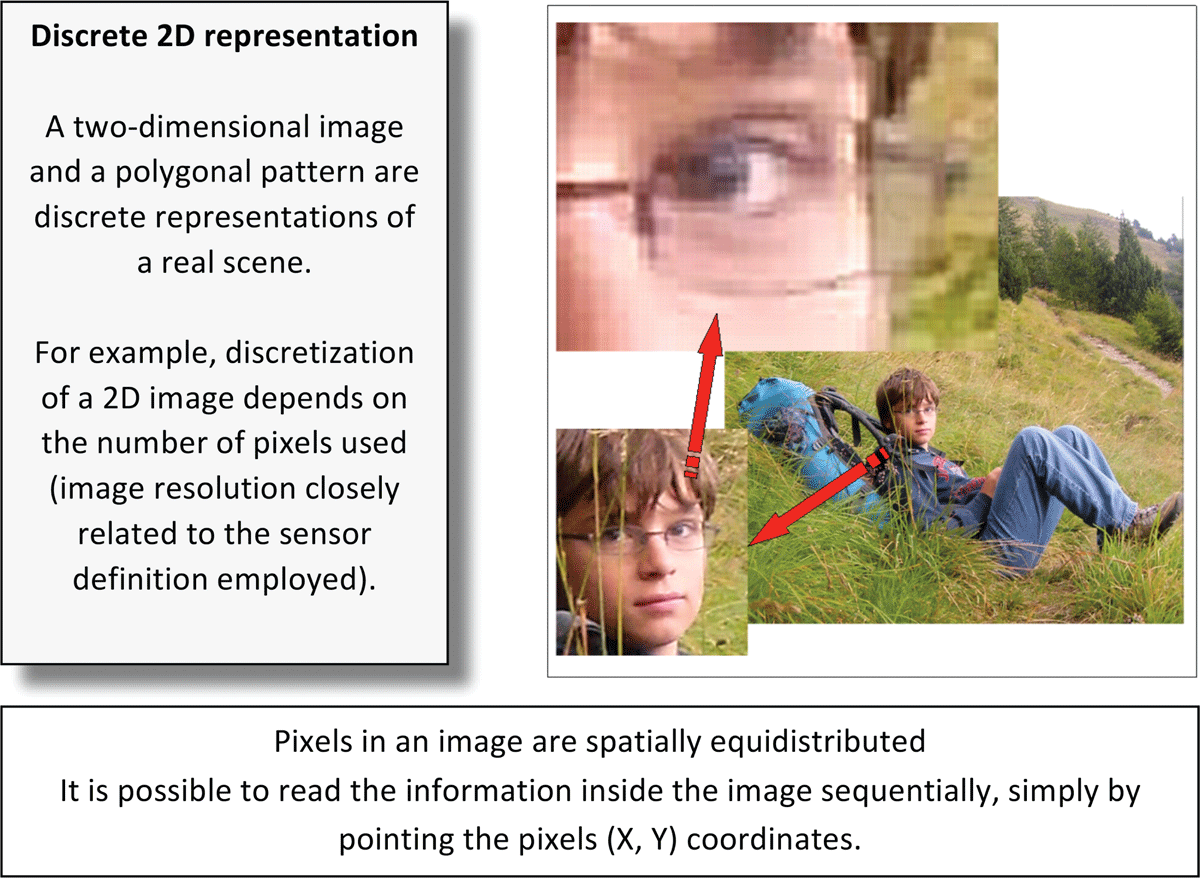
File Size: A 3D file has a “weight” expressed, as for a two-dimensional image, in KiloByte, MegaByte, or GigaByte.
Number of polygons: The minimal unit that makes up a 3D object is polygon (as for a 2D image it is Pixel); A polygon is a triangle defined by three vertices, three sides, and one face, to draw a parallelepiped (which has six faces) then two triangles per face (form a square face) for 6 faces, so 12 polygons. A polygon can be of variable size, small or large, without affecting the size of the file.
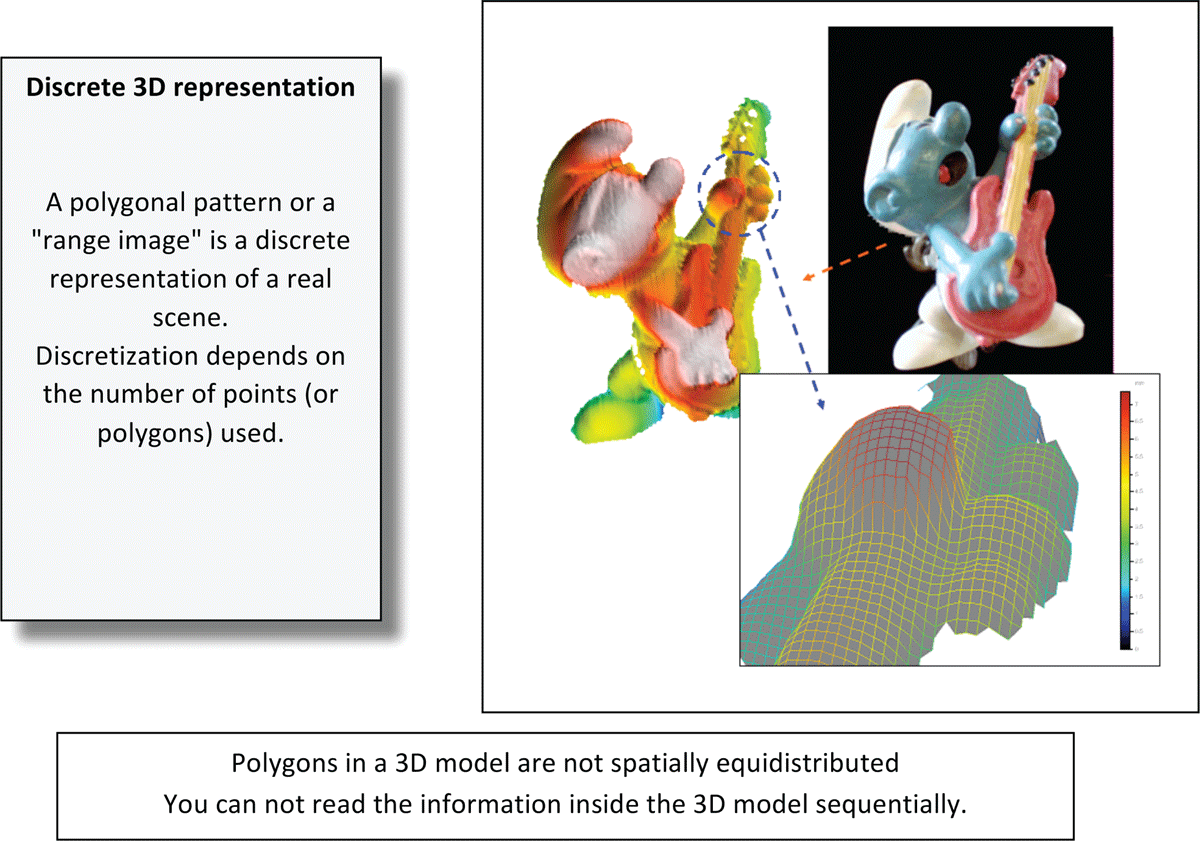
The example refers to the 3D scanning of a plastic puppet.
The magnification delimited by the circular area (dotted in blue) highlights the surface reconstructed according to the density of the acquired points (which are not spatially equidistributed).
Textures applied
A texture is a traditional 2D image named Bitmap; the same is applied on the face of a polygon to “color it”. The parallelepiped, which we first saw is made of 12 polygons, can be dressed with images. For example: To make a pack of cigarettes, we must photograph each face of the “real” package and apply it on each face of the parallelepiped, so we will get a pack of virtual 3D cigarettes.
In the case of a manuscript, it is sufficient to apply the “one face” three-dimensional representation, as easily deducible, from the side of the document where the script was written.
The increasingly evolving market introduces us new 3D applications for the virtual world every day. Just think of an online museum: yesterday web pages were created containing photographs of the museum and works of art, today (for example with Adobe Atmosphere software) you can create a 3D museum presentation, insert works of art within virtual space and lead the visitor through the rooms as if he were really present in the museum itself.
Compared to the above example, in the case of three-dimensional reconstructions of the grooves generated by a writer tool, we will not speak of virtual 3D. On the contrary, the 3D reconstruction of the same should be done in the smallest detail in order to reflect (as faithfully as possible) the “reality” of the surface of the paper that has been the subject of 3D reconstruction, as we will see in more detail in the following pages.
The choice of a technique and a sophisticated tool is thus justified by the fact that other types of profilometers, such as those in optical triangulation or dynamic focusing (currently used in the industrial field), have proven unsuitable to examine types of surfaces and inks like the one in the investigation. In particular, these are not able to operate in the presence of strong variations of reflectance or profile slope (as in the case for example of micro intaglio prints on bills of exchange, the toner in relief generated by a laser printer or from a copier, etc.).
Conoscopic holography, on the other hand, easily allows you to scan the micro-reliefs (grooves generated by a writing implement) also in the presence of “gradients” up to 85°, that is, almost in the condition of grazing incidence.
The “Interferential Method” based on conoscopic holography
In the case of traditional holography, the hologram is the interference pattern generated by two coherent light beams, the reference and the object, which are propagated along different optical paths.
In conoscopic holography, a tiny spot produced by a laser diode operating in the visible spectrum is projected perpendicularly on the surface of the paper texture to be scanned. The backscattered radiation passes through a lens, a first polarizer and a birefringent crystal from which emerges the ordinary and extraordinary components. Passing through a second polarizer, they will interfere with each other, playing the same role as the object beam and the reference to classical holography.
In classical holography, a hologram is created by detecting and recording the interference pattern formed between an object beam and reference beam using a coherent light source. The object beam and reference beam propagate with the same velocity, but follow different geometrical paths, creating a Gabor Zone Lens (GZL). In conoscopic holography, however, the separate coherent beams are replaced by the ordinary and extraordinary components of a single beam traversing a uni-axial crystal.
With this method, it is possible to produce holograms using incoherent light, with a fringe period compatible with the resolution of conventional electronic imaging devices. Since both beams propagate through the same path, conoscopic holography is highly stable.
The sensor emits a laser beam. This beam is reflected by a beam splitter, and hits the specimen being measured. Scattered light travels from the specimen through the beam splitter and birefringent crystal, and is detected by the probe’s CCD camera.
The birefringent crystal modifies light rays in a way that is dependent on the angle of each ray of light. This creates a high contrast pattern on the CCD camera. The angle of a light ray impinging on an individual pixel in the camera depends on the specimen’s distance, so each distance has a characteristic pattern. The controller unit analyzes the pattern received and calculates the specimen’s distance.
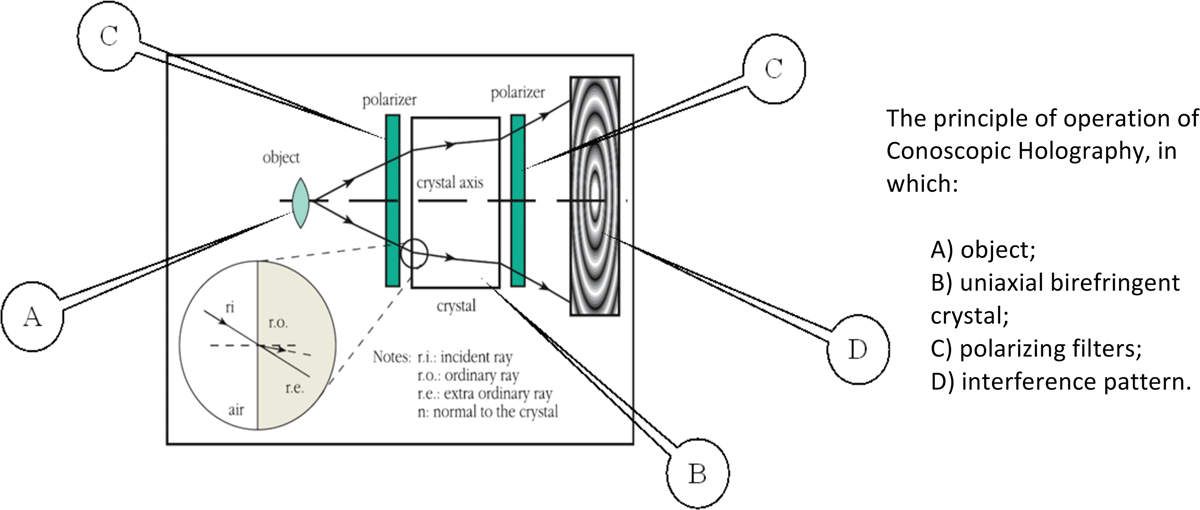
Figure 8
Block diagram of the measurement based on a Conoscopic Holography system.
The exact relationship between the signal retrieved on the CCD camera and the target distance is determined by a careful and accurate calibration process, performed for each objective lens.
An examination of the interference pattern determines the distance from the surface with extreme precision by measuring the period of the fringes (the light/dark transitions) by means of a linear CCD array, positioned along the center line of the interference fringes. This provides a “relative” measurement of extreme accuracy, since the count of the fringes is strictly related to the wavelength.
The distance between one fringe and the next fringe is closely related to the absolute distance between the sensor and the measured point at that instant, thus providing an “absolute” measure.
Sensor calibration
A calibration is never required, since the sensor is always “factory-calibrated”: each measurement depends on the lens installed. Along with each sensor, Optimet provides a certification—for every specific customer’s sensor—and for the lens and/or lenses that must work with that sensor. In any event, at any time you can run a test using a reference sample, as shown in Fig. 9.
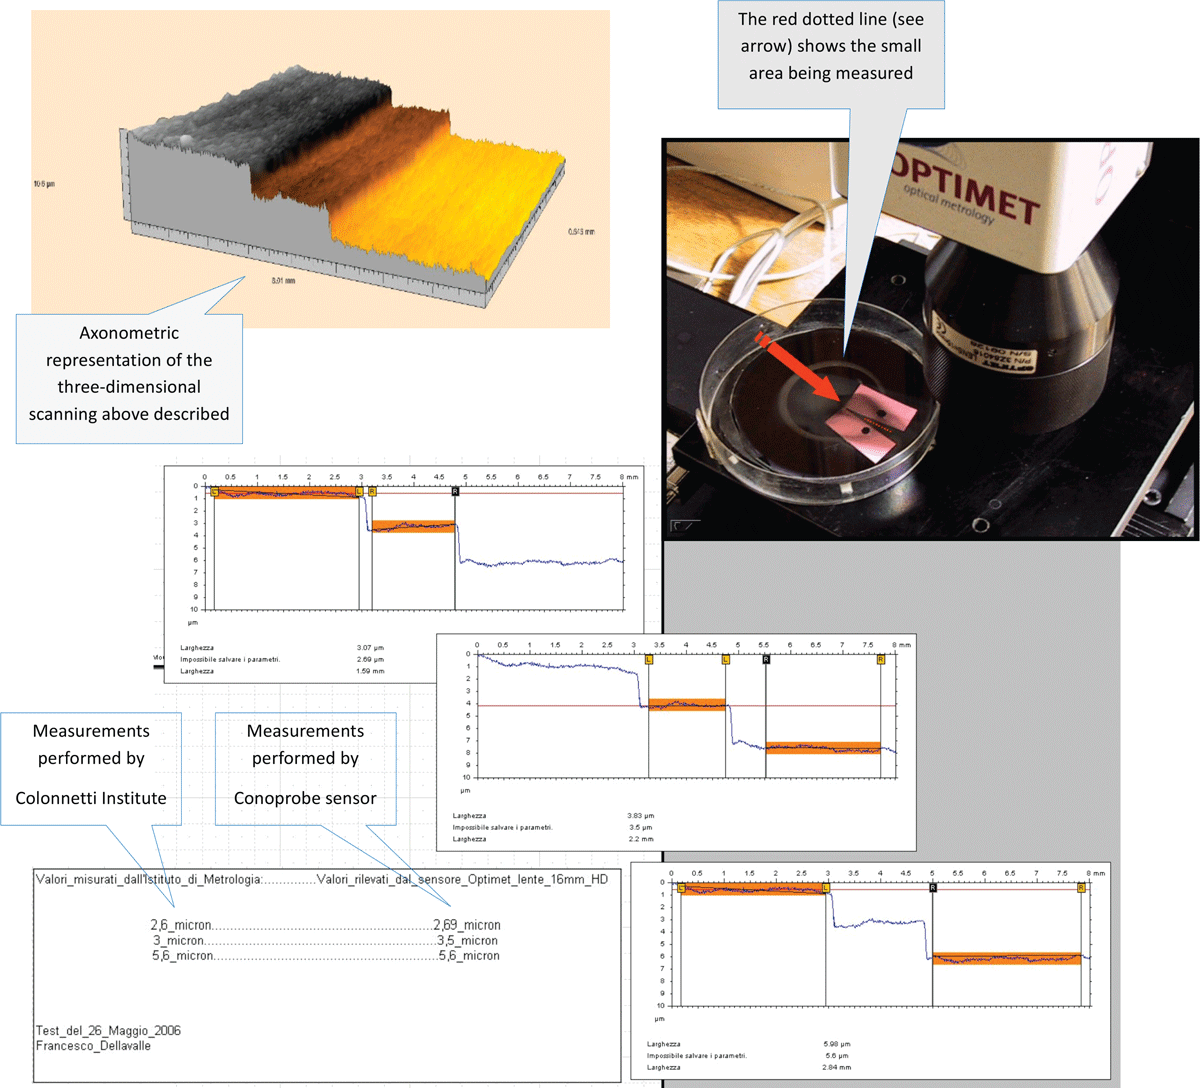
Figure 9
The measurement of the reference sample of the Metrology Colonnetti Institute in Turin.
Fig. 9 describes a test that the author performed in 2006, using a reference sample from/ at the Colonnetti Metrology Institute of Turin. The reference sample consisted of three silicon disks (each of a different diameter), overlapping each other.
The overall thickness of this sample was about 10 micrometers. The measure was made to detect the thickness between the “steps” from the first disc to the two successive discs.
An application software, specifically designed to be used in combination with measuring instruments, was used to analyze the depth of manuscript, placed in the comparison with each other [10].
First operation
The first step consisted of the scanning of each signature present on both test sheets.
The signatures on the two test sheets were a total of thirty: fifteen on each of the two sheets, (of which three per writer), each signature was sampled in the same operating conditions as the measurement system: maximum reading depth of the Z axis: 200 microns, with an accuracy of 0.5 µm (and repeatability of 100 nm) and 12 microns/step on the remaining Cartesian axes X and Y, with a sampling rate of 3Khz/point. Below is an example of the outcome of one of the 3D-examined signatures: that of Egle performed with a ballpoint pen on the sheet resting on a hard surface.
Fig. 11. The target displayed using the small multispectral microscope (see Fig. 2) with a strong grazing light NIR radiation, through a flash light (with a light radiation peak of about 840 nanometers), from south to north. Note: it is easy to observe this phenomenon, that the ink of the ballpoint pen and the ink jet printing (the box surrounding the signature) absorbs infrared, and both of the inks disappear from the image.
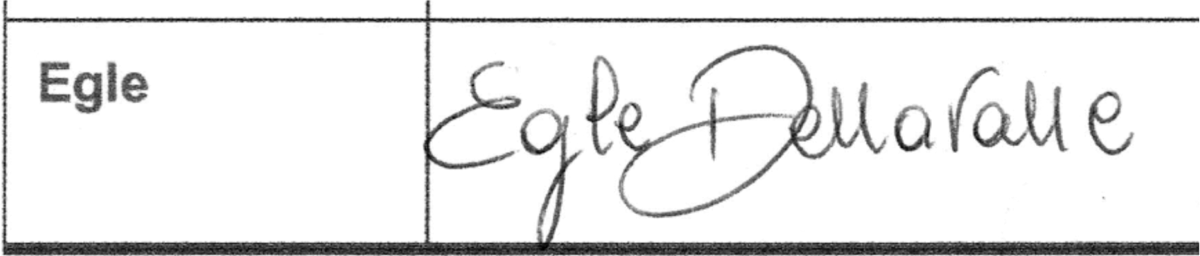
Figure 10
The target acquired by traditional 2D scanners.
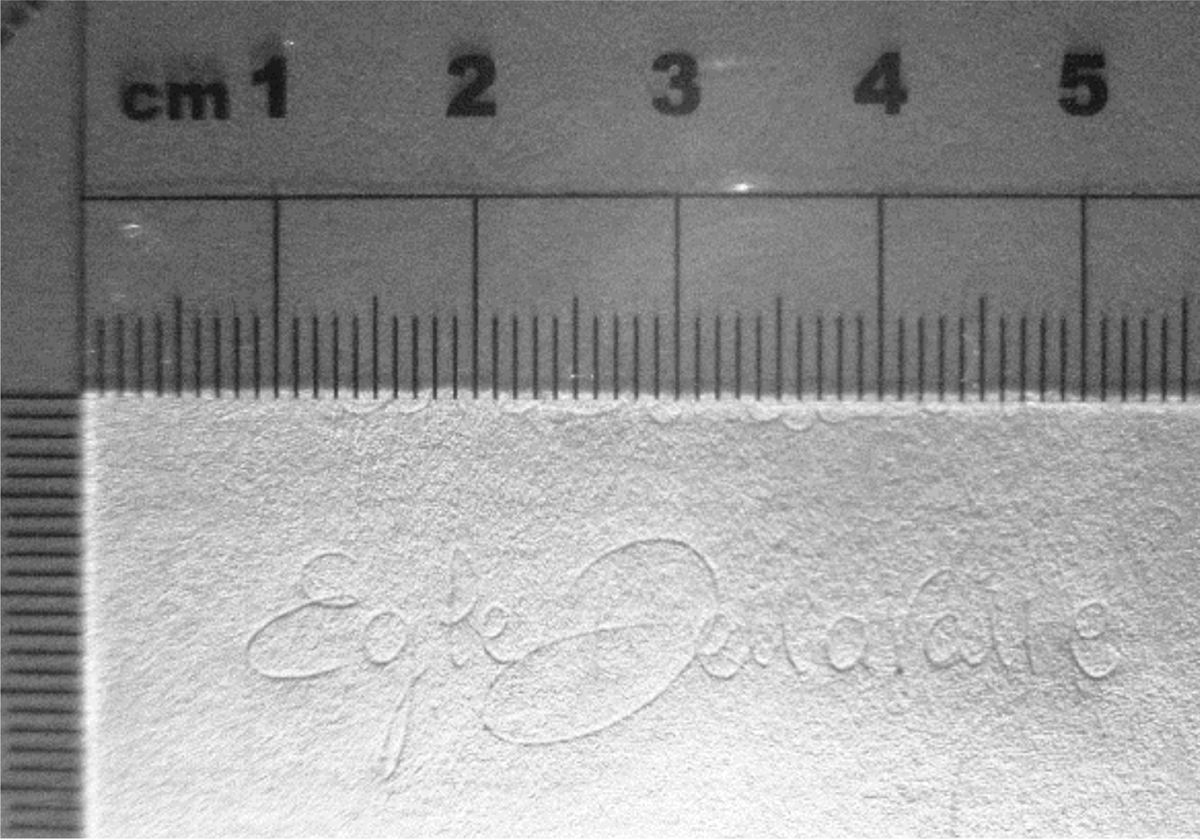
Figure 11
The target acquired with a strong grazing light NIR radiation.
In Fig. 12 it is possible to observe the outcome of the 3D scan of the Egle signature, executed with a ballpoint pen on a sheet of paper lying on a hard surface. In the figure there are two images – one, in shades of gray and the other, brownish. To the far right is a scale of values (related to the third Z-axis) expressed in microns. These values represent the surface profile—as a whole—of the paper texture inside the rectangle of the 3D scanning.
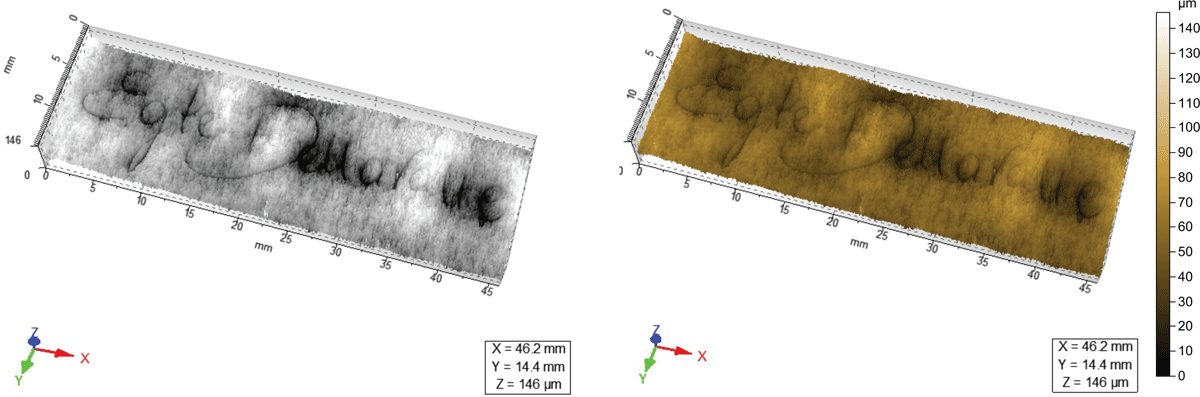
Figure 12
The same target of Fig. 10 acquired by 3D scanners.
Consequently there is no need to confuse these values with those of the single depth of the groove generated by the pen.
A note on the surface roughness of the paper texture: the roughness of a classic virgin white sheet (for photocopies) is about two microns. The measurement was performed both with the Conoscan 4000, and a Taylor-Hobson contact profilometer. Both measuring instruments provided the same value.
When observing the results obtained by analyzing the thirty signatures (see Figure 15), the minimum value detected is 13.9 microns, which is well above the 2 micron roughness of the paper sheet.
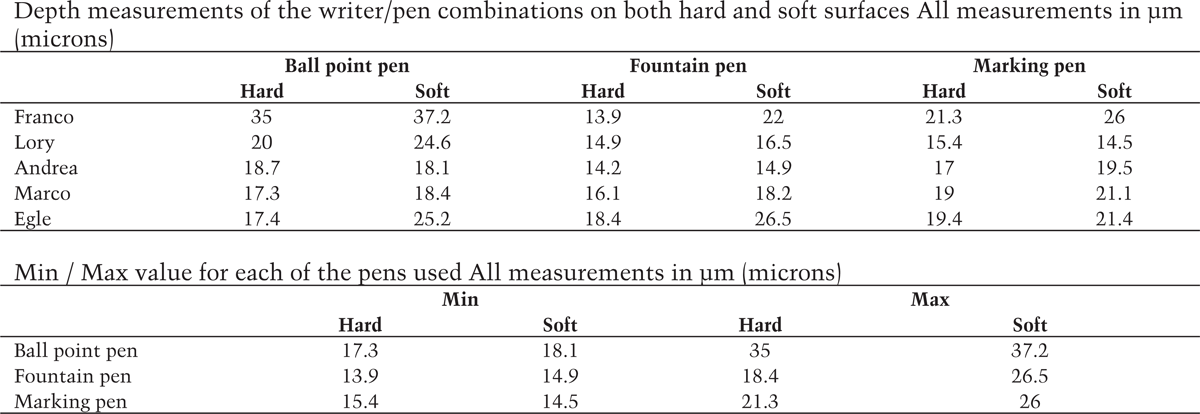
Figure 15
Final table describing the results obtained
Obviously, the shallower the depth of the groove, the harder it is to take a measurement, up to the limit, in which the groove is so light that it may be confused with the roughness of the paper.
Second operation
In Fig. 13 the values of the cloud of points relating to the Egle signature has been inverted along the Z axis so that the “snow on the hills” appearance/effect actually represents the points where the pen has exerted a greater pressure to the hand-penned track.
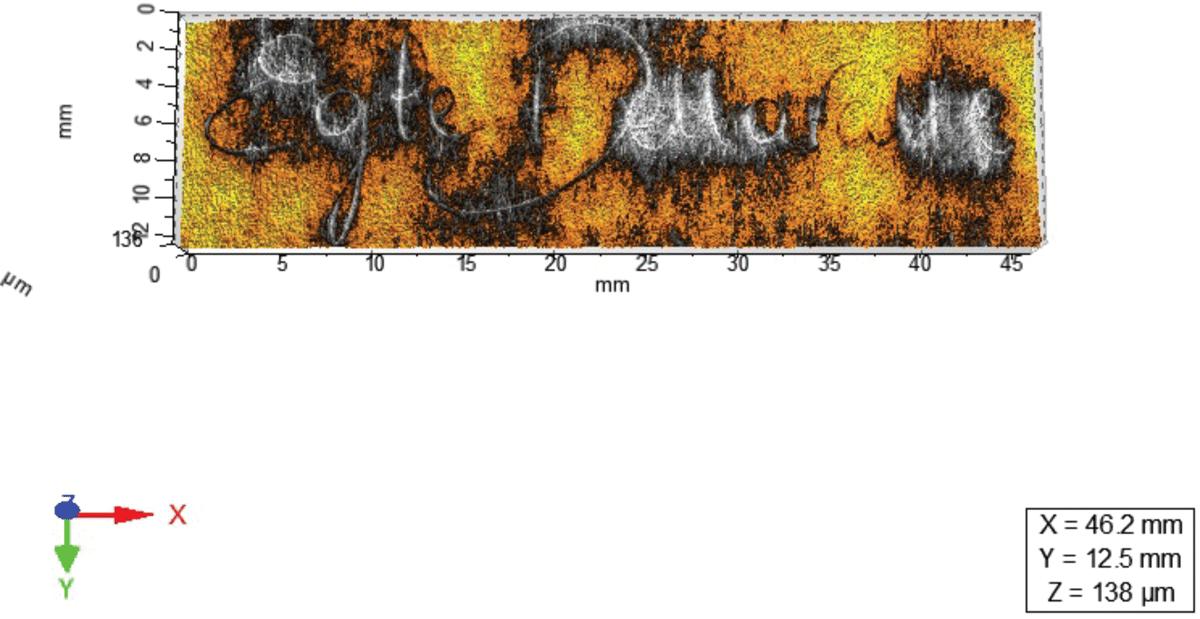
Figure 13
The same target as that of Fig. 10 acquired by 3D scanners.
Third operation
In Fig. 14, a false color/colour image. the key pressure points can be observed along the groove generated from the tip of the pen by the hand of Egle, to make his own signature.
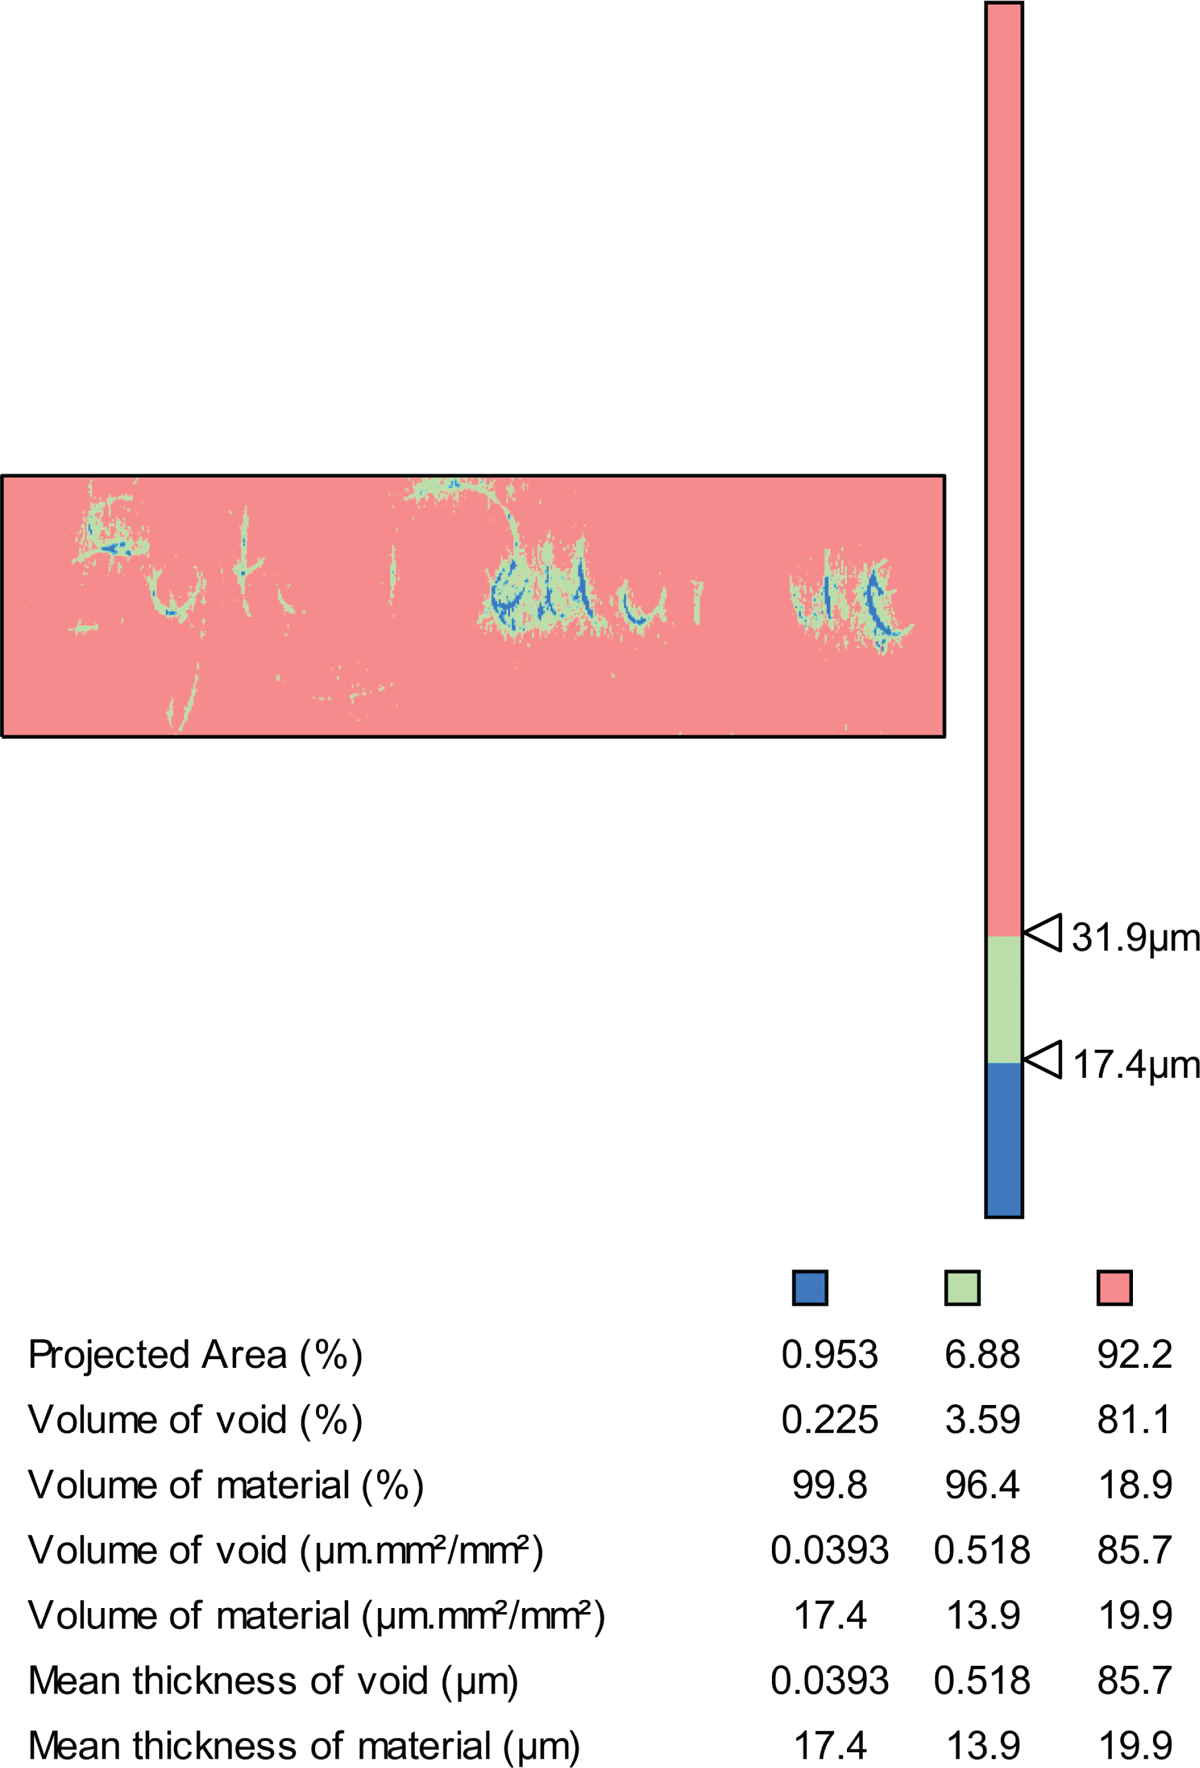
Figure 14
The measure of “Slices” in the Egle signature.
The algorithm used to perform the measurements of the “Slices” was Mountain Map software version 6.2 [10]:
The study of the vertical sections (Slices) is used to indicate which parts of the surface:
are below a given altitude.
are above a given altitude.
lie between two given altitudes.
The information below the false color/colour image of the surface allows the user to know for each slice:
its surface (in %).
the void and material volume (in %).
the void and material volume per surface unit.
the mean thickness of void and material.
What the author has obtained through the use of this algorithm is the point of greatest depth of the manuscript groove.
Results
In the two tables shown in Fig. 15 it is possible to observe the outcome of the findings obtained as a result of thirty 3D scans divided as follows:
three signatures for each subject, each made with a different type of pen;
On one sheet of paper resting on a hard surface, and
On a second sheet resting on a soft surface (as described above). Altogether fifteen signatures were penned on the first sheet and the same number of signatures on the second test sheet.
All the figures on the tables are expressed in microns and are the maximum pressure exerted by writing pens, depending on the person who has written the signatures.
Additional notes
Marco is left-handed and so he writes (and signs) with his left hand, while Franco is ambidextrous: he writes (and signs) with his right hand and draws with his left hand2;
A further test consisted of composing a handwritten track to obtain the breaking of the paper texture, in order to also obtain the depth reached by the groove (expressed in microns). A total of nine sections were tracked with a ballpoint pen, divided into three groups where each group consisted of three tracts, as specified below:
In the first group (Group A, with the sheet of paper placed on a hard surface) a strong pressure was exerted on the tip of the pen;
In the second group (Group B, with the sheet of paper resting on a soft surface, as described above) and a strong pressure was exerted on the tip of the pen;
Finally, in the third group (Group C, with the sheet of paper resting on a very soft texture – the cover of a leather agenda), the pressure was further increased, which resulted in tearing of the paper surface.
The three images below, were acquired with the pocket multispectral microscope described in Figure 2, in NIR mode with an emission peak at approximately 840 nanometers and a radiation beam from south to north. Additional parameters included:
The type of pen used: Bic model I – II -21 black;
The paper type: UNI sheet size A4 75 g/m2, Extra-white type Fly Up model, produced in Portugal.
In Fig. 16, it is possible to observe the outcome of the 3D scan of the C Group, comprising three sections with a ball pen on a sheet of paper resting on a very soft surface. On the left side: the parameters set for a scan using a 50 mm lens, with a working range (for the Z axis) of two millimeters.
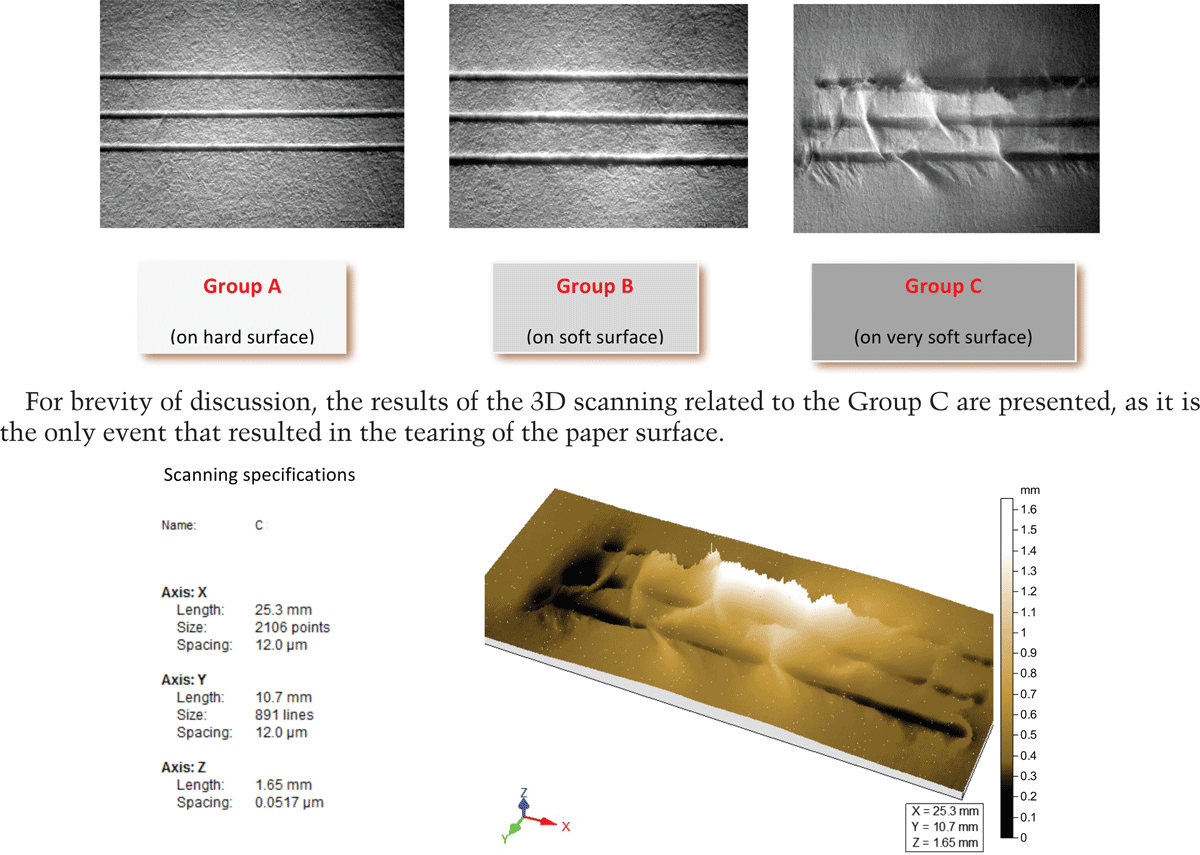
Figure 16
Group C acquired by 3D scanning.
The replacement of the lens (different from that used to perform scans of signatures) was necessary, because otherwise it would not be possible to measure the generous variation that the paper surface underwent along the Z axis, as a result of the rupture of the same. By using the different lens, the accuracy of the measurement decreased from 0.5 microns for the 16 mm lens (used for the scanning of signatures) to 2.5 microns for the 50 mm lens.
In Fig. 17, the extent of the depth of the three grooves can be observed on the left side of the 3D scan immediately before breakage of the paper surface.
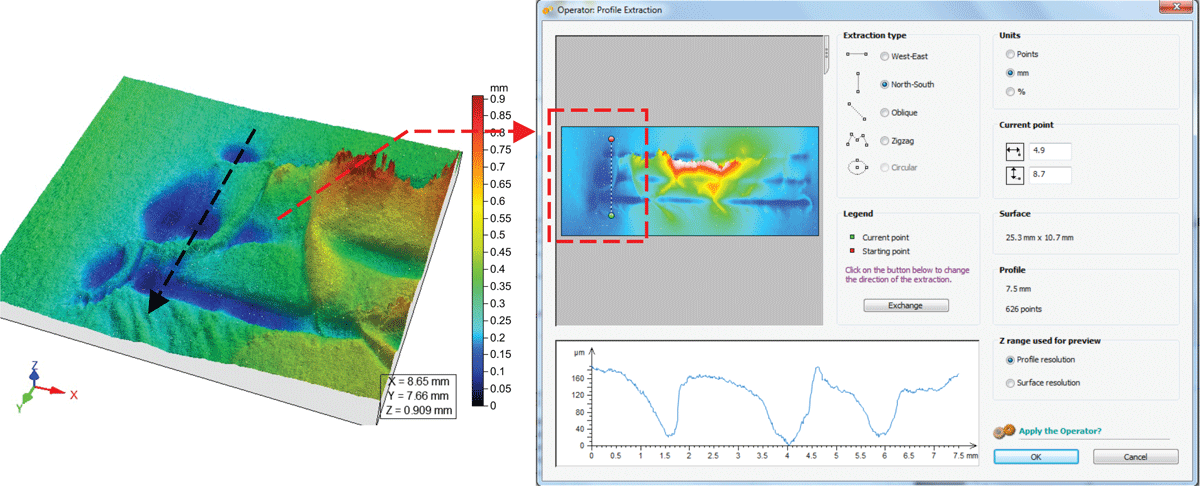
Figure 17
Extrapolation of a profile in the C Group acquired by 3D scanners.
In Fig. 18, the extent of the depth of the three grooves can be observed on the left side of the 3D scan, immediately before tearing of the paper surface.
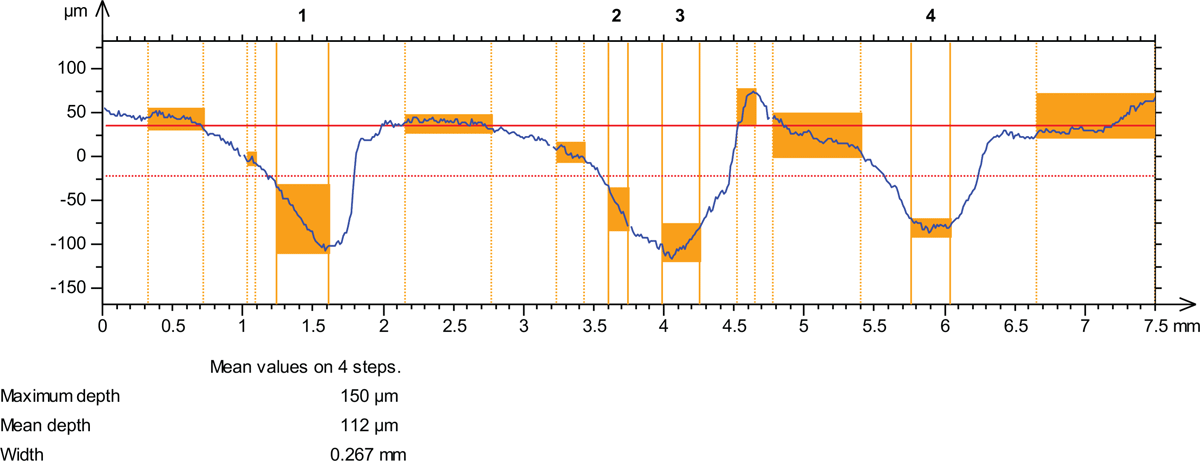
Figure 18
Extrapolation of a profile in the C Group acquired by 3D scanners.
Fig. 19 describes the results obtained by the algorithm on the extent of “Slices” of Group C, similarly to that performed and described in Fig. 14 for the measurement of “Slices” in Egle’s signature.
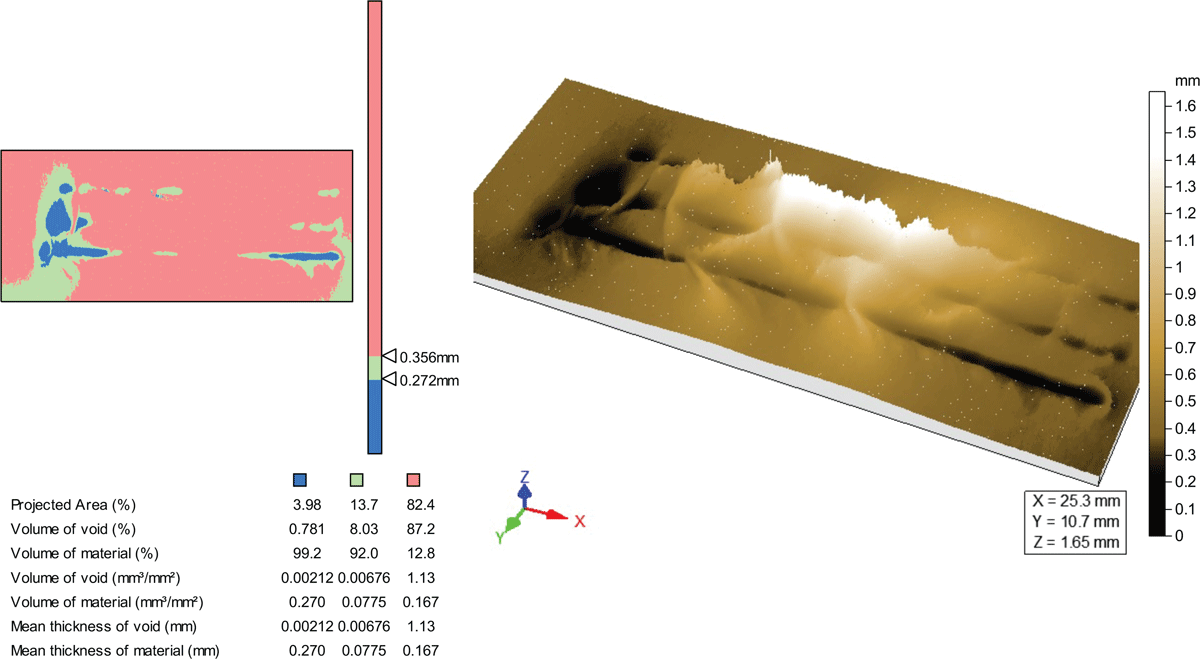
Figure 19
The measure of “Slices” in Group C.
Note: the deepest points generated by the grooves could not be measured instrumentally because at those points the tearing of the paper was so extreme that the paper fibers generated a high relief: see in the image at the right, the “snow mountain” effect/appearance represented by the white highlighting. To give a better idea of what has just been described, observe the last image in Fig. 20.
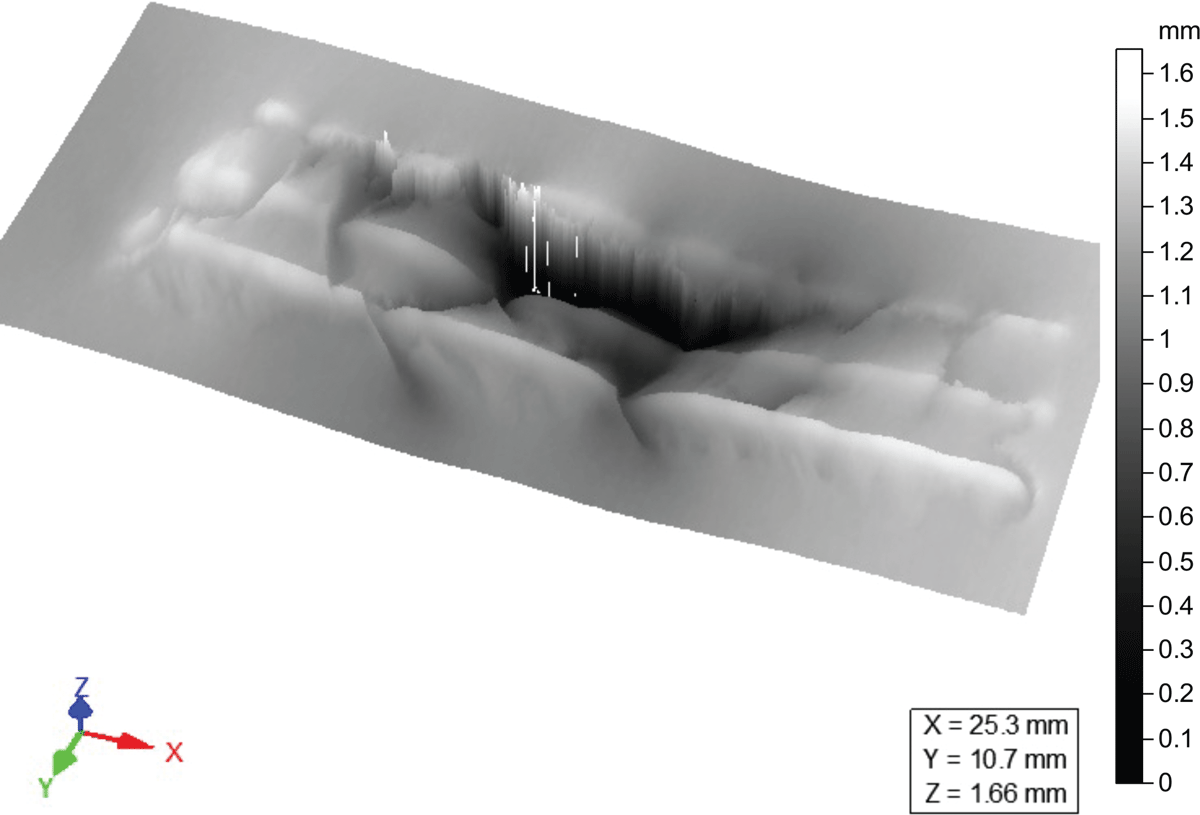
Figure 20
The cloud of points of Fig.16 with the measured depths reversed on the azimuthal axis.
In Fig. 20—due to the values swapped in Z— the concave grooves etched by the tip of the ballpoint pen become convex. It follows that the macroscopic “crater” visible in black is only used to “simulate” the high stress that the paper has suffered as a result of its tearing. As already said, in reality this crater does not represents the depth of the same, but the relief height of the paper surface at that point.
Discussion
Laser microprofilometry, detecting and recording the third dimension of writing (the depth given by the dynamic pressure) brings new information in the interpretation of the dynamics of writing [11].
It is obvious that the individual writing pressure variation determines a degree of indentation, which also varies as a function of the writing instrument, as well as by the rigidity or pliability of the support on which it is written.
The findings presented in this article, show that:
The indentation of the handwriting that each individual product shows in the present experiment is consistent, either by changing the type of writing instrument, or by changing the characteristics of the writing medium;
The findings revealed that when writing on a hard surface more pressure was exerted with the marker than with the fountain pen.
The range of variation of the indentation value resulting in the samples of five different subjects is between 13.9 and 37.2 microns.
The experience gained by the authors in more than seventeen years in the forensic field, derived from multiple 3D measurements of pen tracks on paper, confirmed by this study, allows the identification of the minimum depth of a groove of a handwritten track on white paper of 80 gsm, to be about 2 µm. This corresponds to an indentation so light that it may be confused with the roughness of the paper fibers.
Conversely, the paper surface undergoes a tearing when the writing pressure on the desk top is such as to generate a deformation which exceeds 150 µm.
This study was a preliminary one with some limitations including: the number of writers, the quantity of signatures, the type of paper and the types of writing tools. Future studies could be performed to collect additional data from different writers and under different conditions.
Notes
[1] Recently this methodology was used in a case where the issue was whether a check had been signed by a human hand or by a machine. Laser profilometry was used to resolve the matter. Consequently, this small experimental study was designed and conducted to gather metrics on the depth of grooves of ink lines.