
Introduction
Inkjet printers for small home offices are one of the most popular and widespread printing systems today. Thus, the amount of forgeries, written claims of responsibility related to crimes and threatening letters which originate from inkjet technology is considerably high. Forensic science must try to develop methodologies capable of device identification or at least explore the general potential of characteristic features that can be extracted from a given document.
In recent years there have been several publications demonstrating the application of feature extraction and pattern recognition in order to identify printed documents by a non-destructive optical investigation.
Some of these approaches are based on the analysis of texture patterns: The authors in1 and2 investigated a print quality defect based on electrophotographic printing mechanisms using graylevel co-occurrence texture features and a subsequent classification. In3 the graylevel co- occurrence matrix is replaced with a local binary pattern descriptor which counts the gray levels in a circularly symmetric neighbourhood. A classification accuracy of up to 97.9% was reported. Another variation of this approach can be found in4 where classification is extended to colour printed documents.
A different idea for feature extraction has been reported in5: A feature profile consists of a linear basis generated from a set of degraded characters using a principal component analysis. This basis embodies the printer degeneration and can be used for a reconstruction of the degraded character. Comparing these profiles to a character from a questioned document and calculating the minimum reconstruction error leads to a sufficient discrimination between the used printers.
However, none of these methods is of practical use for the analysis of inkjet printings due to the fact that a different printing technology is targeted. The use of texture patterns for the analysis of inkjet printings has been investigated by the authors in6 who examined the stability of texture features within the same printer model and selected the most significant ones by performing a stepwise discriminant analysis. Using an automated system different image features and print quality metrics are presented in7 and8.
Satellite droplets—tiny drops that separate from the main ink droplet during the printing process—have been studied with respect to the question whether print modes, ink properties and paper variation influence the appearance of satellites9. The article points out that even small variation in these parameters will cause the satellites to change either in size and shape or in their distribution. Therefore, the author suggested a method for print mode determination as a first step in an inkjet classification system10.
It is important to keep these results in mind since the strategy of inkjet classification proposed in this paper is based on the statistical analysis of the satellite distribution. Due to the fact that only the location of the droplets is of interest variations in size and shape can be neglected. However, changes in the spatial distribution are critical and thus the print mode and ink properties must be determined in advance and are considered as fixed parameters.
Methods
In this paper a method based on the statistical analysis of the intrinsic features present in the printed document is proposed. In particular, the spatial distribution of small droplets that each drop breaks up into upon leaving the nozzle in the printhead is investigated. Since the amount of information that can be gathered by the investigation of a typically sized letter on a microscopic scale exceeds the capabilities for manual inspection, the acquisition of the droplets’ position data is restricted to certain regions of interest. In order to define a droplet neighbourhood and to quantify spatial properties the satellite drops are connected to a graph and global graph features are calculated to build a profile vector of the droplet distribution. The main idea behind this is to get rid of properties like drop size and shape which are heavily influenced by the paper of the document. Besides, the focus is on the statistical properties of the whole distribution in contrast to the investigation of individual droplet positions. Figure 1 gives an impression of how droplet distributions may differ in terms of density and neighbour distance. This graph profile is used for a subsequent classification of the type of device used to print the document.
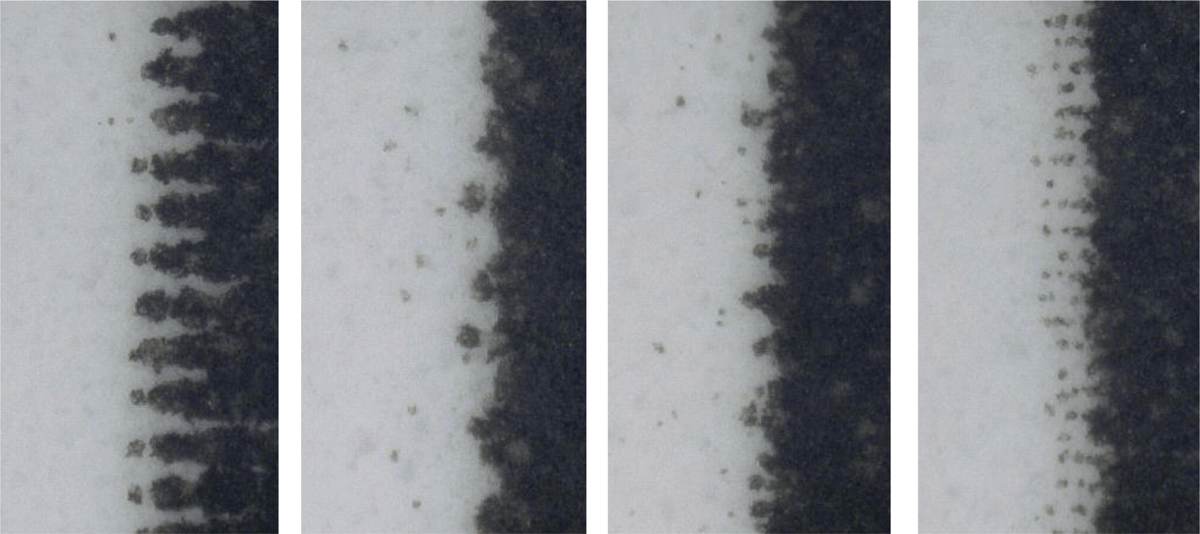
Figure 1
Differences in the spatial distribution of satellite droplets from four inkjet printers of different type and model.
While an automated process for acquiring droplet position data has been implemented this paper focuses on data from a manual acquisition. This is due to the fact that the automated procedure involves a chain of image processing operations in order to get a binary image and a subsequent segmentation. All of these operations require input parameters that are adapted to the current image and have a major impact on the number of segmented drops. Thus, the automated process would still involve careful adjusting and a lot of interaction with the human inspector so that a manual selection for the purposes of this study seems to be more appropriate.
As a consequence, the regions of interest are rather small including a maximum of two or three typical sized characters on a text-only document each. Nevertheless, the amount of satellites sums up to several dozen in each region depending on the type and model of the printer.
A commonly used approach for the connection of points based on nearest neighbour queries is a Delaunay triangulation11, 12. It requires no apriori-knowledge of the distribution and delivers a graph that is similar to what a human inspector would select to be connected neighbors (with the exception of the outer boundary). Moreover, there is no need to determine any input parameters. Figure 2 shows a selected region of interest, the acquired satellites marked as red circles and connected to a complete graph and a Delaunay triangulation. However, there exist connected satellites that a human inspector would not consider to be neighbours at the border, i.e. on the boundary of the convex hull of the finite pointset. In order to circumvent this two additional orthogonal thresholds are introduced using a priori knowledge:
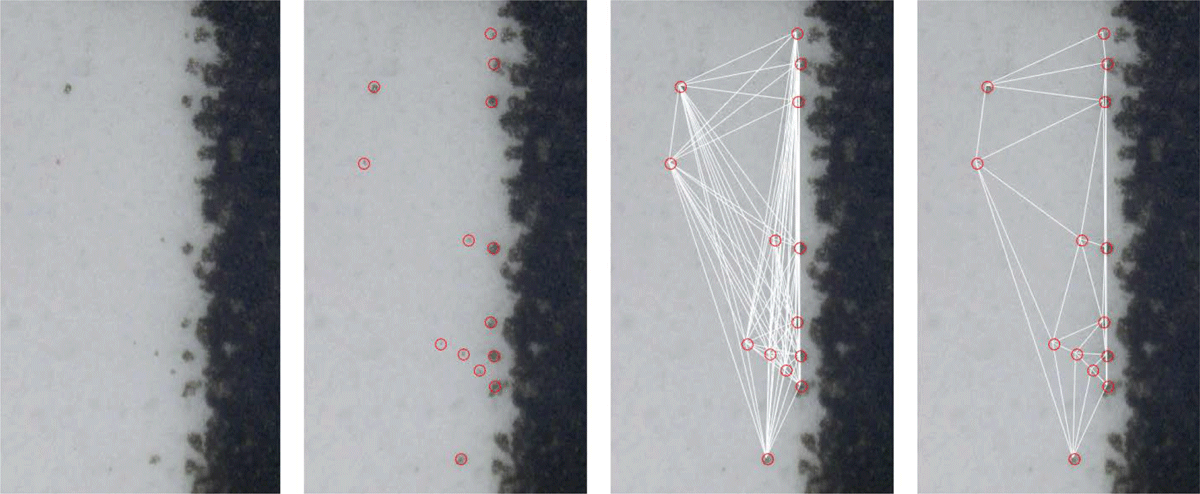
Figure 2
From left to right: (1) Satellite droplets and border of a printed character, (2) manually marked satellites, (3) complete graph connecting every point with each other, (4) Delaunay triangulation.
The nozzles of today’s printheads are often placed at a distance of approximately 40 µm yielding a vertical print resolution of 600 dpi. Thus, to connect only satellites that originate from neighbouring nozzles a vertical threshold of 60 µm could be used. This distance is extended to 120 µm to include one more line of droplets in each direction or respectively take into account printers with a lower resolution.
On the other hand there is no need to restrict graph connection in horizontal direction to this small distance. Still, a horizontal threshold is needed because the graph is not supposed to jump over to the next printed character so a horizontal threshold of approximately 450 µm is used. Figure 3 shows an example of such a graph.
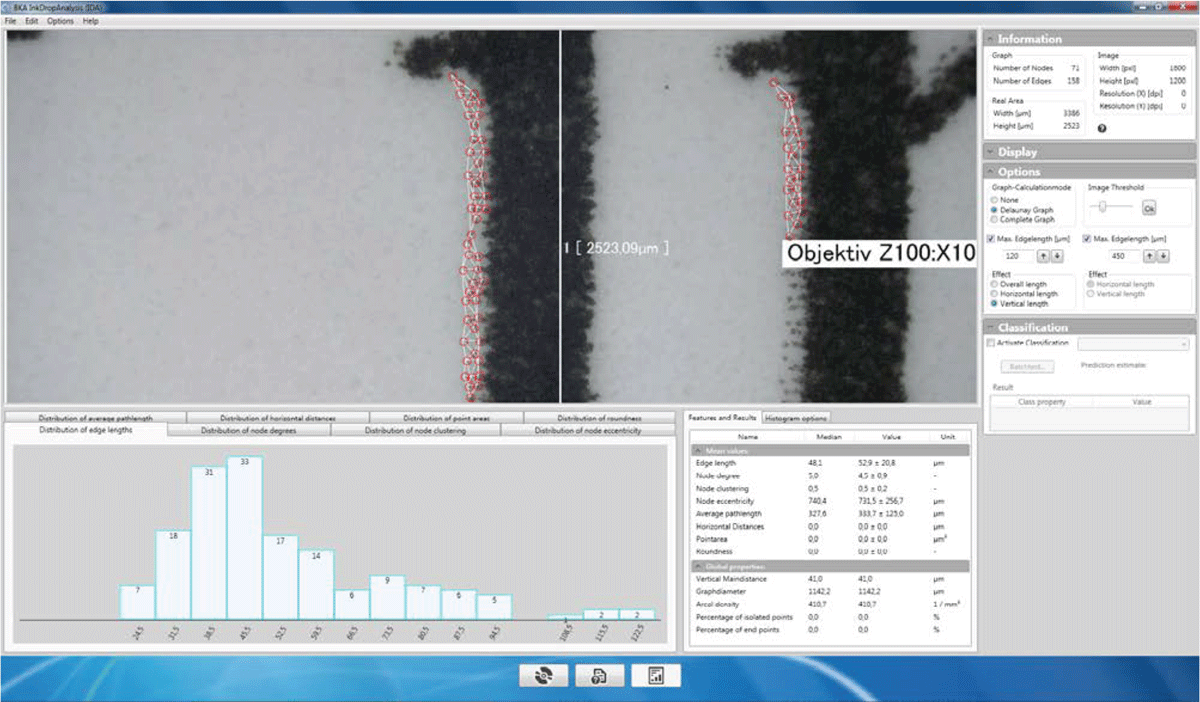
Figure 3
Screenshot of the software implemented and used in the experiments: The big area on the top-left shows a picture of the region of interest of the printed document together with marked satellites (red circles) and a Delaunay triangulation restricted by two orthogonal thresholds (white lines). On the bottom-left each tab contains a distribution histogram for a statistical property of the graph (histogram of the edge lengths on this screenshot). The table on the bottom-right contains the median, average and standard deviation of the corresponding histogram.
Graph classification has many applications and thus various methods have been proposed to accomplish this task. This experiment follows an approach presented in13 which is based on feature vectors constructed from topological attributes of the graph. It has the advantage of being simple and delivers competitive results without producing computational overhead compared to graph kernel methods. The features that have been extracted are listed in Table 1. An example distribution and feature values are also shown in Figure 3.
Table 1
Topological attributes and global label attributes of the graph used to build a feature vector.
| Name | Description |
|---|---|
| Edge length | Average (Avg.) and standard deviation (std. dev.) of the length of all edges. |
| Degree | See13 |
| Clustering coefficient | See13 |
| Effective eccentricity | See13 – Shortest paths are calculated using15. |
| Average Pathlength | For each node the average of the shortest paths to each other node is calculated. The distribution of these averages yields Avg. and std. dev. |
| Vertical main frequency | The most prominent value of all vertical distances for a profile which should be related to nozzle distance and thus to vertical resolution. |
| Graph diameter | See13 |
| Areal density | Number of nodes per area. |
| Isolated Points | See13 |
| End Points | See13 |
Several standard algorithms are available for the classification itself. In this research the random forest classifier, a set of tree predictors, is chosen due to its ability to estimate its own performance and to deliver a variable importance score14. In order to circumvent a bias for higher absolute values all feature values are normalized prior to classification using z = (x – µ)/σ where x is the measured value, µ is the feature average of all profiles used to train the classifier and σ is the corresponding standard deviation. The impact of different classification algorithms could be examined in future studies.
Experiments
A total of 12 individual inkjet printers have been used to produce the printed documents that were investigated. This sum is made up using four different printer models, listed in Table 2, with three individual devices for each model. Since each model is produced by a different manufacturer the individual devices are referred to by their manufacturer and a fixed individual number, e.g. HP(1), HP(2), HP(3), Kodak(1) and so on. Within the scope of another project these printers have been used to produce printouts for several months and the documents investigated here have been selected randomly from the accumulating printout collection. However, only text-only documents have been selected and the print mode was fixed to normal mode, i.e. no fast / draft mode or best / photo mode was allowed.
Table 2
The inkjet printers used in the experiments. For each type in this table there have been three individual printers making a total of 12 printers.
| Make | Model |
|---|---|
| Brother | MFC-J825DW |
| Canon | Pixma MG 5350 |
| HP | Photosmart 6510 |
| Kodak | Hero 7.1 |
From each document a small region of interest was selected in which the satellite droplets were manually marked and the feature vector was constructed using the topological attributes of the graph as mentioned above. In order to easily realize these tasks special software with a suitable user interface has been implemented as shown in Figure 3 (using Microsoft.NET-Framework 4.5). A database was used to store the single profiles and to read in the profiles later for training and testing of the classifier.
The set selected to train the classifier consisted of 40 documents per model, i.e. 20 documents per individual device (1) and (2), making up a total of 160 training profiles. No training profiles have been chosen from the devices with individual number (3).
The test set consisted of 30 documents per model, 10 per individual device. Thus, it is evaluated how the classifier copes with documents from the individual devices (3) which are completely unknown to it. Obviously, the documents that have been chosen for training and testing purposes from the (1) and (2) devices are different ones, too.
Results
Figure 4, 5 and 6 each show two variables of the training set profiles plotted against each other. This gives an impression of the separability of the printers in general as well as some properties of the individual models:
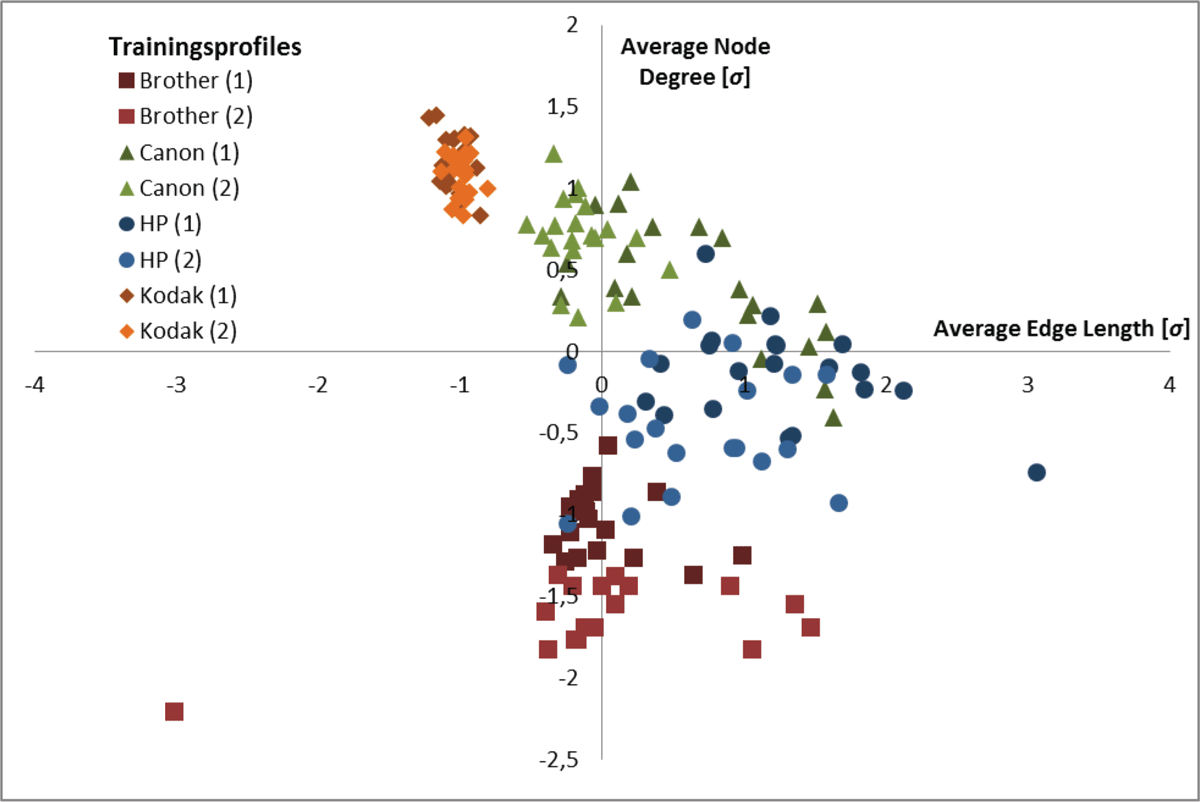
Figure 4
Average edge length vs average node degree taken from the feature vectors of the trainingprofiles.
The most compact distribution in feature space comes from the two Kodak devices (with some outliers in Fig. 5 and 6) while the other printers are more widely spread. Not surprisingly both Brother devices can be found at the lower end of the average node degree scale as well as the average pathlength since only few satellite drops are emitted. It is interesting to see that Brother(1) and Brother(2) are distinguishable amongst each other while this is not the case for the other manufacturers devices. Moreover, while one could argue that average node degree and average edge length, the two most important variables according to the variable importance score of the Random Forest classifier, are negatively correlated this is clearly not the case for the Brother devices. However, Figure 5 shows an obvious correlation between average node degree and average pathlength which is understandable. Future extensions might thus make use of dimension reduction algorithms as for example a principal component analysis. The edge length standard deviation is relatively constant for Kodak and Brother profiles but highly variable in the case of HP profiles (Fig. 6). According to the impression given by these scatter plots the manufacturers should be separable in principle.
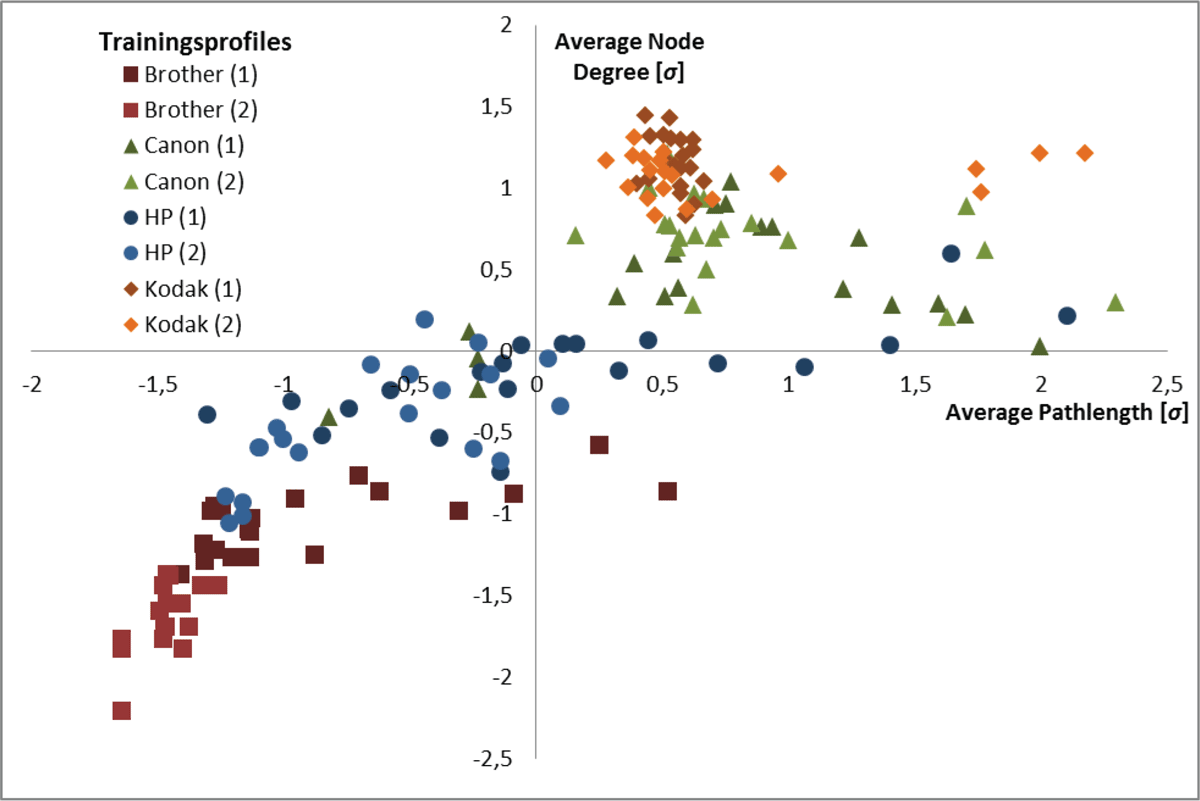
Figure 5
Average pathlength vs average node degree taken from the feature vectors of the trainingprofiles.
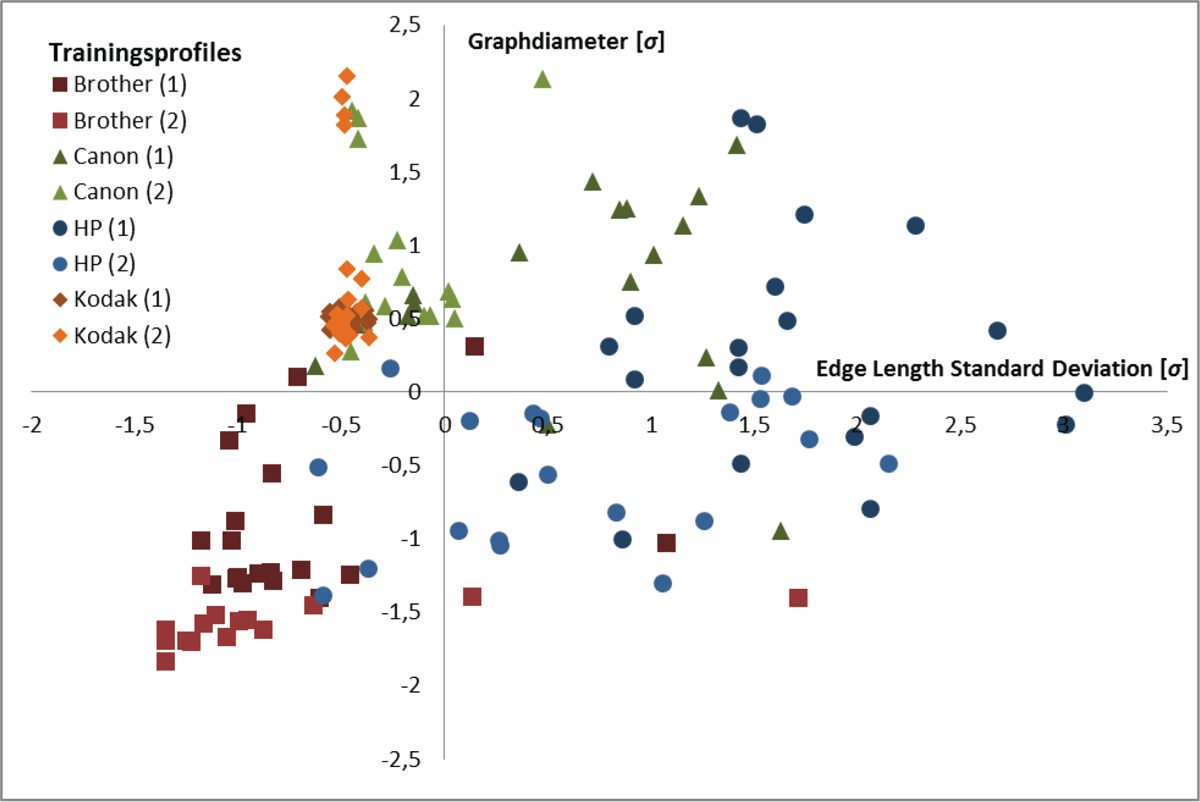
Figure 6
Edge Length std. dev. plotted against Graphdiameter taken from the feature vectors of the trainingprofiles.
The results of the classification of the test set can be seen in Table 3. Each line in this table contains the 10 test profiles for one individual device. The columns indicate the classification outcome for these 10 profiles. There have been no training profiles for the individual devices with number (3), hence these are naturally unknown to the classifier. Nevertheless, for the sake of symmetry and clear arrangement they are included with their own columns shaded in gray.
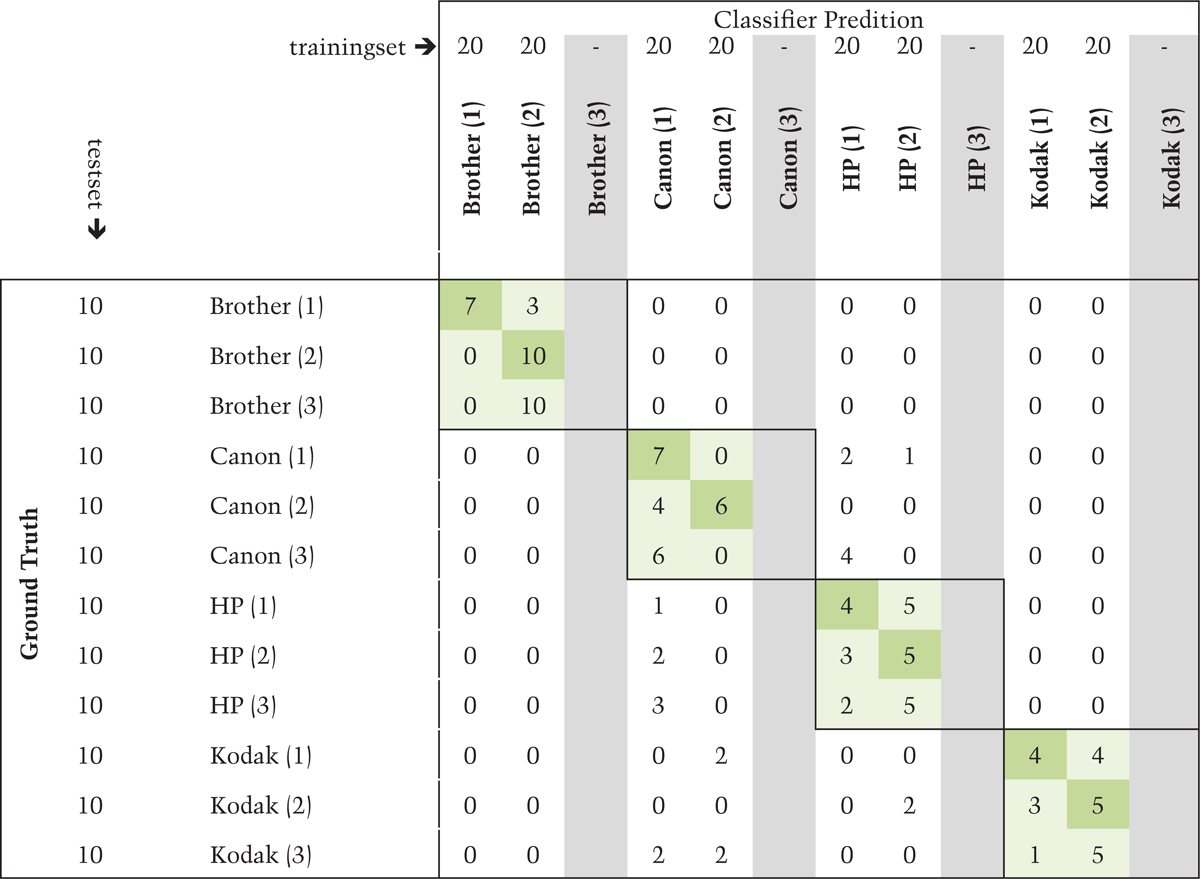
Table 3
Results of the classification of the test set (per device).
It is directly visible that the approach presented in this paper is not suitable for an individual device classification: As already stated above, the (1) and (2) devices cannot be distinguished properly except for the Brother devices. Counting only the devices known to the classifier the accuracy of an individual device classification is as low as 60%.
Hence, another classifier has been trained using the same training set but this time differentiating only between manufacturers (which is identical to models in this setting). Instead of estimating the generalization error by the means of a cross fold validation the Random Forest Classifier provides a self-estimation of its performance which is based on bootstrap aggregating (bagging). Each decision tree is grown not only using random feature selection but also on a new training set which is drawn, with replacement, from the original training set. In this experiment the selfestimation yields an accuracy of 84%.
The classification of the test set is shown in Table 4. An accuracy of 83.3% is reached which is consistent with the self-estimation. The Canon classes are attracting many samples from HP and Kodak while some Canon profiles are misclassified as HP. While being better than individual classification the result can still be improved.
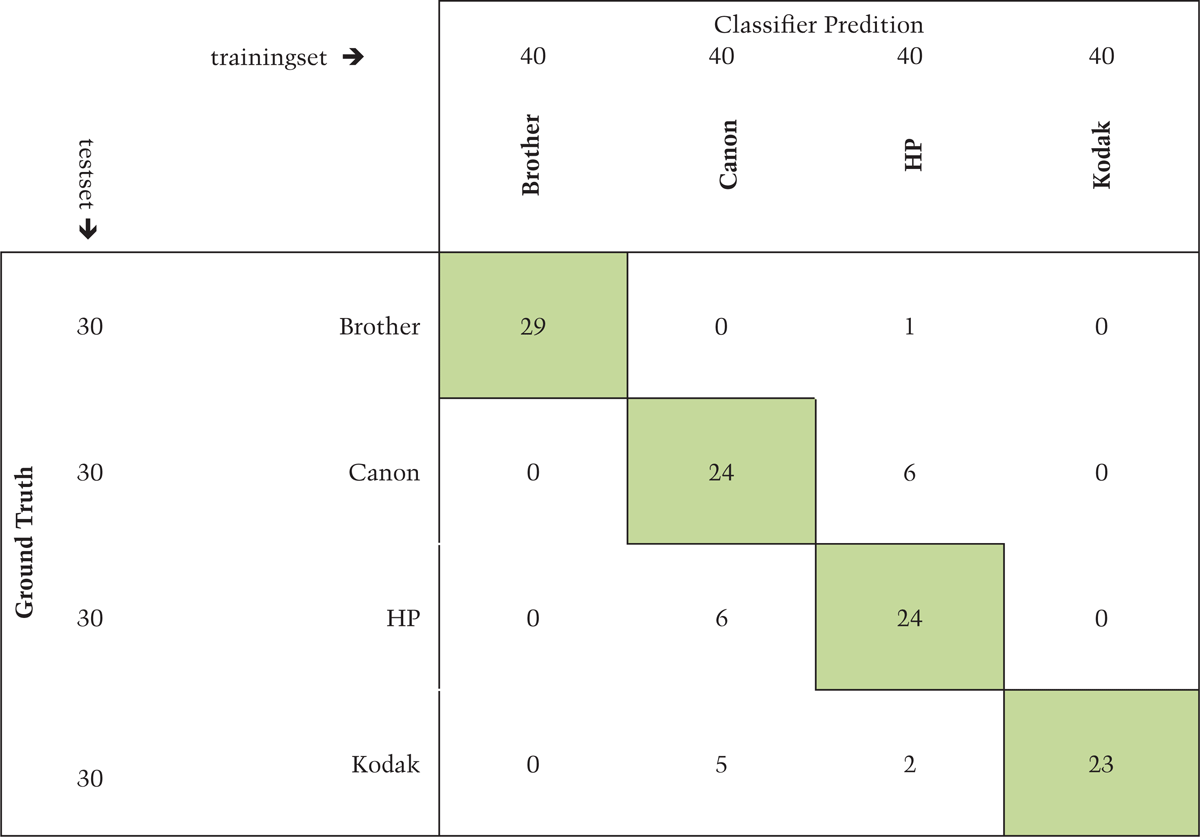
Table 4
Results of the classification of the test set (per manufacturer).
Conclusion
In this paper a new method for the statistical analysis of the spatial distribution of satellite droplets on inkjet printed documents is presented. The proximity information yielded by a connecting graph is used to build profile vectors that are subsequently classified reaching an accuracy of approx. 84%. While little improvement is expected from the utilization of different classification algorithms the resulting accuracy as well as the overall statistical meaning might be increased by tuning the thresholds and increasing the training profile number respectively. Moreover, variable dimension could be reduced and, on the other hand, future studies might focus on the overall optimization of the selected features.
Still, one must keep in mind that this setting analyses printers that have been produced by different manufacturers so that a result for different models of the same manufacturer will most likely be worse. Besides, given that so many parameters are fixed (print mode, ink and paper type, software) this approach is unlikely to be of practical use unless it is combined with other methods as reported above. On the other hand, it might be useful in forensic settings when printer and questioned document are both available and the question is whether the document originates from the particular printer. In this case the statistical properties of the satellite distribution can be compared for all available print modes and paper types.
So while it seems that this method will need future research to accomplish document identification it could still be valid as a method for exclusion in the appropriate forensic setting.