
Introduction
With the maturation of digital photography, the need to print near-photographic quality images is strong. Various digital printing platforms (e.g., inkjet printers, toner printers, and/or dye diffusion thermal transfer printers) can be utilized to reproduce high quality graphics. Each platform has developed specific markets suited for the technology. Dye diffusion thermal transfer and thermal mass transfer printers frequently find use in the document issuance industry. Advanced desktop badge and document printers are used in a variety of applications to generate genuine drivers’ licenses, company badges, credit cards, and more (Komerska, 1991). While these printers serve a variety of legitimate purposes, they are sometimes used to generate counterfeit and fictitious documents by criminal and terrorist elements.
Patents for thermal printing technology date back to a flurry of activity in the 1980’s (Oshima, et al., 1984), (Aviram & Shih, 1985), (Chou, Elmasry, Chang, & Kidnie, 1989). As the technology matured, prices dropped and availability of fully integrated thermal printer systems rose. Thermal printing technologies are capable of printing to both paper and polyvinylchloride (PVC) card substrates. As a result, the number of counterfeit card-based documents confiscated has been steadily growing. Today, thousands of confiscated counterfeit credit cards and drivers’ licenses are produced each year using thermal transfer printing.
Printing photos, identification credentials, or anything else of commercial quality requires resources to acquire professional equipment: either a printer aimed specifically at high-quality reproduction or a printing shop. Terrorist and criminal elements often use less expensive printing technologies—dye diffusion thermal transfer and thermal mass transfer—to simulate commercial processes such as offset lithography. As a result, counterfeit credit cards, drivers’ licenses, and other documents are often produced on plastic media using thermal printing technology.
Fortunately, the thermal ribbons used in these printers contain a wealth of data that is valuable for forensic purposes. Thermal ribbons are comprised of sacrificial color panel sets used to make a printed image. A typical thermal ribbon may contain cyan, magenta, yellow, black, and overlay (CMYKO) panels which are combined on the substrate to form a single image. Other color combinations also exist, and single color ribbons have specialty applications as well. Any given portion of a thermal ribbon is used only once; the ribbon, therefore, retains a latent negative image of what was printed. Locating and overlaying these latent panels can reconstruct the printed image. These latent panel sets can be used to link a counterfeit document to a specific ribbon as well as to determine exactly what was printed on a ribbon when the counterfeit document is unavailable.
Forensic imaging of thermal ribbons has been performed for years. The two most common methods employed are transmitted light imaging and desktop scanning. Both of these technologies can provide an image suitable for deciphering the original printed information. However, the correct lighting is critically important and the image quality is often reduced due to poor contrast. Because most imaging systems, including the two listed, are designed for flat, sheet documents, the systems require an examiner to manually turn the spooled ribbon, flatten it, image it, and then repeatedly position the color panels for subsequent images. This process is labor intensive and can require many hours of examiner time to process a single ribbon. Aside from the time constraints, in this case the thermal ribbon is handled more and the alignment of the ribbon on the spool can be difficult to maintain.
In order to make the imaging process more efficient, an automated system was developed by Quantum Signal through the Combating Terrorism Technical Support Office Investigative and Forensic Science Subgroup (CTTSO/IFS). The Thermal Ribbon Analysis Platform (TRAP) is an imaging device designed to capture and process large amounts of data stored on ribbon spools.
Because the newly developed TRAP has not currently garnered wide acceptance in the forensic community, consideration was given to numerous criteria critical to acceptance in legal proceedings throughout the development and validation process. Key considerations included the use of standard operating procedures, testability, known or potential error rates, peer review, and tracking of image information to prevent data loss.
Material and methods
The Printing Process
Dye diffusion thermal transfer (D2T2), also referred to as dye sublimation, dye diffusion, or thermal dye, was developed by Sony in 1982 (Majima). The most common D2T2 process prints one color at a time. The colorants are stored on a thin film ribbon that contains each color on a separate panel. Each colored panel is the size of the medium that is being printed onto; for example, a CR-80 (credit card) sized ribbon would have four 3.375” x 2.125” panels (Figure 1).

Figure 1
Photo of a typical image set for a CR-80 (credit card) sized ribbon.
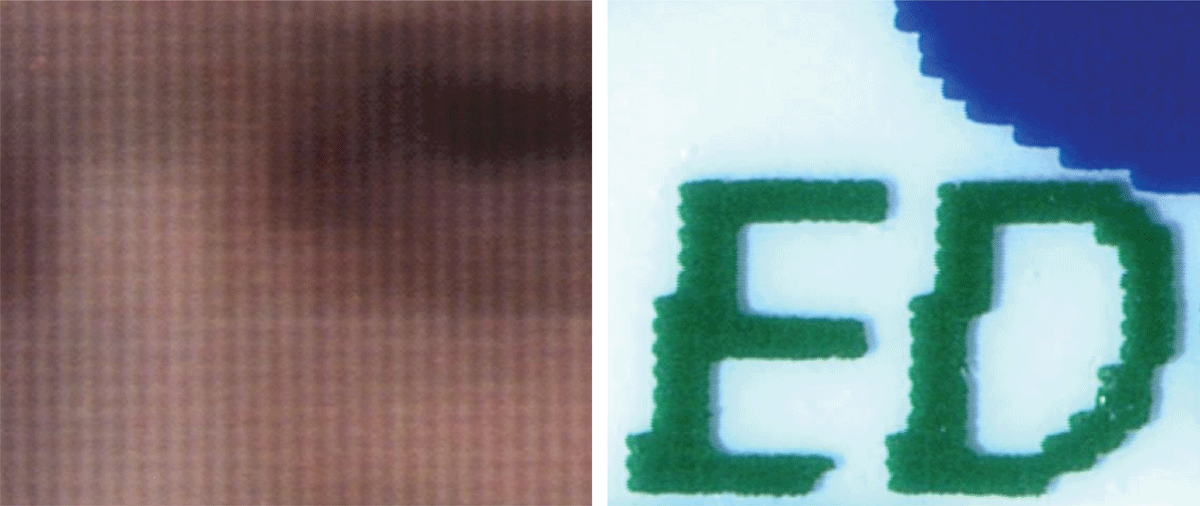
Figure 2
(Left) A magnified image of D2T2. (Right) A magnified image of TMT.
These printers are typically computer peripherals which communicate with the computer’s print spooler to drive a print head. During the printing cycle, the printer rollers move the substrate and one of the colored panels together under a thermal printing head. This head is usually the same width as the shorter dimension of the print medium. Tiny heating elements on the head change temperature rapidly thereby depositing different amounts of dye onto the substrate. As heat is applied to the ribbon the dye transfers. The heating process turns the solid dye into a gas by a process known as sublimation. Once the dye is heated into a gas, the dye diffuses onto the printing medium and re-solidifies. A small gap between the substrate and the ribbon allows the dye room to diffuse. After the printer covers the substrate with one color, it winds the ribbon to the next color panel and begins the sublimation process again. The overlaying of the various color panels forms a single, full-color image.
The second thermal printing process is thermal mass transfer (TMT), also known as thermal wax transfer, direct thermal transfer (D1T2), or hot wax transfer. Unlike D2T2, TMT is a bimodal process. This means the image transfer is on or off—either the transfer takes place or it does not. TMT printing yields solid single colors but cannot print high quality full color images due to its bi-modal nature. The ribbons used are coated with a specially formulated wax that contains a pigment or pigments. TMT creates an image by selectively transferring colored wax from a ribbon onto a substrate. The ribbon is pressed firmly against the substrate for TMT printing resulting in no gap and no diffusion.
It is with these printing processes that the opportunity exists to quickly and effectively recover evidence. Partial latent images are left behind on the thermal transfer ribbons, and these images can be recovered to yield a complete image. The images can be studied by forensic examiners to provide actionable intelligence, such as the facial images of suspects, to law enforcement. Previous research at the United States Secret Service has studied the feasibility of associating documents produced with thermal ribbon printers based on chemical analyses (LaPorte, et al., 2003). In that study it was noted that the images can be visually analyzed as well.
Development of TRAP
The goal for the TRAP was to develop a desktop scanner system that captures and reconstructs latent images from previously-used thermal ribbons. The vision for the system architecture consisted of a scanning device, an off-the-shelf computer, and custom software to control the device and to process the resulting scanned images (Figure 3).
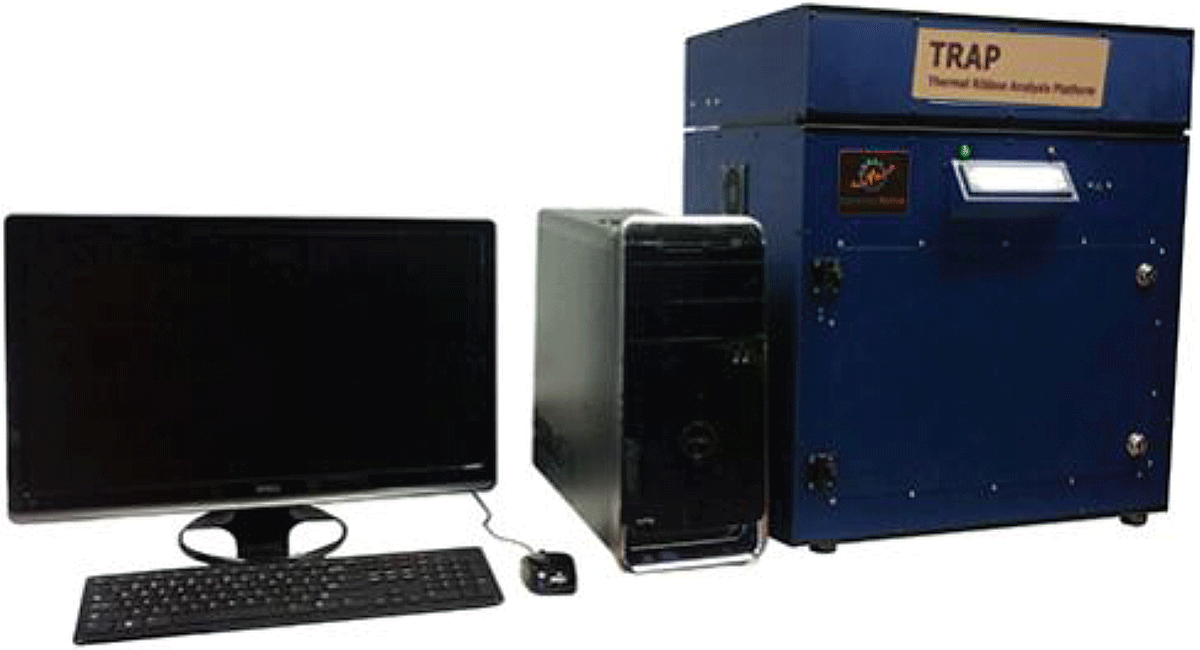
Figure 3
The TRAP system components.
A key set of functional requirements was generated for the TRAP which included the ability to: easily mount and image various dimension and form factor ribbons, select appropriate resolutions for the image quality, perform various image post-processing steps, and save images into standard file formats. Multiple sensor types and configurations for the scan system imaging hardware were evaluated before a Shäfter+Kirchhoff CCD line scan camera (SK5150VJR) was chosen for the TRAP. Because a line scan camera requires relative motion between the camera and the ribbon panels, it was decided that the best approach for TRAP was to achieve the motion by reeling the ribbon past the camera. To enable TRAP to scan a variety of ribbons of different widths and form factors, a TRAP “universal spool” was designed and fabricated. (Figure 4).
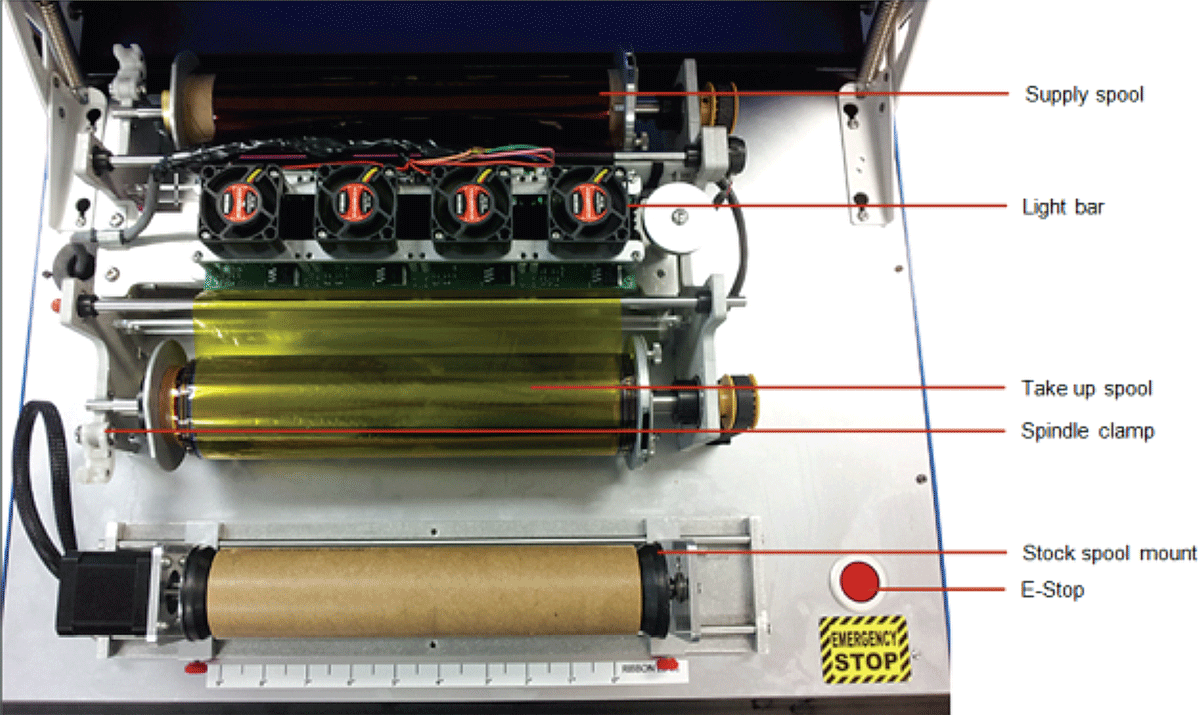
Figure 4
The TRAP spool configuration.
The TRAP uses custom software which controls all of the hardware functionalities of the device. Functionalities such as ribbon definition, case meta-data input, management and review of scans, and post-processing including basic correction techniques (image reverse, contrast enhance, and similar) are also included in the software that is capable of continuously imaging an entire ribbon. The software runs onboard the TRAP device and is accessed from an attached (or networked) PC using a standard web browser. Considerable effort was also put into developing calibration procedures for the TRAP’s light panel, color sensor, and camera to ensure optimum performance.
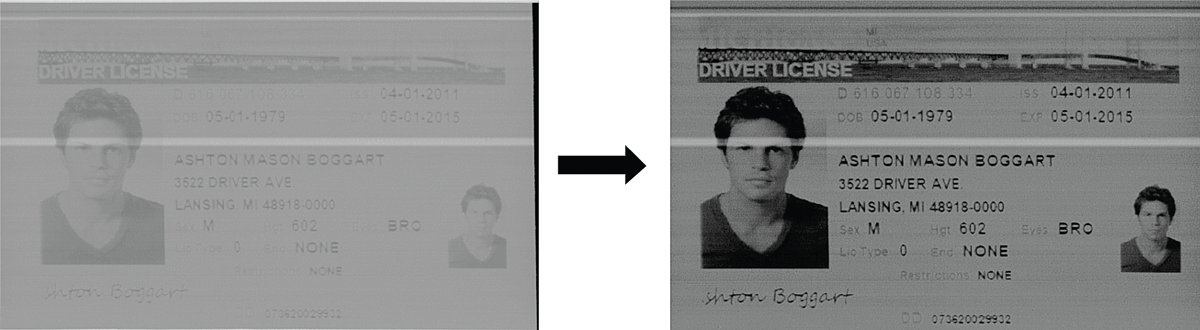
Figure 5
Raw, grayscale image and enhanced, processed image (cyan panel).
Testing Methodology
As a new technology, extensive testing was undertaken to assess the functionality of the TRAP. Validation testing of the TRAP evaluated the accuracy, repeatability, intermediate precision, and robustness of the system against a range of thermal ribbons.
The TRAP’s basic hardware and software functionality, repeatability, and inter-examiner variation using a multitude of different ribbon types and form factors were tested. Particular attention was paid to the design of the user interface.
A complete listing of the ribbons tested is included below (Table 1).
Table 1
A description of the ribbons used during the validation testing.
| Accuracy | ||
| Description | Number of Colors | Size |
| A CMY thermal ribbon | 3 | Photo (3.75” high) |
| A CMYO thermal ribbon | 4 | Letter (8.5” high) |
| A CMYKO thermal ribbon | 5 | CR-80 (2.125” high) |
| Repeatability | ||
| Description | Number of Colors | Size |
| A CMY thermal ribbon | 3 | Photo (4.25” high) |
| Intermediate Precision | ||
| Description | Number of Colors | Size |
| A CMYKK thermal ribbon | 5 | CR-80 (2.125” high) |
| Robustness | ||
| Description | Number of Colors | Size |
| A CMYO thermal ribbon | 4 | Letter (8.5” high) |
| A CMYK thermal ribbon | 4 | Letter (8.5” high) |
| A CMYKO thermal ribbon | 5 | CR-80 (2.125” high) |
| A CMYKK sized thermal ribbon | 5 | CR-80 (2.125” high) |
| A silver foil transfer ribbon | 1 | CR-80 (2.125” high) |
| A black label maker thermal ribbon | 1 | 0.75” high |
| A single row typewriter ribbon | 1 | 0.25” high |
Results
Test Results
Drivers’ licenses, green cards, and stock and birth certificates were among the documents printed on the test ribbons and used to validate TRAP. Figure 6 shows a typical result. The source images themselves were drawn from the web, and provided a reasonable emulation of real documents. Results from the cyan ribbon for these cases are presented.
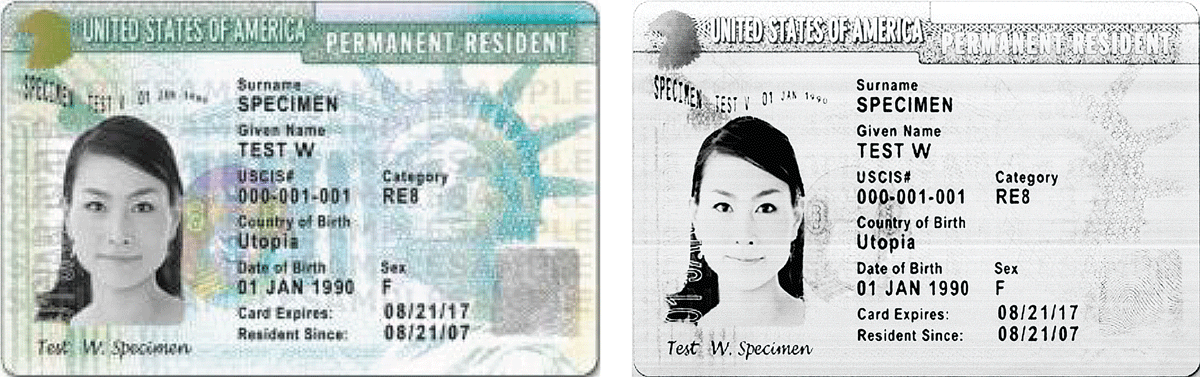
Figure 6
Original card image (left) and the enhanced cyan scan from the TRAP (right).
Initial manufacturer/design team comparisons of the original images used to generate the test ribbon and the test scan images revealed good agreement. Though this comparison is not strictly indicative of scan quality (it includes degradation introduced by the printing as well) the results were of sufficient quality so as to declare the technique successful even with the dual degradations.
Because the TRAP is relatively new, extensive validation testing was conducted to determine the instrument’s performance. Four major components of validation testing were documented: accuracy, repeatability, intermediate precision, and robustness.
The accuracy of capturing data from ribbons was initially determined by comparing the number of panel sets collected using the conventional method (scanning by hand) against the number of panel sets recovered and correctly processed by the TRAP. Three ribbons, each with eighteen (18) panel sets, were initially tested. Only one panel set from one of the ribbons was determined to be missing when the ribbons were scanned with the TRAP. All of the panel sets that were post-processed contained the same information as the conventional method. In other words, if the panel set was processed, it was processed correctly every time. Through additional accuracy validation testing, and several software revisions, the accuracy was eventually improved to 100%. Each and every panel set was captured correctly every time.
Repeatability was analyzed by having the same examiner process a single ribbon weekly for a month. The ribbon contained exactly 14 panel sets. The initial weekly testing revealed discrepancies with the number of images collected. Of the four weeks tested, the numbers of panel sets returned and processed were: 22, 14, 14, and 12. Through the iterative software revisions, the repeatability was improved. The final testing correctly revealed the 14 panel sets each of the four weeks tested. No images were missing or processed incorrectly.
To test the intermediate precision four examiners processed the same ribbon. When the four examiners processed the ribbon, every examiner obtained the correct number of panel sets. All of the images were consistent regardless of the examiner who collected them.
The robustness testing used ribbons containing varying combinations of color panel sets with ribbon heights ranging from 0.25” through 8.5”. It was determined that the order and number of color panels did not affect the processing of any ribbon. Furthermore, all of the ribbon heights tested could be mechanically processed through the TRAP without any damage due to strain. However, the largest ribbon, 8.5” in height, exhibited vignetting and cropping that prohibited the extreme edges from being captured. It was determined that the TRAP is best suited to image ribbons which are 8” in height or less as it successfully captured full images from all ribbons smaller than 8”.
Discussion
The TRAP, a new forensic imaging instrument that can recover data effectively and efficiently from a wide variety of ribbons, has been developed and thoroughly tested. It provides a combination of automatic recovery and enhancement tools from an integrated software application which supports a wide variety of output formats. Though initial testing identified several scenarios where images were dropped, software revisions corrected the issues identified in early testing. The TRAP now presents each and every panel on a ribbon regardless of user, repetition, or panel format.
Compared to the conventional method of hand spooling and scanning a thermal ribbon, the TRAP cuts the examiner time needed to complete a single ribbon analysis by as much as 95% (approximately 10 hours to hand scan versus 30 minutes using the TRAP). Freeing the examiner from the tedious work of imaging the panel sets allows the examiner time to conduct other exam related work. While the system requires only minimal user input, it still produces consistent, high resolution and high contrast images. The imaged results are easily exported into various non-proprietary file formats.
Throughout the quality assurance and validation testing it was quickly determined that the content of the printed material (e.g., driver’s license, permanent resident card, photograph, typewriting, etc.) did not play any significant role in the TRAP analysis and image processing. Likewise, the order of color panels, the number of color panels, and the size of the ribbon (under 8”) does not affect the processing of ribbon. A wide range of colors were successfully enhanced to include cyan, magenta, yellow, black, and silver. Even typewriting ribbons, with their small ribbon height, were able to be imaged.
Initial testing revealed that some panel sets were getting dropped in some scenarios. Through repeated testing and software revisions, it was demonstrated that the TRAP was processing all ribbons correctly under all scenarios. All of the post-processing problems which were initially identified have been resolved. As part of the software revisions, the post-processing was also separated from the image collection. This small but significant change decreased processing time even further as the computationally intensive post-processing was moved to a more powerful computer processor. Furthermore, the TRAP was freed to perform additional data collection instead of having to wait for post-processing to finish.
Validation testing revealed numerous applications which the TRAP is currently well-suited to handle. It is capable of scanning an array of ribbons with varied dimensions and color panel set combinations. All of the common color panel combinations were imaged on the TRAP with ease. While a few areas of improvement were identified, they occur infrequently. For example, because the user specifies the panel widths, the TRAP does not handle ribbons with varying color panel widths well. The system expects each color panel set on a multi-colored ribbon to be the same dimensions. Because the dimensions on most commercially available ribbons are the same for each color panel, this is an infrequently encountered challenge. Furthermore, because of the constraints on imaging larger format ribbons, the TRAP may not be the best tool to completely image ribbons larger than 8”. This restriction means that scanning a letter-sized thermal ribbon results in some of the image being cropped on the edges.
Conclusion
In summary, the TRAP is a useful, functional new tool available to the forensic community to image ribbon based material. It has applications for both thermal ribbon analysis and typewriting analysis. The TRAP is robust and can process ribbons covering a wide gamut of parameters and colors. Quality assurance and validation testing has shown that the equipment performs as designed and correctly captures all of the latent imagery on a ribbon.
Acknowledgements
The authors would like to thank Jeff Huber for spearheading the contracting logistics of this grant and program, and for lending his input and advice throughout. The TRAP was developed through funding from the Combating Terrorism Technical Support Office Investigative and Forensic Science (CTTSO/IFS) Subgroup as part of its continuing mission to combat terrorism. More information regarding this project can be found on the CTTSO website (Thermal Ribbon Analysis Platform | CTTSO, 2014).