
Introduction
FOR centuries handwritten signatures have been the unique means for guaranteeing the authenticity of a document such as wills, bank checks, agreements, etc. As a consequence, Forensic Handwriting Examiners (FHEs) have acquired a solid expertise in verifying the identity of a writer by comparing the static image of a questioned signature with the static images of genuine specimens.
At the beginning of the 2000s, to facilitate commerce, different laws in the U.S.A.1, 2, Europe3 Australia4, Canada5 and other countries around the world have established that documents signed with a compliant electronic signature have the same legal effect as traditional paper documents.
Nowadays, a lot of commercial solutions are proposed for signing NDAs (Non-Disclosure Agreements), forms, and contracts with an electronic pen-input device. The success of these commercial solutions is mainly due to two factors: on the one hand people are familiar with the use of signatures in their daily life as proof of their identity, on the other hand the other biometric techniques are more expensive and invasive.
Most vendors do not deal with automatic signature verification systems but they offer solutions for acquiring signatures and for storing them together with the documents. Usually, parameters such as pressure, acceleration, speed and rhythm are recorded (and embedded in the document together with the pen coordinates, pen pressure and pen inclination angles when an electronic signature is produced). In case of a legal dispute, a FHE can verify the authenticity of a signature by extracting it from the document and comparing it with specimens acquired in front of him or her or from those on a genuine document (that has an online signature).
The scientific community has always shown great interest in the automatic verification of both online and offline signatures6, 7. In the last years, one of the trends in this field of research is to see the FHE as the main actor of the verification stage and therefore to define methods and tools for supporting the examiner during document examination.
Furthermore, because a large amount of variability can be observed in the handwritten signatures of a subject produced at different times, many efforts of the scientific community have been carried out for the analysis of signature stability, i.e. to detect regions within the signature that exhibit less variability in different executions and to define on them a suitable set of effective features for automatic signature verification.
In this context, we propose a method for evaluating the authorship of a signature based on shape and time duration of the signature’s stability regions and not based on other dynamic information as pressure and pen inclination because there is no agreement in literature if they are useful8 ore misleading9 for verification purpose. In the following, Section 2 describes how signatures are modeled and represented. Section 3 introduces the stability regions and the method for evaluating the genuineness of a signature by using the information conveyed by the shape and the duration of the stability regions. In Section 4, the results obtained with the presented method on a standard database are shown. Finally, in the last section we discuss the results and outline future works.
Methods and Materials
Signature representation
According to handwriting studies, the complex movements needed to produce an handwritten trace can be seen as a composition of elementary movements, each corresponding to an elementary shape or stroke10.
A signature is a highly automated motor task that the writer has learned over the years, and therefore it has been stored in his/her brain as both a sequence of target points to reach and a sequence of motor commands to be executed11. At the beginning of learning to write, each stroke is aimed at reaching the target point that has been visually selected, it is executed independently from the previous or the following ones. By repeated practice, the sequence of target points becomes familiar to the writer, as well as the sequence of motor commands needed to execute the elementary movements. In this way the next movement can be planned before the current one terminates. This anticipation allows for faster and more economic writing movements. When the learning is completed, fluency is achieved, in that the whole sequence of motor commands has been learned and stored in such a way that it is restored from memory and the corresponding movements executed automatically with proper timing and without any visual and proprioceptive feedback, as it were an elementary movement10, 12.
According to those findings, and because in the case of a highly automated handwriting movement, such as a signature, its central neural coding is less prone to variations than the peripheral parameters reflecting the timing properties of the muscular system activated by the action plan, we assume that the sequence of strokes corresponding to well learned movements will appear in many instances of a signature. Therefore, such sequences of strokes represent the desired stability regions.
Accordingly, for representing and comparing signatures, we need to decompose them into the corresponding sequence of strokes. For this purpose, we adopt a stroke segmentation method that mimics some of the features of the primate visual system. In the primate visual system visual neurons are most sensitive in a small region in the center of the visual space. While stimuli in the surrounding weaker antagonistic regions outside of but concentric with the center, inhibit the neuronal response. Being sensitive to local discontinuities, this architecture is particularly well-suited to detecting locations which stands out from their surroundings and represents a general computational principle in the retina, lateral geniculate nucleus, and primary visual cortex13.
Building a visual system inspired by this architecture raises the very issue of what kind of information should be used, how center-surrounding operations should be implemented to build a feature map and how to compute the conspicuity of the features. Among the many implementations presented in the literature, the saliency-based one proposed in14 constructs a multiscale feature representation of the visual scene by progressively low-pass filtering and subsampling the input image, implements center-surrounding operations as differences between fine and coarse scales to build the feature map and adopts biologicallyplausible solutions for both evaluating the saliency of the features and detecting the most salient parts of the original image.
In the light of those findings, and according to the findings on handwriting generation mentioned in the introduction, handwriting segmentation can be seen as a preattentive, purely bottom-up visual task, aimed at selecting from the written line a subset of points that should be passed on for further processing, this selection being based on visual information associated with changes of curvature along the ink. For implementing this approach we assume as scale the number of points P used to represent the written line and:
build the multiscale representation of the ink by measuring the curvature of the ink for P = 3, 4, …, N, where N is the number of points of the electronic written line as provided by the tablet;
perform the center-surround operations by finding the curvature local maxima at each scale;
merge the curvature maps across the scales for building the saliency map;
select the most salient points as the ones whose saliency is greater than the average saliency.
The desired segmentation points are the point of the ink that corresponds to the most salient points, i.e. to the points corresponding to the sharpest changes in curvature. The method is described in detail in15. Figure 1 shows the segmentation points provided by the algorithm on some signatures from the dataset used in the experiments described in Section 3.
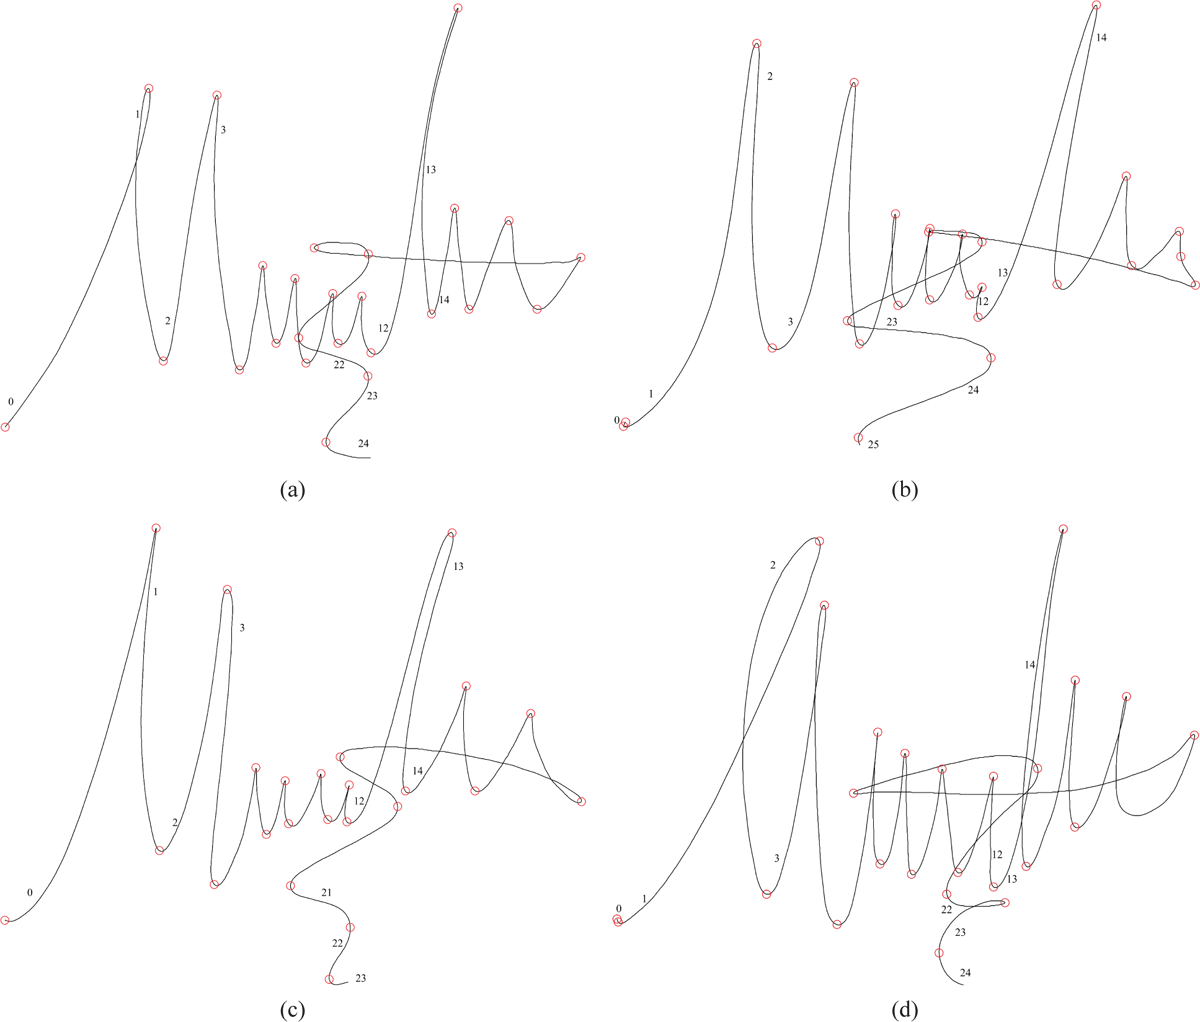
Figure 1.
Some signatures extracted from the dataset used for the experimentation. (a), (b) and (c) are genuine signatures produced by a writer, whereas the signature (d) is an attempt to forge them made by another writer. The signatures (a) and (b) are used as references in the example presented in this paper whereas (c) and (d) are used as questioned signatures. The red dots represent the segmentation points produced by the stroke segmentation algorithm. To ease the reading, some strokes are numbered in figure.
Stability Regions and Duration
The detection of the stability regions is achieved by an algorithm that finds the longest common sequences of strokes with similar shapes between the traces of a pair of signatures. For deciding when two sequences are similar enough, we exploit again the concept of saliency that has been proposed to account for attentional gaze shift in primate visual systems. The rationale behind this choice is that, by evaluating the similarity for longer and longer sequences of strokes and then by counting the number of the most similar sequences of strokes that have been found in the signature, sequences of strokes that are “globally” more similar than others will stand out in the saliency map. The “global” nature of saliency guarantees that its map provides a more reliable estimation of ink similarity with respect to that provided by the “local” smoothness of the ink, as it is usually proposed in the literature. For finding the most similar sequence of strokes we: (1) measure the shape similarity between pairs of strokes, (2) compute the shape similarity of a sequence by adding the shape similarity of its strokes and (3) then normalize this value with respect to the number of the strokes in the sequence16, 17.
According to the signature representation, the longer the stability region, the higher the level of automation when it was generated, and therefore long stability regions are more writer-specific than short ones.
For evaluating if a questioned signature is genuine or not, at least two genuine signatures are required in order to assess the intra-writer variability. As a consequence, we choose for each writer two signatures that are representative of his signing habits and we call them references and they will be denoted by ref1 and ref2. In a previous work18, we have shown how to select the best references when a set of genuine and forged signatures are available.
Given two references, the stability regions between them are represented by the longest sequences of elementary movements executed in a highly automated fashion, i.e. the longest similar sequences of strokes (LSSSs). Figures 2 and 3 shows the LSSSs found on the saliency map obtained when comparing the reference signatures shown in Figures 1.a and 1.b. As Figure 2 shows, there are four LSSSs: the first one is made of the strokes of the reference 1.a numbered from 1 to 4 and of the strokes of the reference 1.b numbered from 2 to 5; the second is made of the strokes of the reference 1.a numbered from 7 to 11 and of the strokes of the reference 1.b numbered from 6 to 10; the third is made of the strokes of the reference 1.a numbered from 12 to 15 and of the strokes of the reference 1.b numbered from 13 to 16; eventually, the last LSSS is made of strokes of the reference 1.a numbered from 19 to 23 and of the strokes of the reference 1.b numbered from 20 to 24.
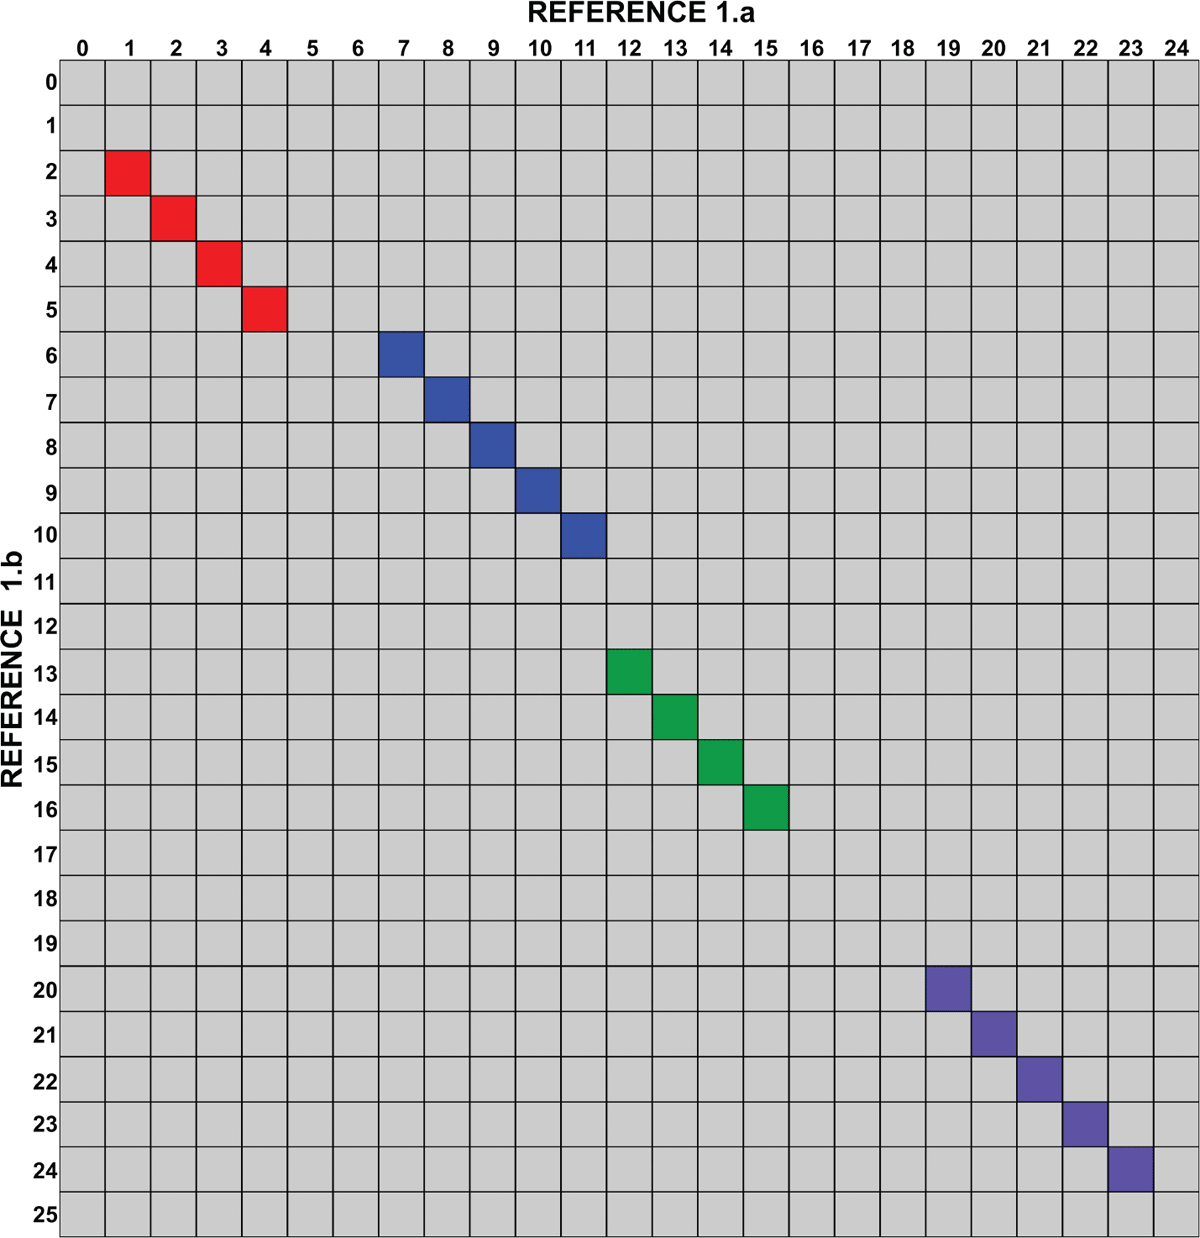
Figure 2.
The saliency map obtained by comparing the two references (the signatures in the Figures 1.a and 1.b). The number of each row/column refers to the numbering of the strokes as in Fig. 1. In red, blue, green and violet are highlighted the four LSSSs found in the map that represent the stability regions of the two signatures. The LSSSs are represented in Figure 3 on the two references segmented in strokes.
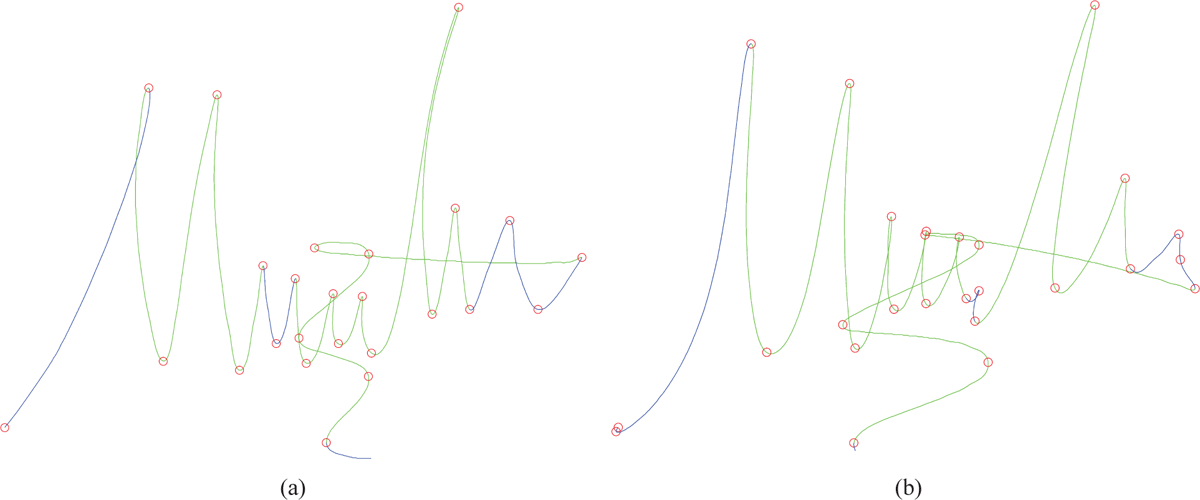
Figure 3.
In green are painted the stability regions detected by matching the ink of the reference signatures shown in Figure 1.a and 1.b. The target points are in red. Note that the first and the second stability regions are separated by two strokes in the reference (a), while there is no break between them in the reference (b). The second and the third stability regions are separated by two strokes in the reference (b), while there is no break between them in the reference (a). The third and the fourth stability regions are separated by three strokes in both references.
The lengths of the stability regions found by matching the references amongst themselves are equal to the number of strokes belonging to the LSSSs and they are denoted by Ls(ref1) and Ls(ref2) respectively. In general, due to the intra-writer variability and/or to the errors introduced by the stroke segmentation algorithm, Ls(ref1) and Ls(ref2) are different. In the examples reported in Figures 2 and 3, Ls(ref1) and Ls(ref2) are both equal to 18 strokes.
Once the references for a writer have been selected, any other signature f, genuine or not, must be compared with both the references19. Denoting with Lm(f,ref1) and Lm(f,ref2) the lengths of the LSSSs between the reference refi (i=1,2) and f, respectively, the signature f can be mapped in a two dimensional space S by computing its coordinates
1
[TeX:] \documentclass[10pt]{article} \usepackage{wasysym} \usepackage[substack]{amsmath} \usepackage{amsfonts} \usepackage{amssymb} \usepackage{amsbsy} \usepackage[mathscr]{eucal} \usepackage{mathrsfs} \usepackage{pmc} \usepackage[Euler]{upgreek} \pagestyle{empty} \oddsidemargin -1.0in \begin{document} \[ r_{1}= \frac{L_{m}(f, ref_{1})} {L_{s}(ref_{1})}\ \ and\ \ r_{2}= \frac{L_{m}(f, ref_{2})} {L_{s}(ref_{2})} \] \end{document}Since r1 and r2 vary between 0 and 1, S assumes the shape of a square.
It is known from the Fitts’ law20 that the speed and the accuracy of a human movement are related and, in particular, the greater the required accuracy the slower the movement to achieve it. It follows that a forgery cannot be accurate in reproducing the speed of movements and the shape of the signature trajectory at the same time: an accurate copy of the shape trajectory is produced in a time longer than the time required by the author of the genuine signature. In fact, during the forgery process the target points are visually selected from the specimen and each stroke is executed independently from the others and therefore this stop-and-go writing modality is slower than the highly automated handwriting movements performed by the author of the genuine specimen.
By taking into account the speed-accuracy tradeoff, we verify whether the time needed to execute the strokes of f which are evaluated as similar to the strokes of the stability regions found on the references is similar to the time needed to execute the corresponding strokes on the reference.
Denoting by (sr1, sr2) a couple of similar strokes belonging to the stability regions, and denoting by sf a stroke of f similar to sr1 or to sr2, i.e. that belongs to the LSSSs between the reference refi and f, the time to execute the stroke sf is considered similar to the time to execute either sr1 or to sr2 if:
2
[TeX:] \documentclass[10pt]{article} \usepackage{wasysym} \usepackage[substack]{amsmath} \usepackage{amsfonts} \usepackage{amssymb} \usepackage{amsbsy} \usepackage[mathscr]{eucal} \usepackage{mathrsfs} \usepackage{pmc} \usepackage[Euler]{upgreek} \pagestyle{empty} \oddsidemargin -1.0in \begin{document} \[ \left\vert \vert t(S_{r1})- t(S_{r2})\vert - \frac{(t(S_{f})-t(S_{r1})\vert+ \vert t(S_{f})-(S_{r2})\vert)}{2}\right\vert < T_{w} \] \end{document}where t() is the time duration of a stroke, and Tw is a threshold expressing the difference in the time duration between sr1 and sr2 and between them and sf. In the experiments below, Tw has been fixed by maximizing both the number of pairs of matching strokes extracted by the LSSSs between genuine signatures for whom the left side of equation 2 is smaller than Tw and the number of pairs of matching strokes extracted by the LSSSs between genuine and forged signatures for whom the left side of equation 2 is greater than Tw, averaged over the signatures produced by different writers.
In Figure 4 we show on a forged questioned signature the LSSSs found when matching the questioned with the references of Figure 3. In Table 1 we report the time duration of the strokes belonging to the first LSSS in the references and in the forged questioned signature. In Figures 5 and 6, we show on the genuine questioned signature (that is shown in Figure 1.c) the LSSSs found when matching the questioned with the references of Figure 3. In Table 2 the time duration of the strokes belonging to the last LSSS in the references and in the genuine questioned is reported.
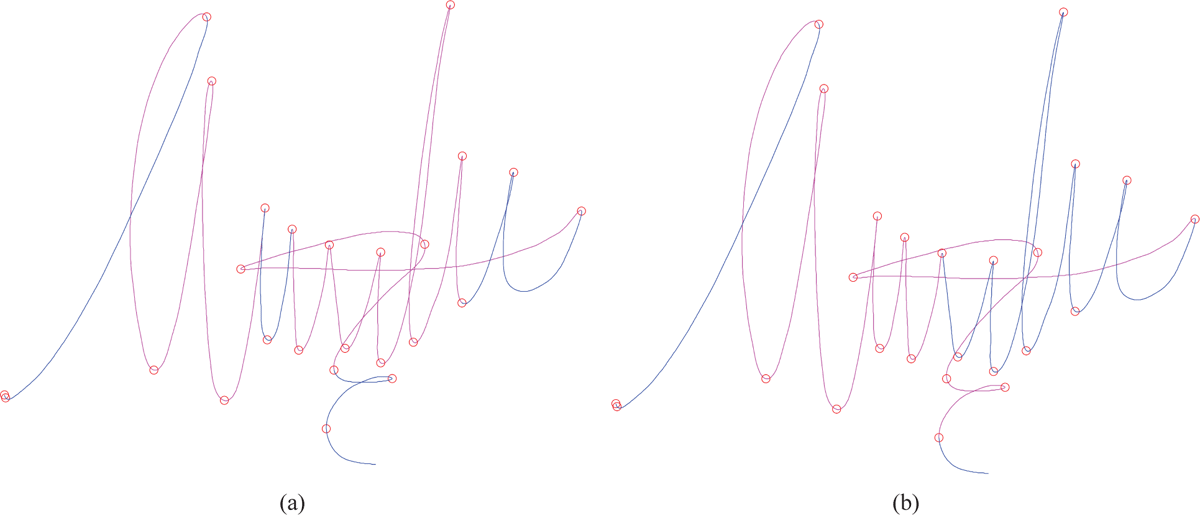
Figure 4.
The stability regions found on the questioned signature in Figure 1.d when compared with reference 1 in Figure 1.a and with reference 2 in Figure 1.b. The longest common sequences of strokes between the reference 1 and the questioned and between reference 2 and the questioned are painted in magenta in (a) and (b), respectively. None of the strokes belonging to the two longest common sequences have a duration compatible with the corresponding strokes in the two references. As a consequence, the questioned is correctly classified as a forgery.
Table 1. Duration of Some Matching Strokes
Table 1
The time duration of the strokes belonging to the first stability regions in Figures 3.a, 3.b, 4.a and 4.b. The questioned signature is represented in Figure 1.d. Note that the time duration of the stokes of the stability regions of the references is much smaller than the time duration of the stokes of the stability regions of the questioned. Note that none of the strokes belonging to the questioned signature and reported in this table satisfy the equation 2.
| Index and Time Duration of Each Stroke Belonging to a Sequence | ||||
| First LSSS on Reference 1 | 1 (151.67 ms) | 2 (145 ms) | 3 (131.67 ms) | 4 (90.67 ms) |
| First LSSS on Reference 2 | 2 (136.05 ms) | 3 (146.99 ms) | 4 (129.64 ms) | 5 (100.45 ms) |
| Stokes belonging to the Questioned Signature that match with the First LSSS on Reference 1 and Reference 2 | 2 (316 ms) | 3 (252 ms) | 4 (280 ms) | 5 (206.67 ms) |
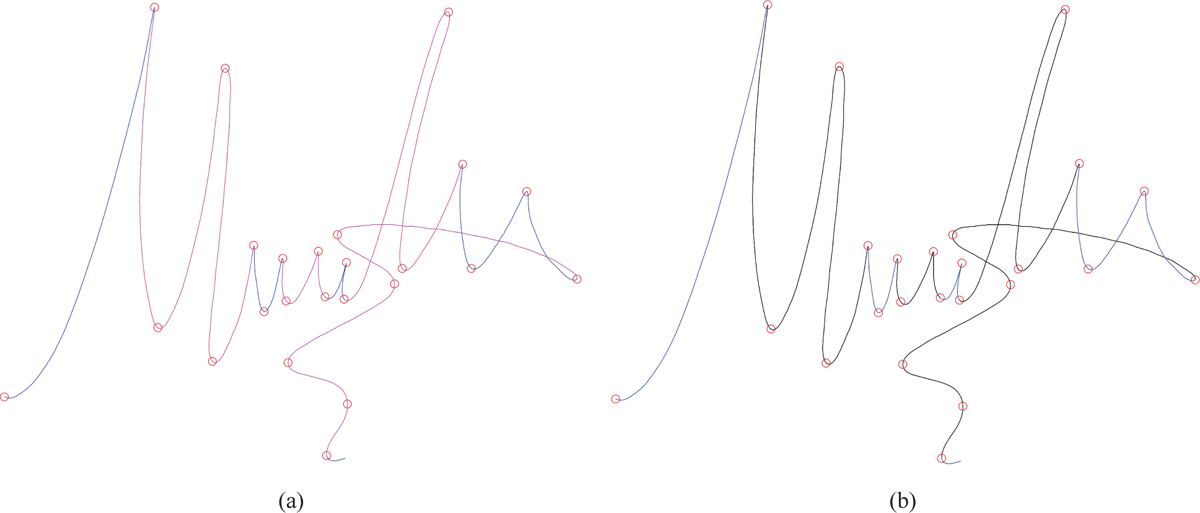
Figure 5.
The stability regions found on the questioned signature in Figure 1.c when compared with reference 1 in Figure 1.a The longest common sequences of strokes between the reference 1 and the questioned are painted in magenta in (a). The strokes belonging to the longest common sequences with a time duration compatible with the corresponding strokes in the reference are painted in black (b). All the strokes satisfy the equation (2) and so the same set of strokes are painted in magenta and in black.
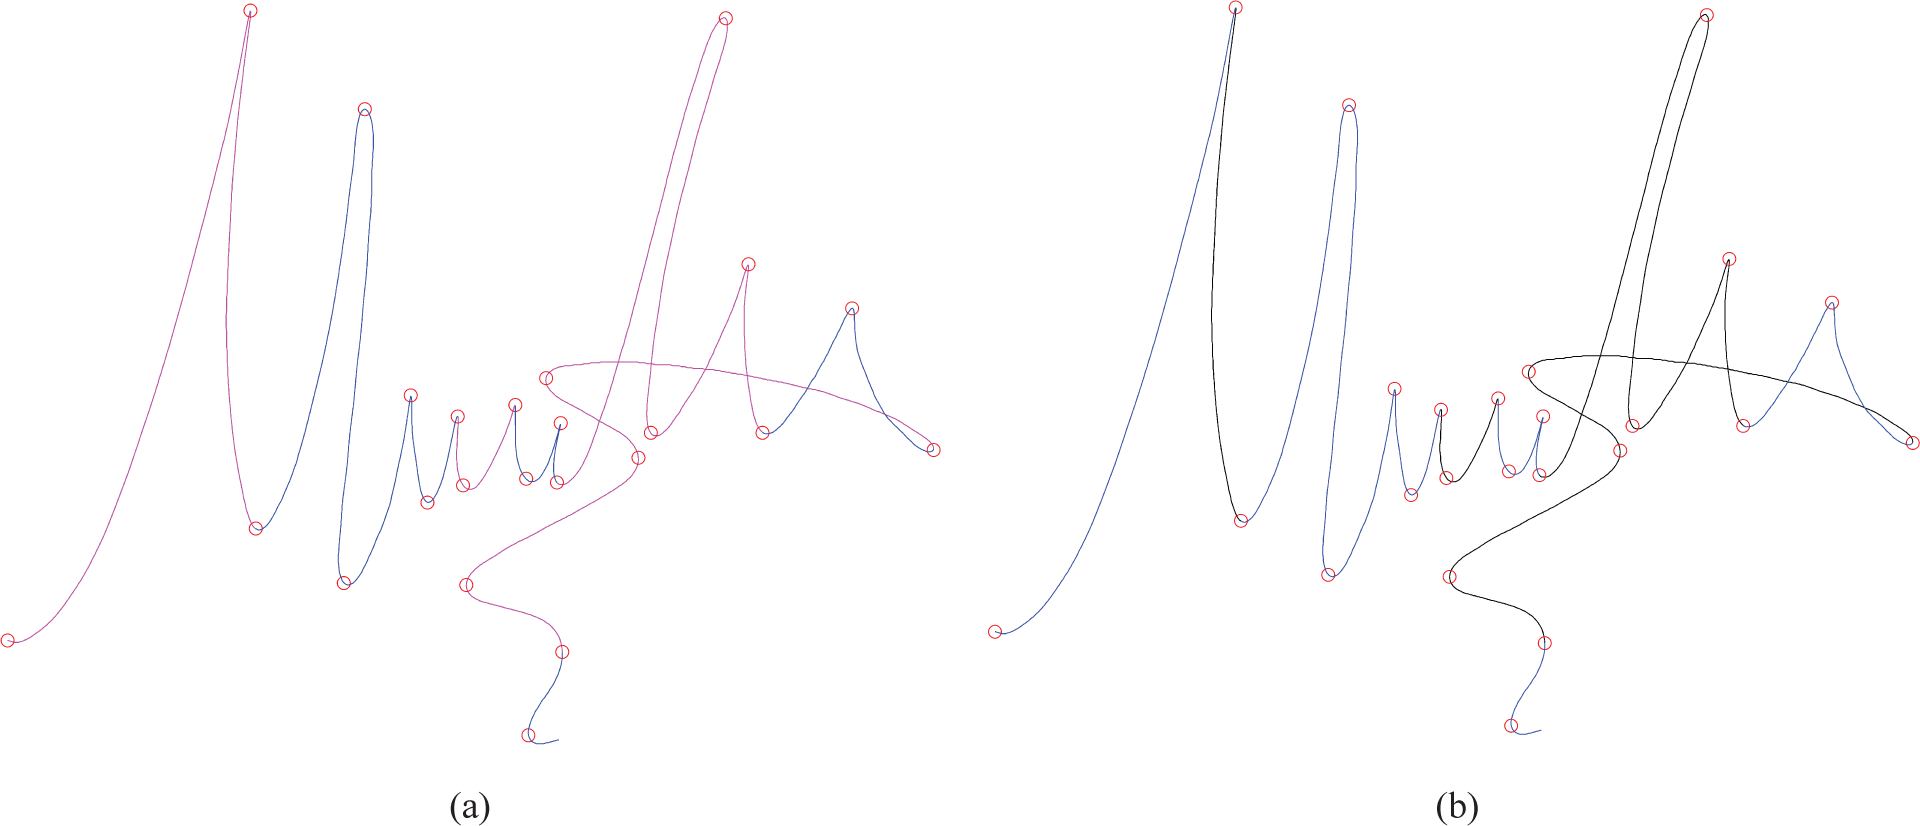
Figure 6.
The stability regions found on the questioned signature in Figure 1.c when compared with reference 2 in Figure 1.b The longest common sequences of strokes between the reference 1 and the questioned are painted in magenta in (a). The strokes belonging to the longest common sequences with a time duration compatible with the corresponding strokes in the reference are painted in black (b). Only the first stroke do not satisfy the equation (2) and it is removed from the first LSSS.
Table 2. Duration of Some Matching Strokes
Table 2
The time duration of the strokes belonging to the last stability region in Figures 3.a, 3.b, 5.a and 6.a. The questioned signature is represented in Figure 1.c. Note that the difference in the time duration of the stokes belonging to the stability regions of the references and of the questioned is much smaller than in the case reported in Table 1. All the stokes belonging to the questioned signature and reported in this table satisfies the equation 2 therefore the strokes are similar in shape and time.
| Index and Time Duration of Each Stroke Belonging to a Sequence | |||||
| Last LSSS on Reference 1 | 19 (131.19 ms) | 20 (52.94 ms) | 21 (66.38 ms) | 22 (58.25 ms) | 23 (52.41 ms) |
| Last LSSS on Reference 2 | 20 (127.50 ms) | 21 (51.82 ms) | 22 (74.93 ms) | 23 (68.71 ms) | 24 (79.15 ms) |
| Stokes belonging to the Questioned Signature that match with the last LSSS on Reference 1 | 18 (131.94 ms) | 19 (67.78 ms) | 20 (76.00 ms) | 21 (64.81 ms) | 22 (50.06 ms) |
| Stokes belonging to the Questioned Signature that match with the last LSSS on Reference 2 | 18 (131.94 ms) | 19 (67.78 ms) | 20 (76.00 ms) | 21 (64.81 ms) | ____ |
If LDi strokes of the LSSSs between the reference refi and f do not satisfy equation 2, f is mapped in a point of the space S with coordinates
3
[TeX:] \documentclass[10pt]{article} \usepackage{wasysym} \usepackage[substack]{amsmath} \usepackage{amsfonts} \usepackage{amssymb} \usepackage{amsbsy} \usepackage[mathscr]{eucal} \usepackage{mathrsfs} \usepackage{pmc} \usepackage[Euler]{upgreek} \pagestyle{empty} \oddsidemargin -1.0in \begin{document} \[ r_{1} = \frac{L_{m}(f, ref_{1})-L_{D1}} {L_{s}(ref_{1})}\ \ and\ \ r_{2} = \frac{L_{m}(f, ref_{2})-L_{D2}} {L_{s}(ref_{2})} \] \end{document}From equations 1 and 3 it follows that when the duration of the movements is evaluated together with the stability regions, signatures that are similar in shape but are not similar in duration move toward the point (0,0) of the space S, whereas signatures that are similar in shape and in duration are near to the point (1,1).
For example, when the signature in Figure 1.d is compared with the two references Lm(f,ref1) is equal to 16 strokes, Lm(f,ref2) is equal to 13 strokes, LD1 is equal to 16 strokes and LD2 is equal to 13 strokes therefore r1 and r2 are both equal to 0 strokes and the signature is classified as forged.
If a set of genuine and forged signatures for a writer is available, it is possible to select the references and to find two regions, Cg and Cf, by mapping the other signatures in the space S. Cg is defined as the portion included in S of the circle centered at the point (1,1) with radius Tg equal to the distance of the forged signature nearest to the point (1,1). Cf is the portion included in S of the circle centered at the point (0,0) with radius Tf equal to the distance of the genuine signature nearest to the point (0,0).
The references, with their stability regions, and the regions Cg and Cf are our model of the signer. In Figure 7 the space S and the regions Cg and Cf are shown.
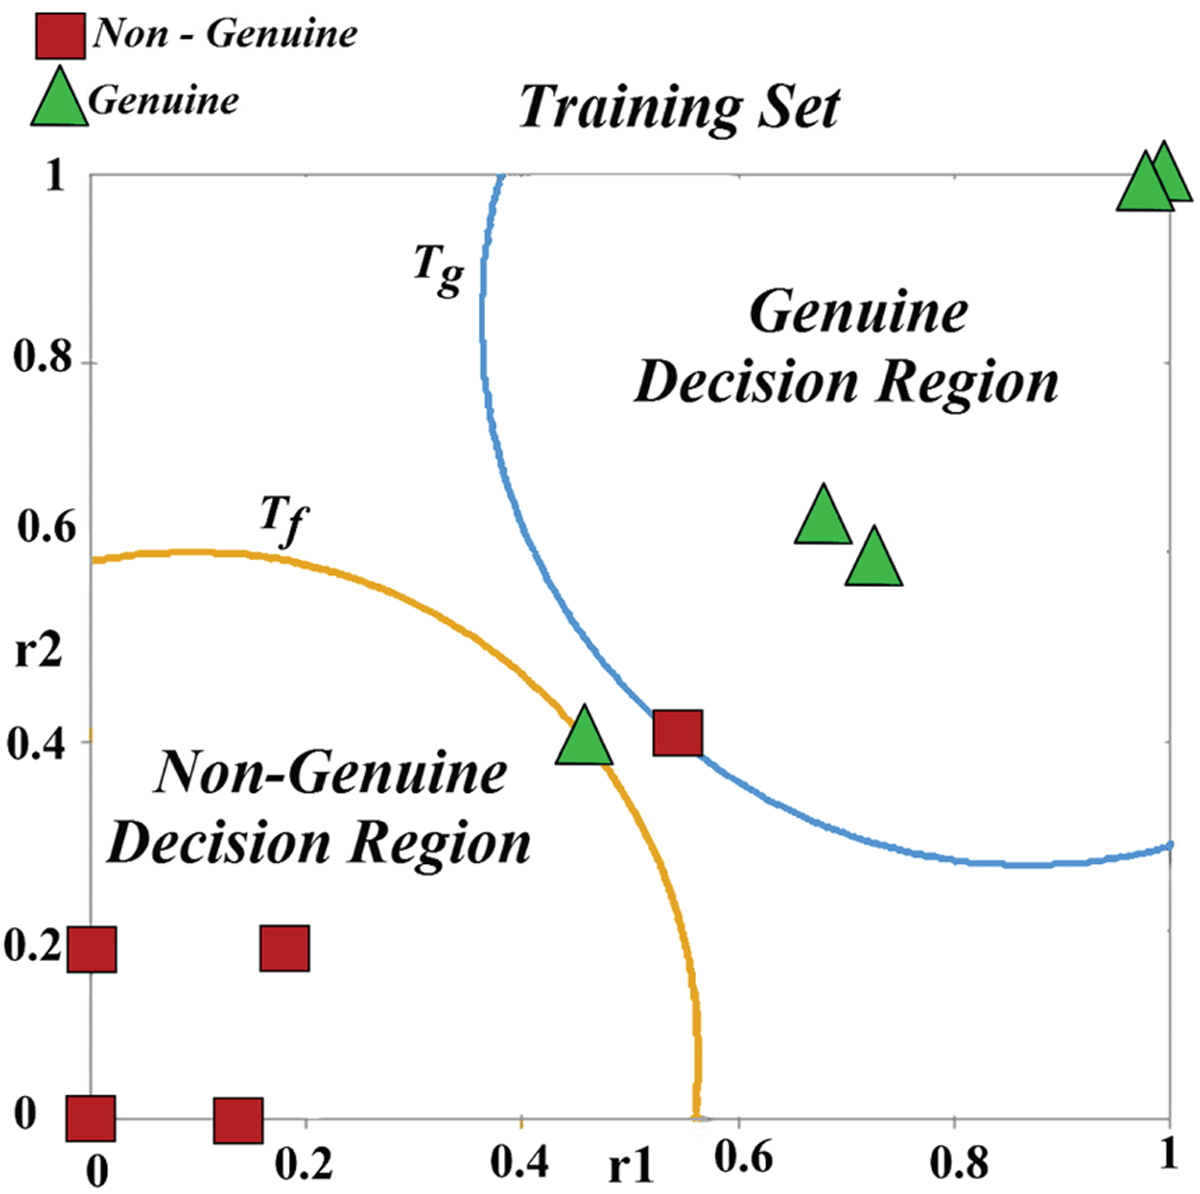
Figure 7.
Model of the signer. The space S defined by the references, the decision region and the signatures belonging to the training set.
Experimental Results
To prove that the proposed method is useful for designing an automatic signature verification system, we have performed the verification tasks in two different conditions: in the first one, the signatures were mapped in S according to equation 1, in the second one, they were mapped in S according to equation 3.
Signatures were classified by evaluating the position of the corresponding points respect to the two regions Cg and Cf:
If the regions Cg and Cf overlap, a signature is considered genuine if it belongs to the intersection and it is nearest to Tg than to Tf;
If the regions Cg and Cf do not overlap or the signature doesn’t belong to the intersection, a signature is considered genuine if it is mapped in the region Cg or if it is out of Cg but nearest to Tg than to Tf.
The performance of the proposed method has been evaluated on the signatures of the Visual subcorpus of the SUSIG database. In particular, the Visual subcorpus consists of signatures donated by 100 unique signers in two different sessions. Each signer provided 10 genuine signatures during each session, whereas 10 skilled forgeries (5 skilled and 5 highly skilled) were collected for each of them21.
The threshold Tw was computed on the Blind subcorpus of the same database and it results equal to 20 ms. The performance metrics used for evaluating the proposed method are the False Acceptance Rate (FAR), the False Rejection Rate (FRR) and the recognition rate. The FAR is a measure of the likelihood that the verification system will accept as genuine a forged signature and it is computed using the equation 4, the FRR is a measure of the likelihood that the verification system will classify a genuine signature as a forged one and it is computed using the equation 5. Eventually, then recognition rate is a measure of the likelihood that the verification system will classify in the right way a signature under analysis and it is computed using the equation 6.
4
[TeX:] \documentclass[10pt]{article} \usepackage{wasysym} \usepackage[substack]{amsmath} \usepackage{amsfonts} \usepackage{amssymb} \usepackage{amsbsy} \usepackage[mathscr]{eucal} \usepackage{mathrsfs} \usepackage{pmc} \usepackage[Euler]{upgreek} \pagestyle{empty} \oddsidemargin -1.0in \begin{document} \[ \rm{FAR} = \frac{\rm{Number}\ \rm{of}\ \rm{forged}\ \rm{signatures}\ \rm{classified}\ \rm{as}\ \rm{genuine}} {\rm{Number}\ \rm{of}\ \rm{forged}\ \rm{signatures}} \] \end{document}5
[TeX:] \documentclass[10pt]{article} \usepackage{wasysym} \usepackage[substack]{amsmath} \usepackage{amsfonts} \usepackage{amssymb} \usepackage{amsbsy} \usepackage[mathscr]{eucal} \usepackage{mathrsfs} \usepackage{pmc} \usepackage[Euler]{upgreek} \pagestyle{empty} \oddsidemargin -1.0in \begin{document} \[ \rm{FRR} = \frac{\rm{Number}\ \rm{of}\ \rm{genuine}\ \rm{signatures}\ \rm{classified}\ \rm{as}\ \rm{forged}} {\rm{Number}\ \rm{of}\ \rm{genuine}\ \rm{signatures}} \] \end{document}6
[TeX:] \documentclass[10pt]{article} \usepackage{wasysym} \usepackage[substack]{amsmath} \usepackage{amsfonts} \usepackage{amssymb} \usepackage{amsbsy} \usepackage[mathscr]{eucal} \usepackage{mathrsfs} \usepackage{pmc} \usepackage[Euler]{upgreek} \pagestyle{empty} \oddsidemargin -1.0in \begin{document} \[ Recognition\ Rate = \frac{\rm{Number}\ \rm{of}\ \rm{signatures}\ \rm{correctly}\ \rm{classified}} {\rm{Number}\ \rm{of}\ \rm{signatures}\ \rm{to}\ \rm{be}\ \rm{evaluated}} \] \end{document}In our experiments the signatures of each user were randomly divided into two disjoined subsets, the training set, made of 5 genuine and 5 forged signatures, and the test set containing the remaining ones. The best results obtained in 6 different subdivisions of the dataset are reported in Table 3 and Table 4
Table 3. Results on Susig Database, Visual Subcorpus – Session 1
Table 3
The best results obtained in 6 different subdivisions of the Visual subcorpus, session 1
| Recognition Rate | FAR | FRR | |
| Stability regions | 87.44% | 10.05% | 15.05% |
| Stability regions and Time Duration | 95.00% | 1.53% | 8.46% |
Table 4. Results on Susig Database, Visual Subcorpus – Session 2
Conclusion
We have presented a method for evaluating the genuineness of a signature that follows from both handwriting generation and motor control studies, which can support FHEs in signature verification and examination.
We have investigated if looking at both the shape and the time duration of the stability regions improves the performance of a signature verification system, because it is known from the Fitts’ law that the forgery process of a signature cannot be accurate in the shape and in the dynamics at the same time.
For this purpose, we have performed a signature verification experiment on a standard database as described in the previous section.
The experimental results, reported in table 3 and in table 4, show that the false acceptance rate drops more than the false reject rate when stability regions are combined with the information about the time duration of movements. In particular, the decrease of the FAR confirms what the Fitts’ law suggests.
The minor decrease of the FRR can be explained by taking into account that a writer could use different motor programs for producing his signature. If the selected references are two instances of the same motor program it follows that signatures that are instances of a different motor program will be classified as forged.
Because the results suggest that the performance of the method is strongly influenced by the choice of the references and by the set of signatures used for computing the two thresholds, in future investigations the proposed method will be evaluated comparing two signatures at a time and providing a similarity value between the genuine and the questioned, rather than just the final decision. In this way only one specimen and no forged signatures will be required for training, and we expect the results to be more robust when the same subject uses different signing habits in different executions.
FHEs can take advantage using the proposed method because it represents and elaborates signatures on the base of a handwriting generation model, and as such attempts to model both the shape and dynamics of the signature, which are also the two main features FHEs use to evaluate. Because of that, it should be easier for them to weight the evidence produced by the system with those obtained from the other steps of the verification process in order to reach the final decision.