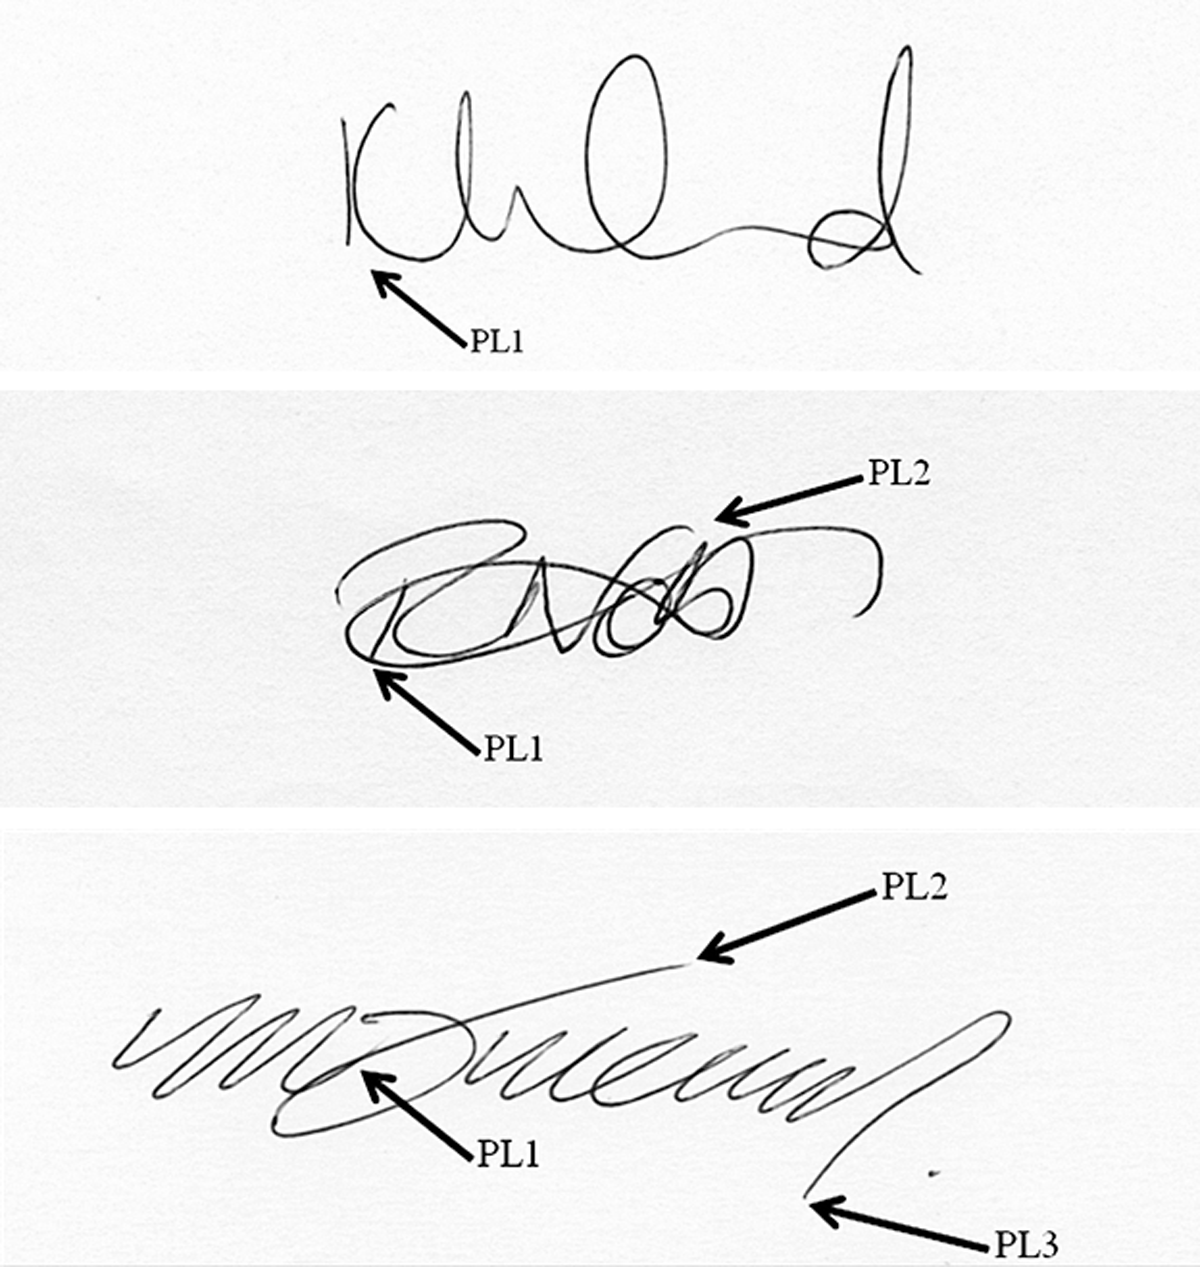
Figure 1.
Example of three genuine signatures containing one, two and three pen lifts respectively. Regions where pen lifts occur are notated as PL indicating ‘pen lift’, followed by a number indicating whether the lift is the first, second or third lift within the signature formation.
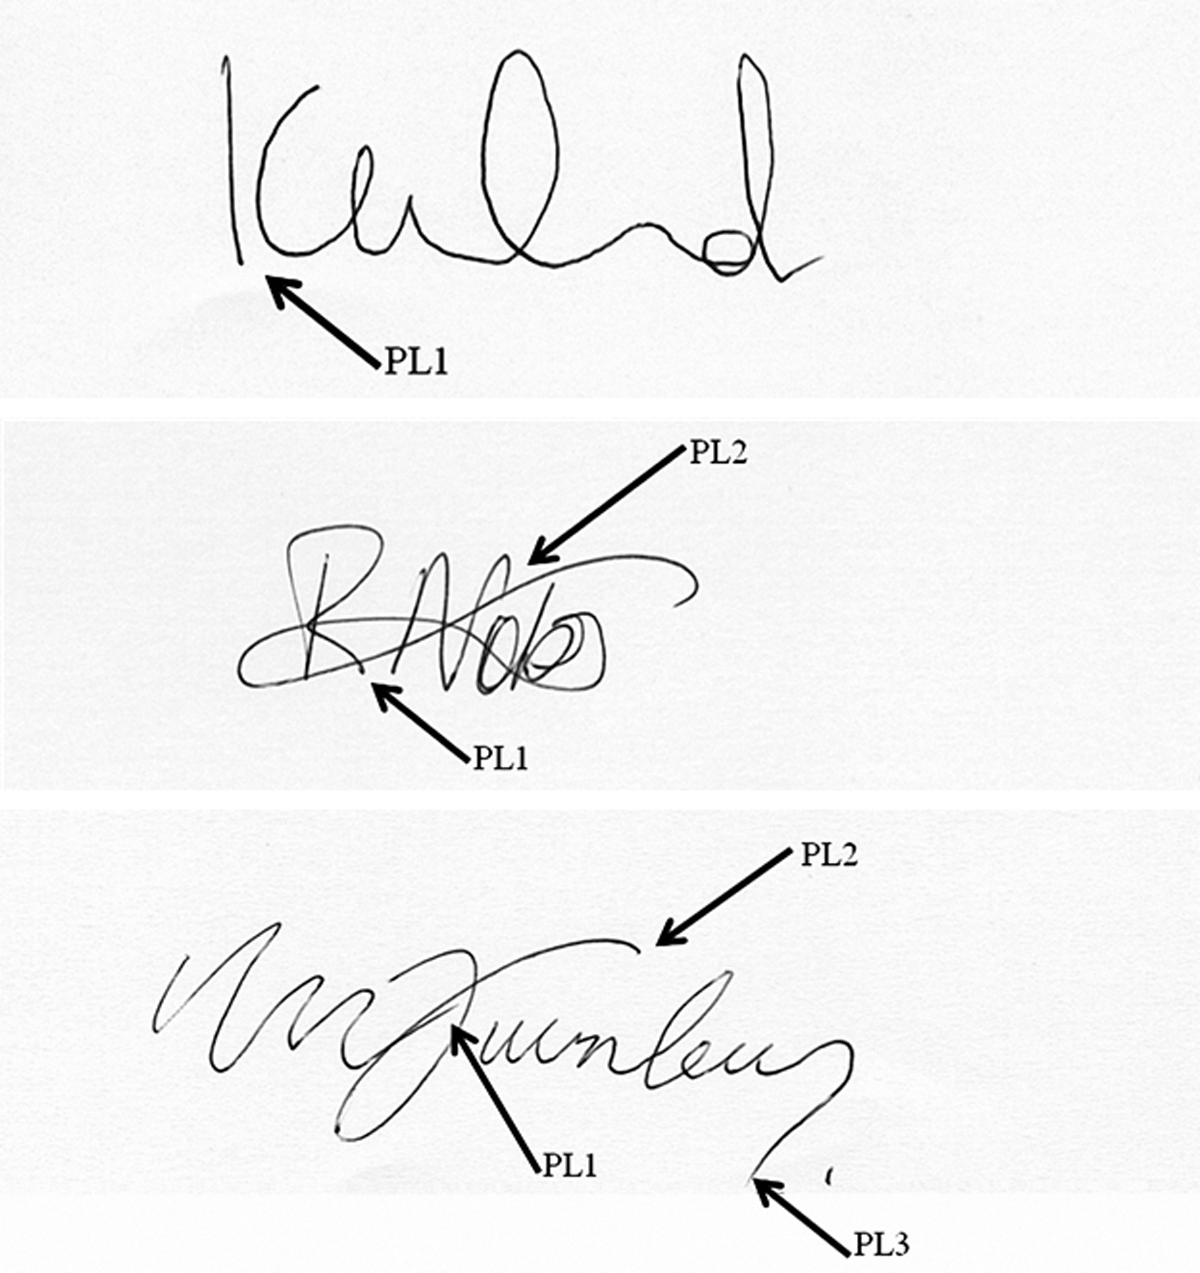
Figure 2.
Example of three simulated signatures containing one, two and three pen lifts respectively. Regions where pen lifts occur are notated as PL indicating ‘pen lift’, followed by a number indicating whether the lift is the first, second or third lift within the signature formation.
Table 1
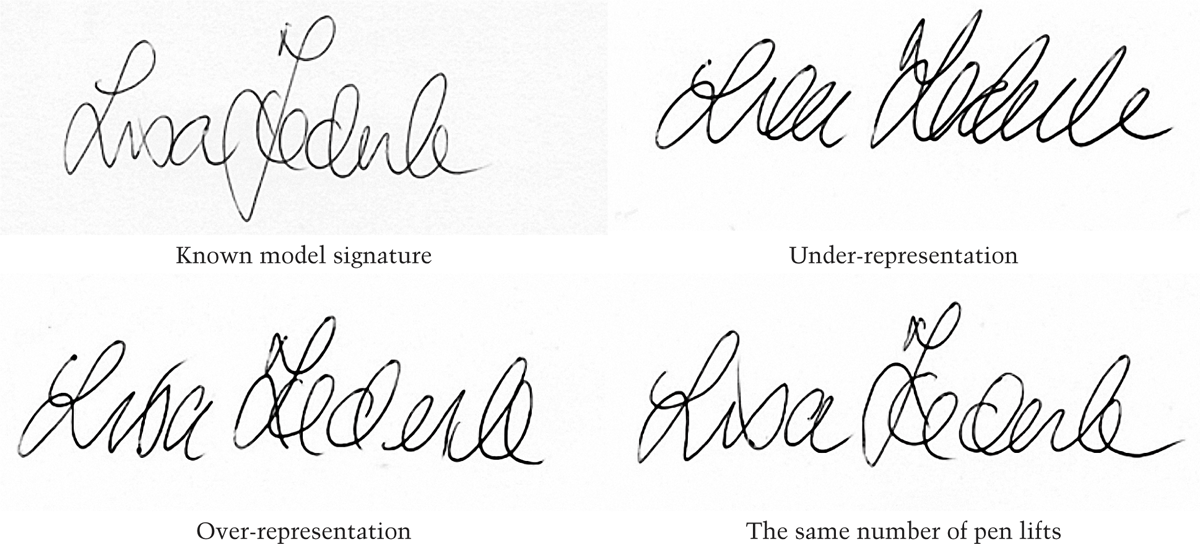
Number of simulated signatures that illustrated an over-representation, an underrepresentation or no difference in pen lifts, as compared to the known model signatures.
| Gross pen lift incidence in simulated signatures | Number of simulations |
| Over Representation | 506 |
| Under Representation | 264 |
| No Difference | 1510 |
| Total | 2280 |
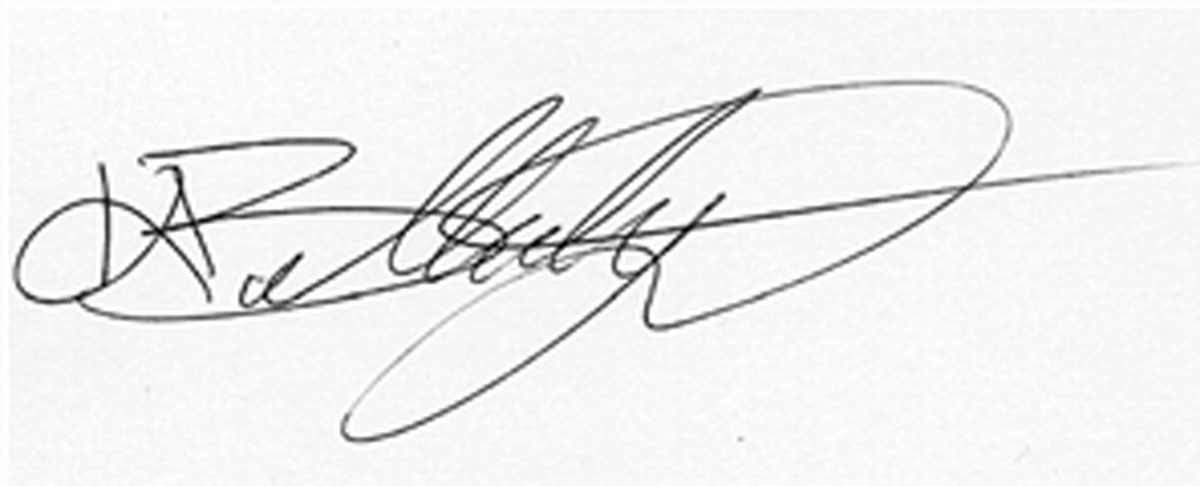
Figure 3.
A highly complex signature, exhibiting 4 pen lifts.
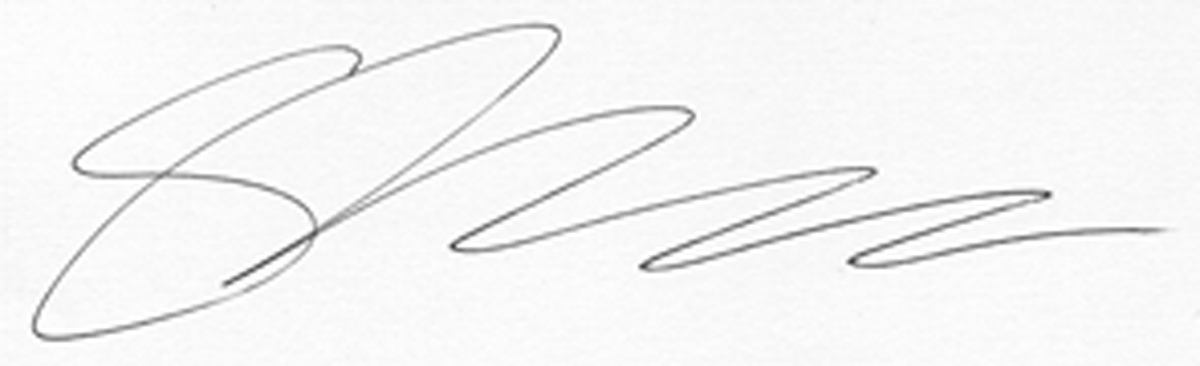
Figure 4.
A low complexity signature, exhibiting no pen lifts.
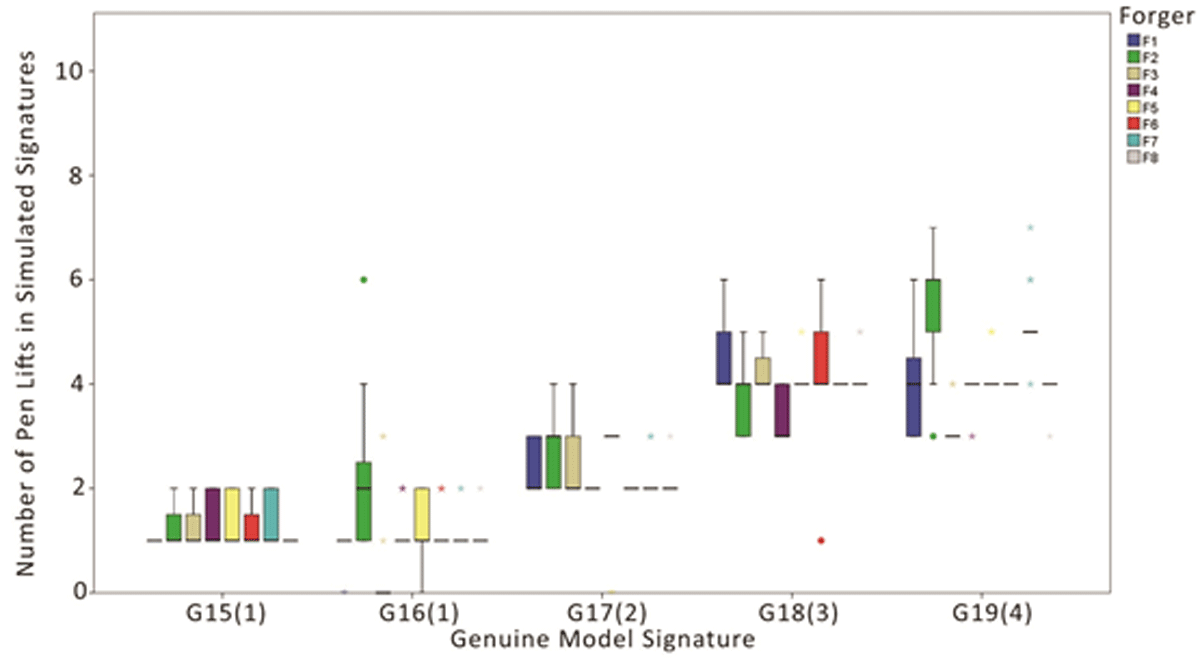
Figure 5.
High complexity signatures. Incidence of pen lifts in simulated signatures across the eight individual simulators for high complexity signatures. Bracketed Figures along the x axis indicate the number of pen lifts in the known model signature. Within the graph, solid lines indicate the median number of pen lifts recorded, boxes extending either side of the median illustrate the inter-quartile distribution (25–75% of data points) and whiskers defining maximum and minimum recorded pen lift. Circles illustrate suspected outliers, and asterisks indicate extreme outliers. The above graph illustrates that the majority of simulation attempts accurately replicated the number and placement of pen lift as observed in the high complexity model signatures.
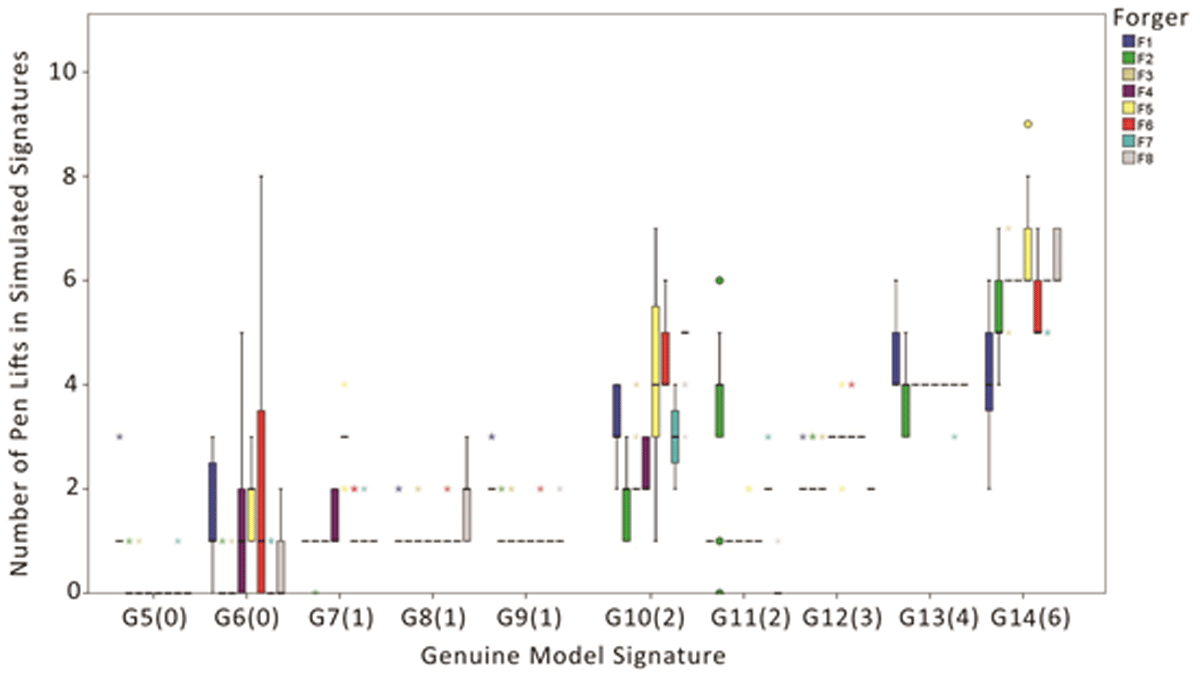
Figure 6.
Intermediate complexity signatures. Incidence of pen lifts in simulated signatures across the eight individual simulators for intermediate complexity signatures. Bracketed Figures along the x axis indicate the number of pen lifts in the known model signature. Within the graph, solid lines indicate the median number of pen lifts recorded, boxes extending either side of the median illustrate the inter-quartile distribution (25-75% of data points) with whiskers defining maximum and minimum recorded pen lift. Circles illustrate suspected outliers. Asterisks indicate extreme outliers. Whilst a larger degree of variation in pen lift is observed in the simulation attempts of these intermediate complexity signatures as compared to the low complexity simulation attempts depicted in Figure 7, the majority of pen lifts within simulation attempts by all forgers closely mimics that which is observed in the model signature formations. It remains undetermined as to why some forgers and some signature models illustrated larger degrees of variation amongst pen lift incidence.
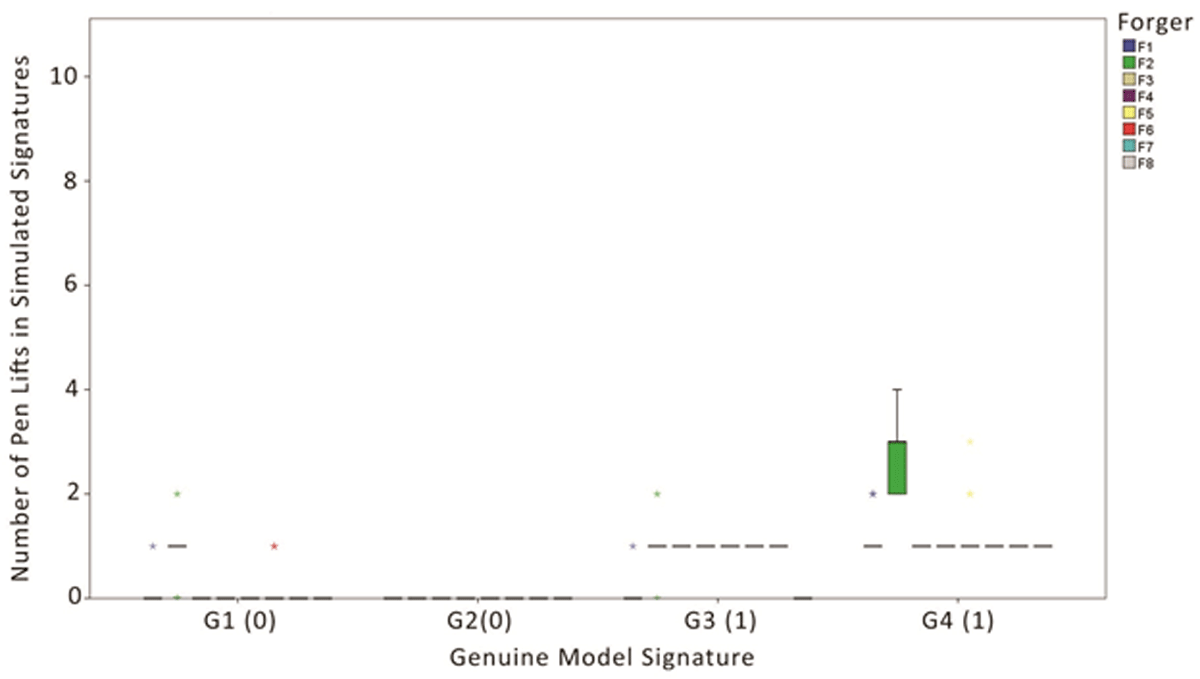
Figure 7.
Low complexity signature. Bracketed Figures along the x axis indicate the number of pen lifts in the known model signature. With low complexity signatures, the majority of simulations accurately replicated pen lift incidence as observed within the known model formations. Pen lift occurrence within this data set is relatively stable for this level of signature complexity, with little variation and few outliers. Only one individual (Forger 2) displayed pen lift variation as evidenced by the distribution range seen in this forger’s simulation attempts at this complexity level.
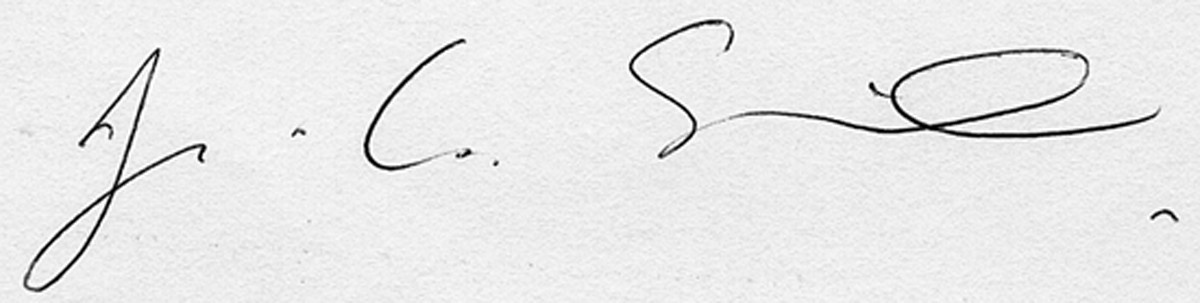
Figure 8.
A punctuated known model signature formation. Note the punctuation marks in the form of periods between the first and second letters, within the body of the signature and at the completion of the signature formation. Simulation attempts of this signature, collectively returned an under representation of pen lift across all simulators. The under representation took the form of punctuation omissions, therefore, reducing the number of pen lifts present in the simulation attempts.
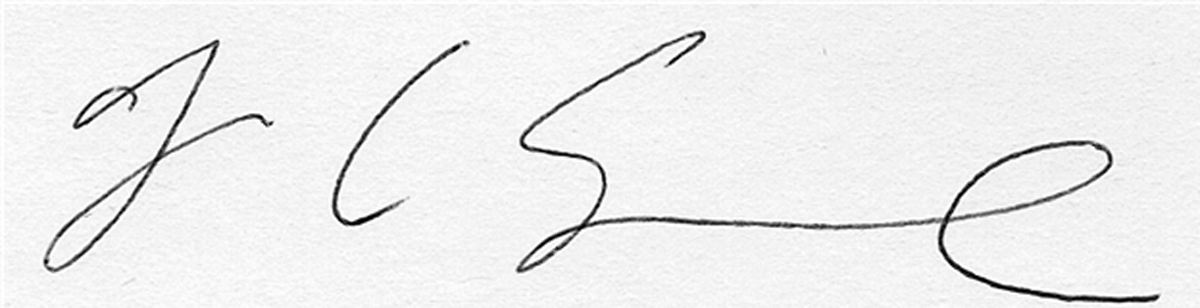
Figure 9.
A simulation attempt of the known signature formation provided in Figure 8. Note the lack of punctuation between letters, within the body of the signature and at the completion of the formation, as compared to the known model signature.
Table 2
Number of simulated signatures that illustrated an over-representation, or underrepresentation of pen lifts, extraneous to that occurring within the known model signatures.
| Extraneous pen lift incidence in simulated signatures | Number of simulations |
| Over Representation | 352 |
| Under Representation | 264 |
| Total | 616 |
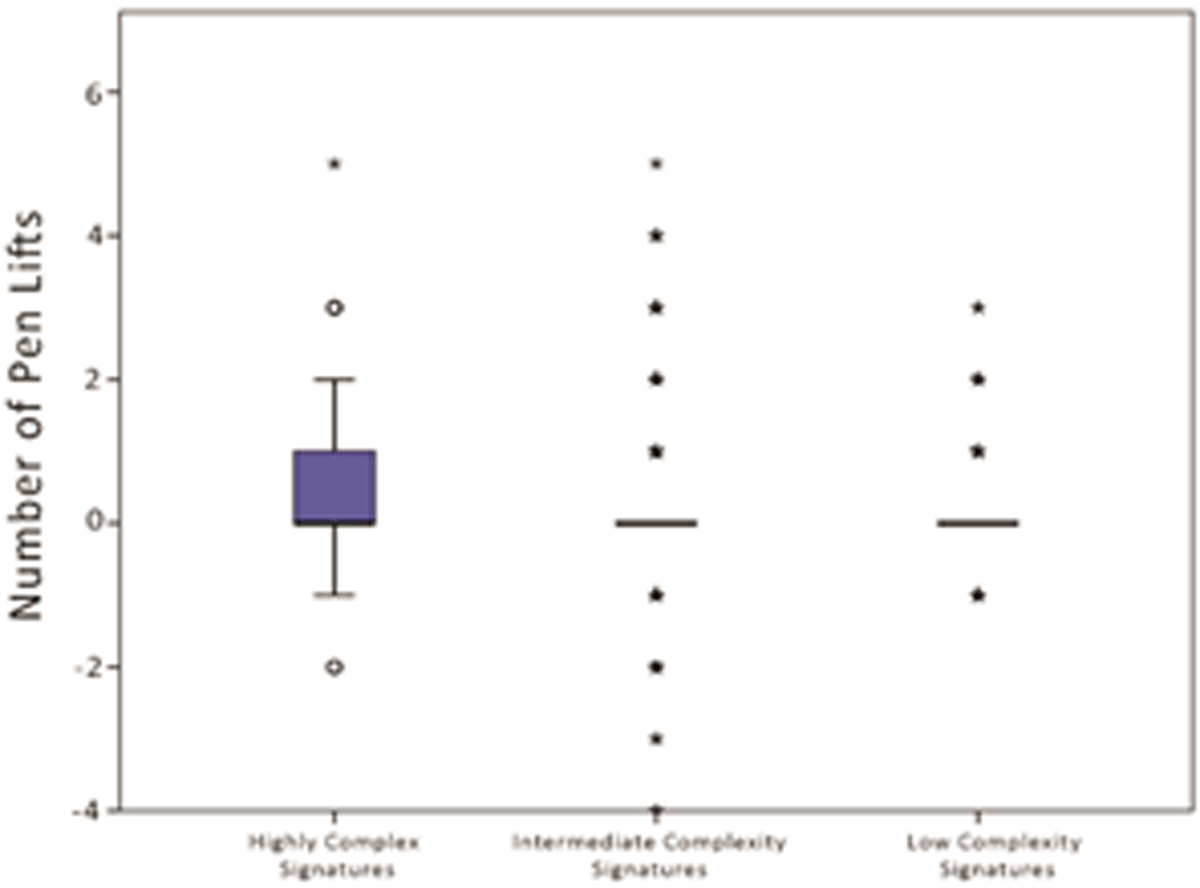
Figure 10.
Number of extraneous pen lifts in the simulated signatures according to complexity level rating of the known model signature. The graph illustrates more extraneous pen lifts in the simulations of the highly complex known signatures, however, there was no significant overall correlation between the complexity of the known model signatures and the median number of extraneous pen lifts in the simulated signatures (ρ = –0.065, p = 0.483). The solid lines represent the median number of pen lifts made by each simulator, with a coloured box covering the 25% and 75% percentiles. The whiskers (lines extending from the coloured box) represent the highest and lowest values observed, excluding the outliers (circles and asterisks).
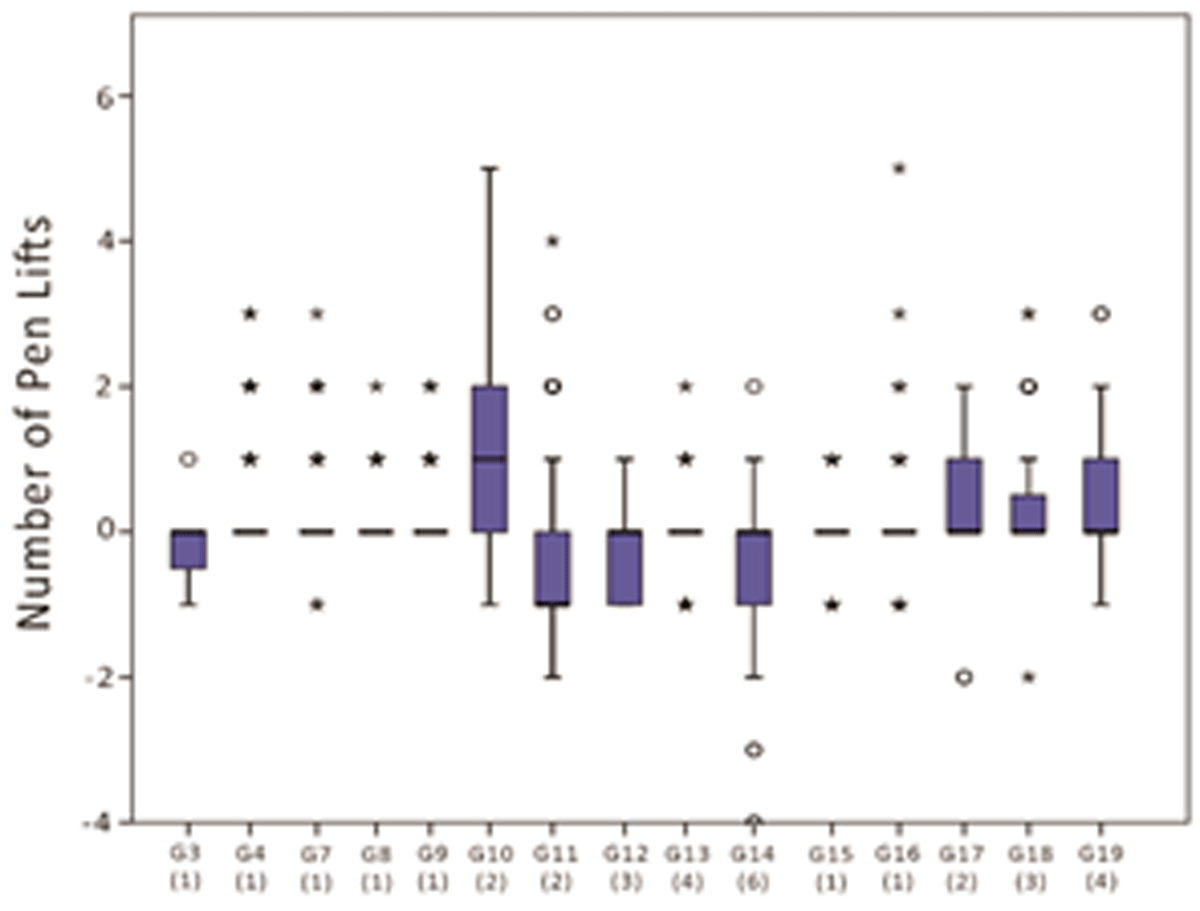
Figure 11.
Number of pen lifts across all eight simulators and all simulation attempts per known model signature. The number of pen lifts in the known model signature is noted in brackets beneath the x axis. The graph illustrates how some model signatures (G10, G17, G18, and G19) resulted in a collective over-representation of unexpected pen lifts across all simulators and simulation attempts, whilst other known model signatures (G3, G11, G12, and G14) elicited a significant under-representation of pen lifts in the simulation attempts, across all simulators. Note how the simulation attempts of the known model signature identified as G10 exhibits a significant over representation of pen lifts, in contrast to the under-representation observed in the simulation attempts of the model signature G14. Data points G1, G2, G5 and G6 are absent from the X axis in the above table as they represent the model signature formations that did not have any pen lifts and therefore could not exhibit an over or under representation in the simulation counterparts. The solid lines represent the median number of pen lifts made by each simulator, with coloured boxes covering the 25% and 75% percentiles. The whiskers (lines extending from the coloured boxes) represent the highest and lowest values observed, excluding the outliers (circles and asterisks), circles illustrate suspected outliers, asterisks indicate extreme outliers.
Figure 12.
Figure 13.
Figure 14.