
The case:
The research was motivated by a case where in 2010 a Judge turned to the author for a specialized technical consultancy, asking to solve – if possible – the following question:
“The dynamics of the formation of a document, regarding the order of application between the signature and the text in print.”
The problem, though, was the fact that the written line (black ballpoint pen ink) was completely isolated, i.e. without contact, with the printed text (monochrome toner solid ink). The author decided to deal with it from the following hypothesis:
Xerographic copiers and laser printers release micro particles of toner that vary in size and intensity throughout the background of the paper. The size and itensity of the background toner is a function of the type of toner, the wear of the mechanical printing equipment, among other factors.
As described in the scientific literature by Aginsky [13] the sequence of toner and ink pen could be determined when background toner particles could be identified.
However, the first major obstacle was the lack of contrast between the ink ballpoint pen and toner, as they were both black. By observing ink ballpoint pen with incident halogen lighting and a stereo microscope with optical body zoom 0.7x to 4.5x, it was impossible to distinguish the presence and exact location of the black toner residues in the inked signature. Furthermore the difficulty was also due to the small size (a few micrometers) of these toner particles.
The case presented was resolved by proving that the signature was affixed to a blank sheet and was later printed/copied upon with toner, the solution was determined as described below.
This paper describes a technique on how to perform this particular investigation.
Firstly it was necessary to operate at high magnification (up to 1000x), consequently a classic stereo microscope cannot be used because its magnification is normally an order of magnitude lower than that of a metallographic one.
For this reason, an optical microscope for metallurgic research was modified by the author from a mechanical point of view (to lighten the structure and facilitate the transport of the same for use even outside a laboratory) and to allow sample illumination by NIR (910nm) and UV (370nm) light beams.
One CMOS camera was adapted to allow image acquisition both in NIR and visible light using coaxial illumination. Subsequently, the author performed a wide series of experiments, using 52 different ballpoint pens (26 blue and 26 black), in addition to 18 different mechanical means of printing.
The results were very positive, and two practical examples are shown and discussed to prove the potential of the technique.
Introduction
The issue of recognition of the history of signatures / text can be essentially classified into two types: Intersecting and non-intersecting
Intersecting
This situation relates to intersections in which a signature and the text overlap each other at some points.
The problem is well known to the forensics community and the numerous articles that have been published in the international arena demonstrate it [1, 2, 3, 4]. Among these methods the author also proposed the first one, using 3D Laser Profilometry (LP) in 2003 [5].
The application concerns the analysis of the junctions between two pen strokes (of homogeneous type and simple heterogeneous [6]) using Conoscopic Holography [7]. This method also became the subject of research by Schirripa et al. [8].
The 3D LP technique was also used to examine the intersections of the complex heterogeneous type, such as: intersections between inks of pens for handwriting and fonts in print by laser printer and/or photocopy toners [9]. The peculiarity of the laser profilometry consists of detecting the surface mapping of the paper substrate, allowing the operator to observe in detail its deformation: grooves of the pen strokes and the thickness of the “crust” of the toner that is in relief, as in the case of toner-based graphic elements.
In Figure 1 we can see an intersection between a letter (S) made by a laser printer and two tracings performed in handwriting with ballpoint pens. The writing sequence is: first (black pen), second (toner) and third (blue pen). The image at low magnification was acquired using a handheld multispectral digital microscope [10].
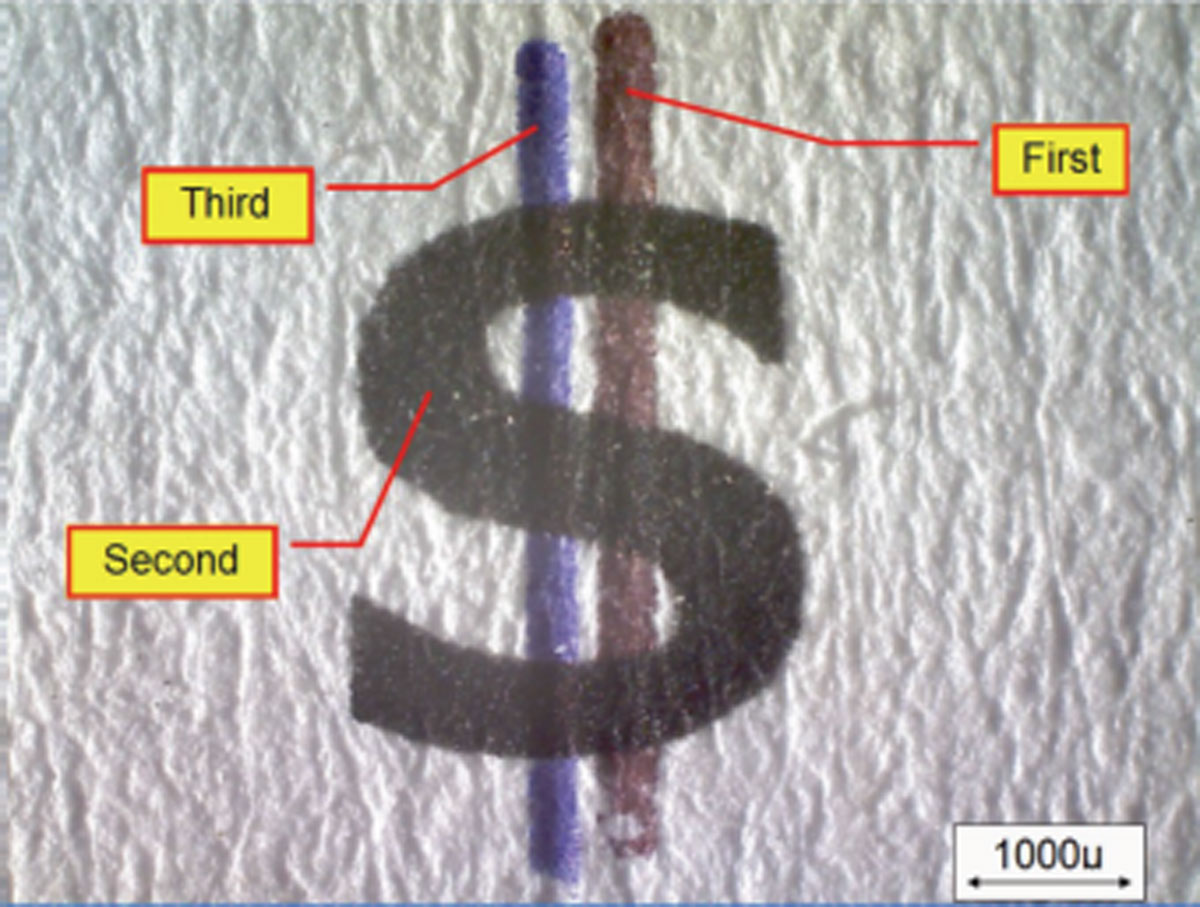
Figure 1
Printed text that intersects with two tracks in handwriting.
This example will also be used in the following pages to describe the technique being proposed. From the 3D isometric findings, the brown shadings (Figure 2), clearly show that the first track (black pen) at the points of intersection with the letter S has not compressed the toner’s crust that is slightly raised compared to the fibers of the paper, see the white area [11].
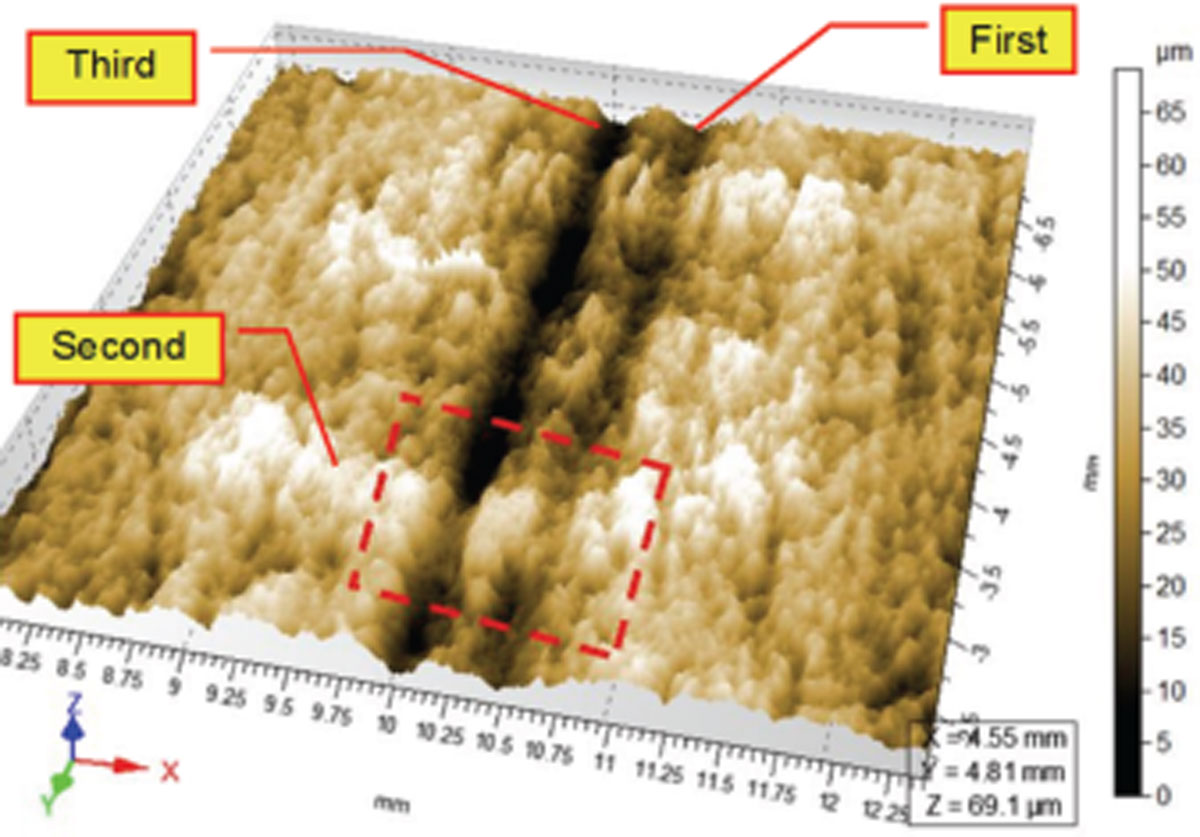
Figure 2
The same target of Figure 1, following the 3D scan. The axonometric representation in this slide is in brown shades.
On the contrary, the intersection between letter S and the blue pen trace (third) shows that this was applied last, see detail in Figure 3. Obviously, the technique can be successfully used in all cases in which the graphic elements have an indentation level that falls within the measurable values (from a metrological point of view) and therefore at a higher level than the roughness of the paper fibers. Considering the maximum definition obtainable by the instrument [12], the lateral resolution is 6 μm, while the vertical one is ½ μm.
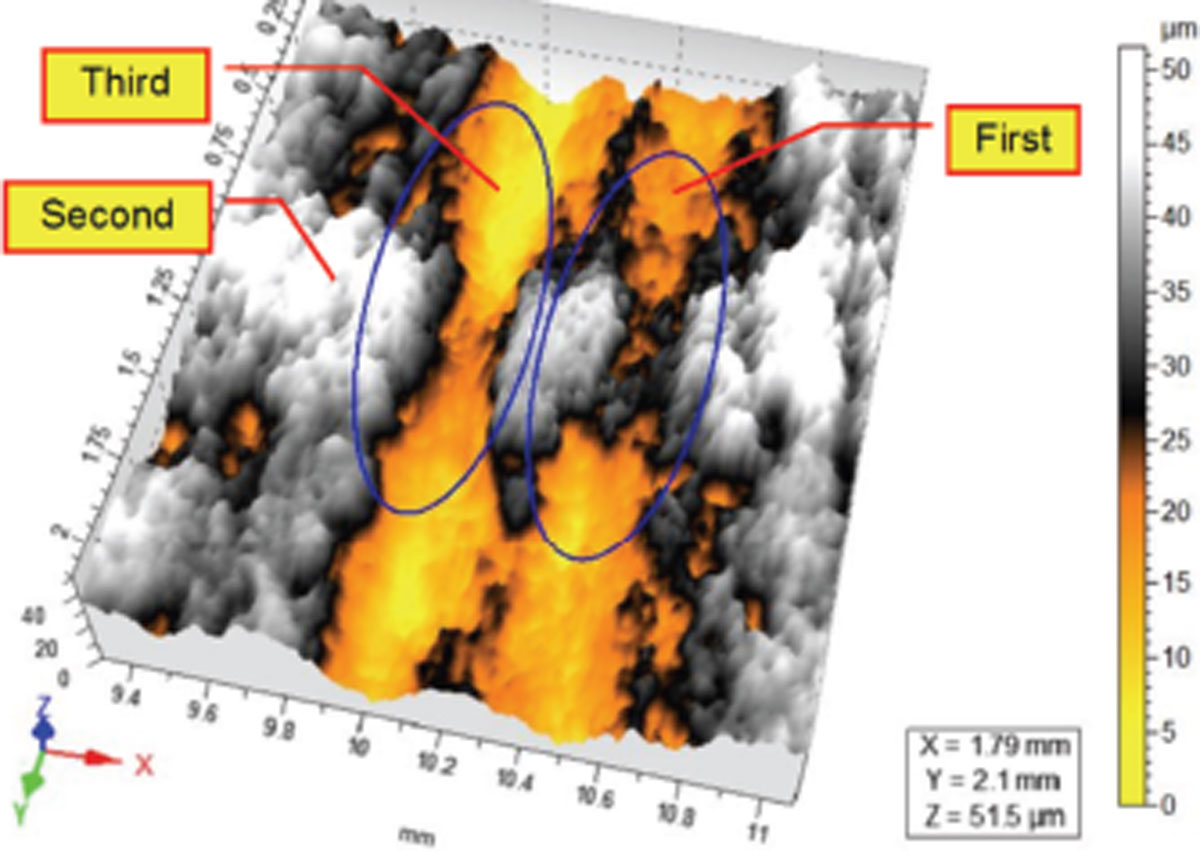
Figure 3
The 3D detail of the two intersections within the dashed red line, visible in Figure 2. Note: pseudo color levels are used to highlight better what happens in the intersection points.
Non—Intersecting
Without crossing between the handwritten and printed text.
This situation has also been addressed using various techniques in the last few years. Among these, the following contributions are considered by the author as the most interesting:
Aginsky V.N.: using a Carl Zeiss Neophot 3D reflected-light photomicroscope at magnifications between 125 to 500 times, for determining the sequence of non-intersecting media on documents: ballpoint pen ink and toner laser entries [13].
In this study. Aginsky used 10 ballpoint pens with different colors: black, purple, blue, red and green; and only one model of laser printer. The limitations of the technique did not include:
the minimum dimensions of the toner particles;
how to identify the toner particles compared to the inks in pen coating them and especially very dark ones (in the absence of NIR lighting and a sensor capable of operating in both the NIR and True Color).
On the contrary, Aginski describes the following interesting phenomenon:
If, during the laser printing process, a toner particle is deposited on a thick layer of ink, the particle sinks into the ink forming a “crater”. The toner particle appears to lie on the bottom of the “crater”.
Ezcurra Magdalena: Using a metallographic microscope with reflected light to see the differences between toner particles above and below the roller ball and gel ink pen entries [14].
The limitations of the technique did not include:
Minimum dimensions of the toner particles;
How to identify the toner particles compared to the inks in pen coating them and especially very dark ones (in the absence of NIR lighting and a sensor capable of operating in both the NIR and True Color).
On the contrary, Ezcurra describes the following interesting phenomenon:
The particles that were above the ink stroke had a different shape: they were more circular, their black colour was more concentrated, and, above all, they had a special brightness which the particles below the stroke did not have. These usually have a different shape, and the black color was all around the particle, not inside it. It was as if when the roller ink settled on the toner particle, thereby losing its proper brightness. To see these differences better, have also used digital image processing (Adobe Photoshop software)
Redjah H., Mazzella W., Margot P.: used a optical microscope at magnifications between 100 to 500 times, for determining the chronological sequence between the electrophotographic printing (laser printers and photocopiers) and traits of ballpoint pens without crossing [15].
In contrast to the Magdalena research, the experiments of the authors describes the test only between: particles of toner and ink ballpoint pens.
Furthermore, the authors claim to have achieved a success rate of 100%, further validating the results reported by Aginsky. The limitations of the technique did not include minimum dimensions of the toner particles and how to identify the toner particles compared to the inks in the pen coating them and especially very dark ones.
The NIR lighting (in support for determining the sequence of non-intersecting media on documents) and analysis instrument
The technique used by the author, based on optical microscopy, proposes the following novel approaches:
use an appropriate NIR lighting system (in transmission) and UV (in semi grazing light), in order to facilitate the operator’s objectivity regarding the presence and the exact spatial location of the toner micro residues (toner not part of the printed image) along a path in handwriting (regardless of the type and the chromaticity of the ink of the ballpoint pens used to write the handwriting);
modify a digital color camera to enable it to operate in the spectrum of NIR, visible and UV.
Figure 4 shows an example of an optical microscopy image of the sample using normal coaxial illumination. The detection of the toner micro particles and their relative spatial location is difficult if not impossible. There is risk of confusion between the appearance of a toner particle with that of a dark ink pen point. As we will see below, the use of NIR illumination improves detection.
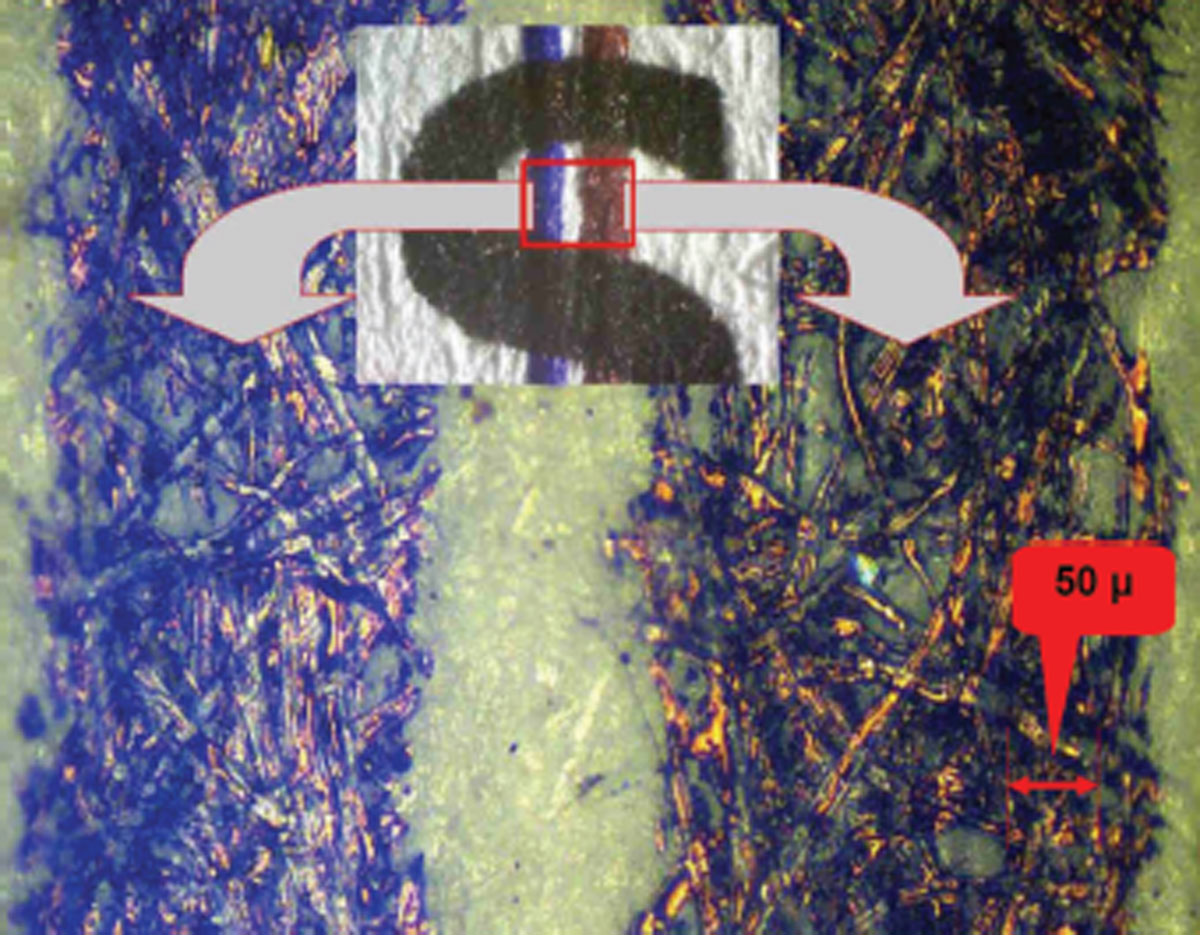
Figure 4
Detail of a portion of the two ballpoint pens: in blue and black, of Figure 1.
The technique consists in detecting the microparticles present along the track in handwriting to determine if they were deposited on the paper surface before or after the ink pen, see Figure 5:
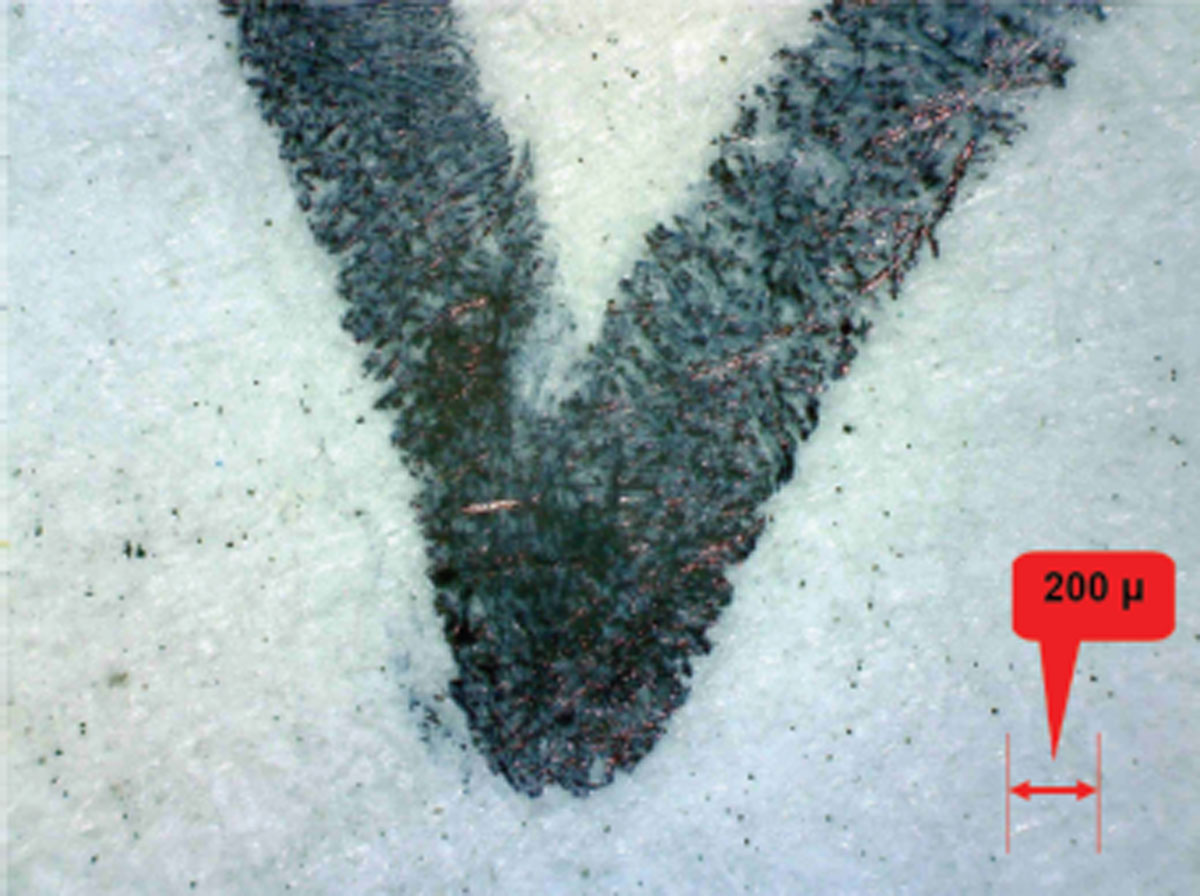
Figure 5
Detail of a black ink, using a ballpoint pen (Bic, standard model pen).
The image of Figure 5 was acquired using a handheld multispectral digital microscope [10] at its maximum magnification.
In the image of Figure 6: the same target of Figure 5, using diffused light (NIR spectrum, with emission peak at 775 nm). Thanks to radiation in the NIR, pen ink disappears and it is possible to clearly see some micro toner particles in the image.
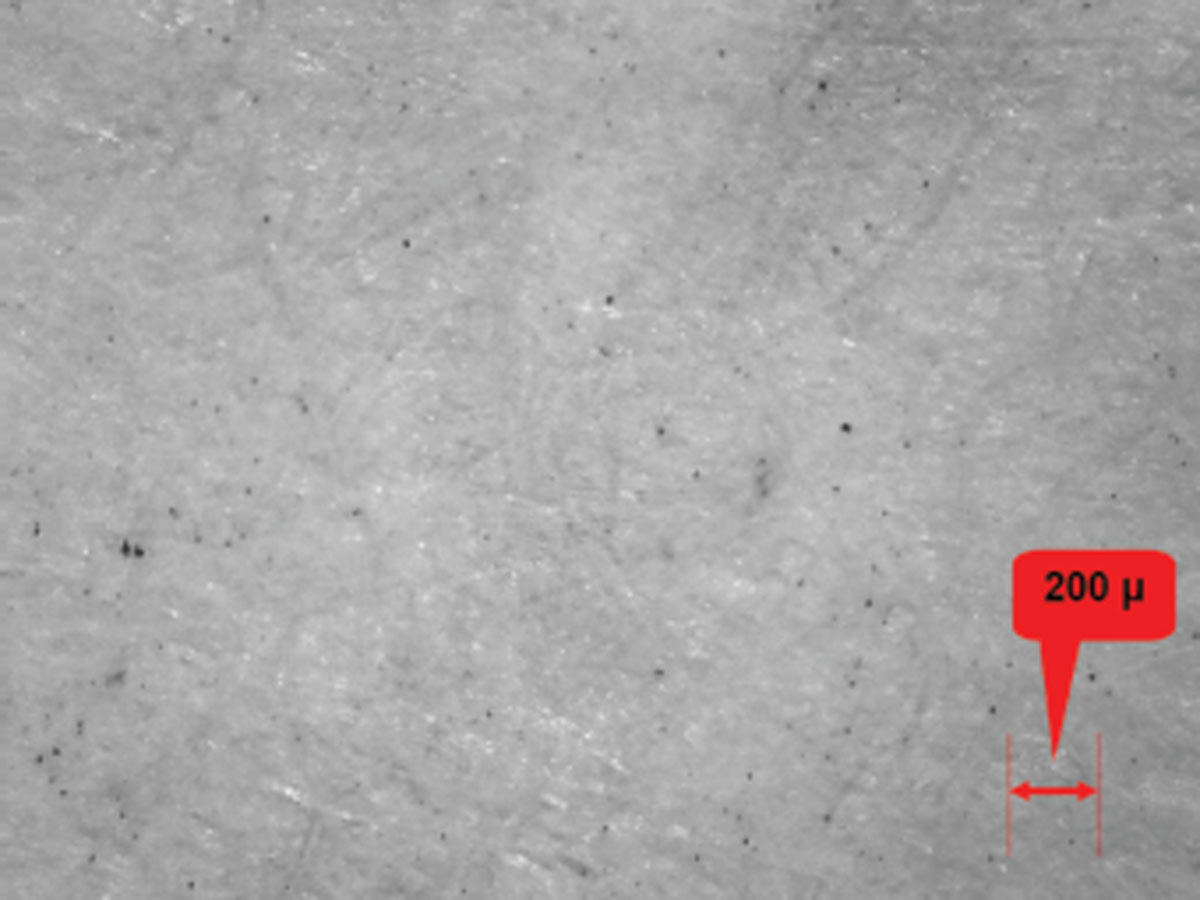
Figure 6
The same image of Figure 5 where toner particles released during printing are clearly visible.
The image of Figure 7 obtained using with double lighting source: diffused light (NIR spectrum, with emission peak at 775 nm) and in addition UV source in semi grazing light (with an angle of about 30 degrees) with emission peak at 370nm.
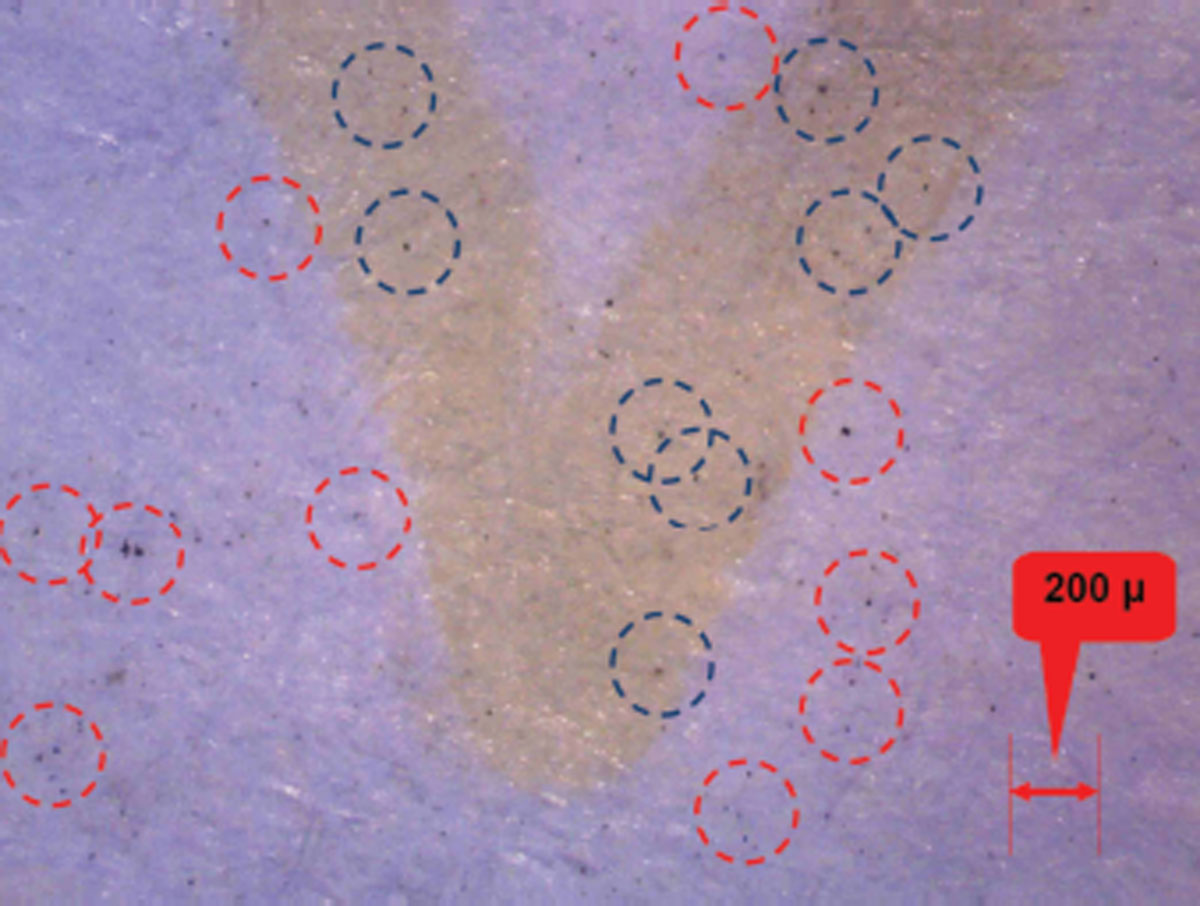
Figure 7
The same image of Figure 6 obtained using NIR and UV lighting source together (visible particles on grooves are marked with blue circles).
As one can also see micro particles along the ink of handwriting: outside the handwriting they are marked with red circles and inside the handwriting they are marked with blue circles.
The use of a multispectral microscope at low magnification is very useful to facilitate and speed up the initial search of the toner particles, along the “route” of the ballpoint pen.
Methods
To perform the tests, the author used 52 ballpoint pens (26 blue and 26 black), as indicated in Table 1 and some printing instruments as indicated in Table 2.
Table 1
The make and model of the 52 pens used to perform the test.
| PEN NUMBER | MAKE | MODEL | BLACK | BLUE |
|---|---|---|---|---|
| 1 | STAEDTLER | Noris Stick 434 M | + | |
| 2 | BIC | Atlantis | ++ | |
| 3 | BIC | + | ||
| 4 | PENTEL | E-ball-BK 130 1.0 med | ++ | |
| 5 | PAPER MATE | FLEXGRIP ultra MED | + | |
| 6 | STABILO | ++ | ||
| 7 | PARKER | + | ||
| 8 | STAEDTLER | Germany | ++ | |
| 9 | tratto | 1 | + | |
| 10 | PARKER | ++ | ||
| 11 | BIC | SOFT Feel Eliminator | + | |
| 12 | STAEDTLER | Stick 430 M Gr Britain | ++ | |
| 13 | PAPER MATE | Comfort_Mate_MED | + | |
| 14 | PILOT | REXGRIP M | ++ | |
| 15 | PILOT | BP-S MATIC fine | + | |
| 16 | BRIO PEN | ++ | ||
| 17 | fibracolor | HI_TEXT 660 1mm | + | |
| 18 | BIC | MEDIUM | ++ | |
| 19 | tratto | MATIC | + | |
| 20 | PILOT | BP-S MATIC fine | ++ | |
| 21 | PILOT | SUPER GRIP (F) | + | |
| 22 | PILOT | BPS_GP (B) | ++ | |
| 23 | fibracolor | HI-TEXT MATIC 900 1 mm | + | |
| 24 | PAPER MATE | Click 2020 M | ++ | |
| 25 | BIC | + | ||
| 26 | PAPER MATE | FLEXGRIP ultra MED | ++ | |
| 27 | Pentel | BK 77 SUPERB | + | |
| 28 | BIC | ++ | ||
| 29 | PILOT | BP.S FINE | + | |
| 30 | BIC | SOFT Feel Med | ++ | |
| 31 | PAPER MATE | Click 2020 M | + | |
| 32 | STAEDTLER | Noris Stick 434 F | ++ | |
| 33 | LAMY | M21 | + | |
| 34 | Corvina | “91”UNIVERSAL | ++ | |
| 35 | PILOT | BPS-GP(B) | + | |
| 36 | Pentel | BK 77 SUPERB | ++ | |
| 37 | SHEAFFER | SWEDEN | + | |
| 38 | PAPER MATE | M 80 % | ++ | |
| 39 | PAPER MATE | + | ||
| 40 | PAPER MATE | Eraser.max med | ++ | |
| 41 | LUS | HF500-ITALY | + | |
| 42 | WATERMAN | ++ | ||
| 43 | INOXCROM | SPAIN | + | |
| 44 | STAEDTLER | Triplus ball M | ++ | |
| 45 | PENTEL | BK 77 SUPERB | + | |
| 46 | PARKER | SONET | ++ | |
| 47 | PAPER MATE | M 80 % | + | |
| 48 | LUS | HF500-ITALY | ++ | |
| 49 | NIPPEN | Sunny stick | + | |
| 50 | NIPPEN | Sunny stick | ++ | |
| 51 | PILOT | REXGRIP F | + | |
| 52 | PILOT | BP.S FINE | ++ |
[i] Note: of 52 inks used for the test, only two disappear partially under NIR illumination. These two inks are number 11 (Bic Soft Feel Eliminator) and number 37 (Sheaffer Sweden).
Although difficult, it is still possible to detect the toner particles even for the two inks described above.
Table 2
The make and model of mechanical printing used to perform the test.
| LASER PRINTERS | |||
|---|---|---|---|
| Brand | Model | B/White | Color |
| BROTHER | 5350DN | + | |
| EPSON | AL-M 400 | + | |
| HP | Laser Jet 1320 | + | |
| HP | Color laser Jet 1600 | + | |
| HP | Laser Jet 4000 N | + | |
| KYOCERA | FS 1300 D | + | |
| LEXMARK | X 66654 DE | + | |
| OKI | Serie C 5000 | + | |
| RICOH | MP 2550 | + | |
| SAMSUNG | CLP 510 W | ++ | |
| XEROX | Phaser 6110 | + | |
| MULTIFUNCTION PRINTERS (Toner based) | |||
| Brand | Model | B/White | Color |
| BROTHER L | MFC 9180 | + | |
| CANON–Sensys | MF 65 50 | + | |
| SAMSUNG | 6555 N | + | |
| SAMSUNG | 8385 DN | ++ | |
| SAMSUNG L | CLX 3175 | ++ | |
| PHOTOCOPIERS (Toner based) | |||
| Brand | Model | B/White | Color |
| INFOTEC | 54181 MF | + | |
| RICOH | Aficio 1022 | + | |
Only the colors blue and black were intentionally selected because they are the ones normally used to sign a document.
In Table 2 are indicated all the mechanical means used to make printing tests. For each of these mechanical means, different print (and / or photocopy) modes were generated: low resolution and hi resolution.
Sample Sheet
To perform the test, several sheets of white paper UNI A4 format 80g/m2 were used. Each sheet was divided into two types, respectively called: Sheet of type A (the upper part) and Sheet of type B (the lower part).
Sheet of type A
On the sheet of type A, on the upper part, 26 parallel lines were drawn from top to bottom, equally spaced one from the other. For each line a different pen was used. The same operation was performed on the lower part of the sheet by adding 26 lines with the remaining pens, up to a total of 52 lines per sheet. Each type of pen was assigned a number (1 to 52), and the numbering was reported on each sheet of type A.
Sheet of type B
On the sheet of type B, both at the top and bottom, several alphanumeric characters were made by each of the mechanical means shown in Table 2.
On all printed sheets, using the pens, 52 rows were subsequently made in the same sequence, numbering and pen type referred to on sheet of type A.
Finally, for each mechanical means of printing, as many sheets of type A were prepared. This way the two desired conditions were obtained:
52 tracks with ball pen above the toner and the same 52 tracks with ball pen under the toner. Thanks to this approach it was possible to observe - for each type of mechanical printing - the behavior of the toner, when it was above or below the 52 tracks of the ballpoint pen in the points of intersection with the alphanumeric characters in print (and / or photocopying).
Subsequently, only individual particles of toner were analyzed along the 52 tracks of the ballpoint pen in areas where the same did not intersect with the alphanumeric characters in print.
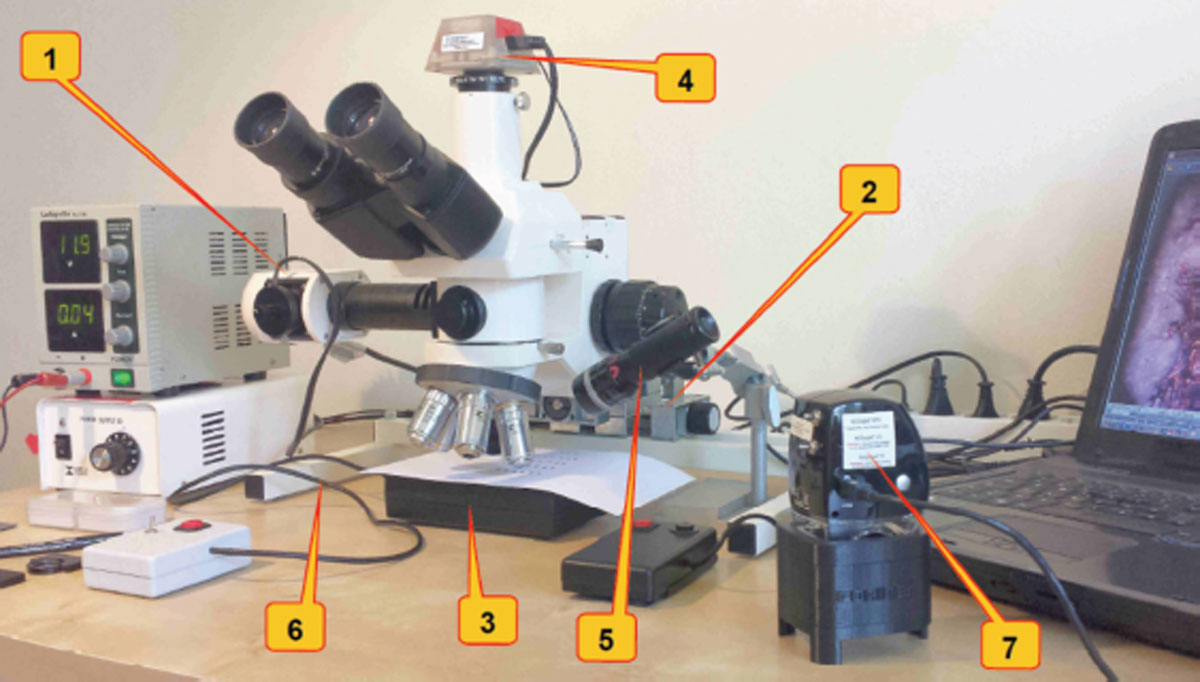
Figure 8
The reseach microscope used to perform the instrumental analysis: 1) coaxial illumination; 2) X-Y table to move the microscope, with a resolution of 10 μm/axis; 3) NIR power source; 4) prototype of Digital Camera “Star Gate”; 5) Flash light for UV; 6) aluminum structure to greatly lighten the instrument in its entirety; 7) Pocket digital multispectral microscope.
Specifications of the microscope used to perform the instrumental analysis
The author used a metallographic microscope because it was more suitable for the purpose, less cumbersome and more easily customizable, compared with a biological microscope. In fact even a biological microscope (with coaxial illumination) could possibily used for the purpose. However, it must be taken into consideration that:
The standard transmission lighting system, works in the visible spectrum and not in the NIR;
The cameras on the market (in the overwhelming majority of cases) are monochrome or in color. It is therefore not possible to arm and disarm the NIR cut filter from the camera sensor.
The stand is replaced with a simple structure in aluminum, realized allowing movement to which is added a cross-slide hand (for moving the microscope on the two X and Y axis) for a run of a few millimeters for each axis. This way the overall weight of the instrument was reduced by more than about ten pounds, making it easy to carry directly to a court house or elsewhere.
The optical microscope for metallographic applications was designed and manufactured in Japan by Meiji Techno and it is composed of the following items:
Trinocular head with a connector for camera with 0.5x optical wide-field Meiji Techno compact.
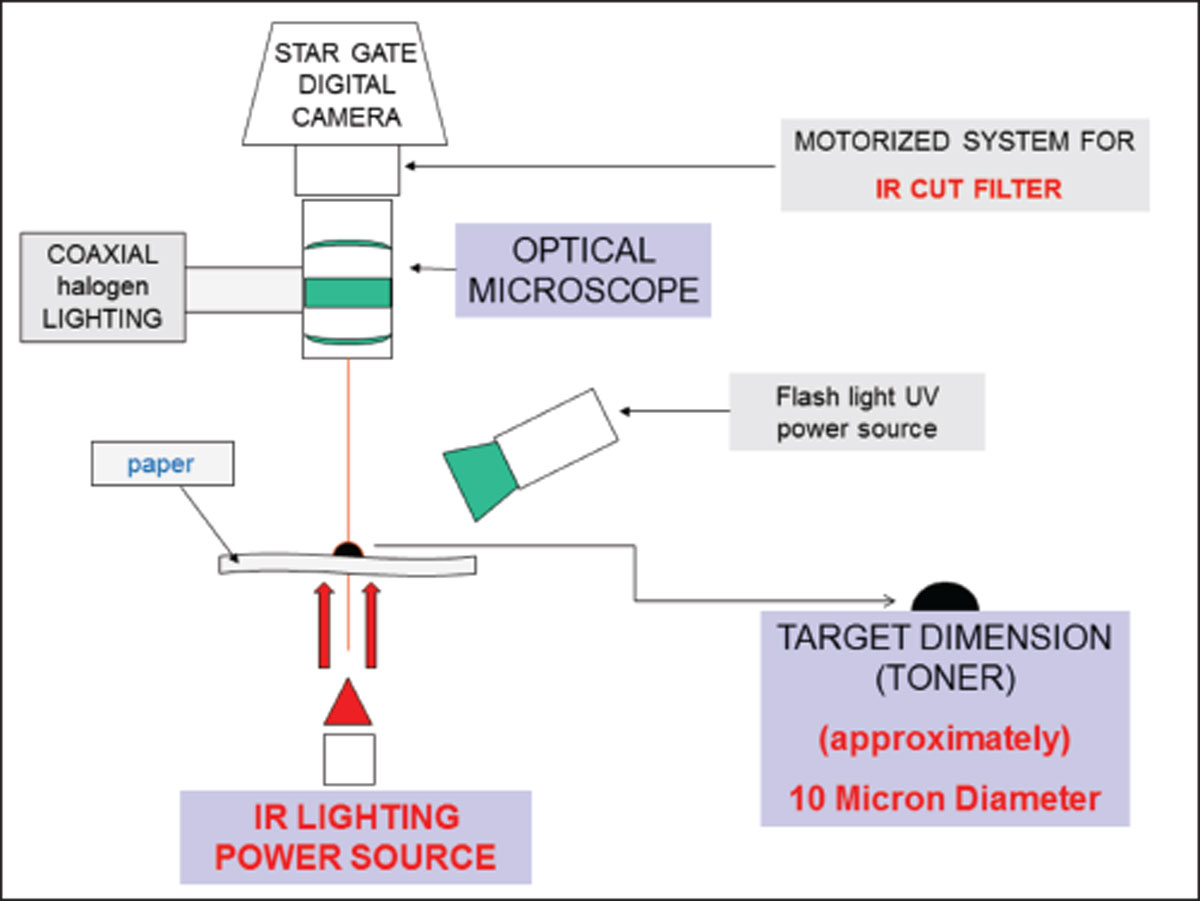
Figure 9
Basic diagram of the system for recovery through the camera called Star Gate.
Two wide-field eyepieces SWH 10x/22. Intermediate epi for bright field complete with door halogen lamp, diaphragm openings and fields, slits for the insertion of the contrast filters or polarization and electronic adjustment of the light intensity. Focus micro moving value: 0.001mm. Nosepiece revolver and four goals ICOS achromatic focal length, series:
Plane Epi lens 10X, Numerical Aperature (NA) 0.25, infinity connected, Working Distance (W.D.) 7.48mm
Plane Epi lens 20X, NA 0.40, infinity connected, W.D. 5.20mm
Plane Epi lens 50X, NA 0.75, infinity connected, W.D. 0.38mm
Plane Epi lens 100X, NA 0.75, infinity connected, W.D. 0.28mm
Digital Camera (called Star Gate) Specifications:
Digital Color Camera IDS (Germany) model UI-1240LE-C-HQ, USB II, ½ inch CMOS sensor with proprietary technology E2V. Resolution: 1280 x 1024 pixels.
The camera has been suitably modified by the author (and subsequently called Star Gate Camera) to allow you to use it either:
In the visible and UV spectrum (370nm)
In the NIR spectrum (up to 1100nm)
The mode for shooting in infrared/true color is by means of a micro mechanical motorized switch. The author had to build a new housing to internally accommodate the switch and the electronics of the camera sensor.
The micro mechanical motorized switch moves two filters: neutral and IR Cut (with a bandwidth transmittance of 350 – 650nm).
The software module makes it possible to elaborate twenty parameters that govern the sensor, in order to obtain high contrast images, if necessary, etc.
To complete the apparatus: a NIR source (LED from 1 Watt with a peak emission of 910nm), positioned under the supporting base of the document to be analyzed. Finally, a flashlight modified by the author by inserting: a UV Power LED 3 Watt, with 370nm peak emission and a condenser lens for focusing the light beam. The flashlight was installed on a small pivoting structure, for directing the light beam at an angle of about 30° on the paper.
The UV flashlight can only be used with lenses from 10x and 20x, because the microscope working distance at 50x and 100x almost brings the flashlight in contact with the paper. Consequently at 50x and 100x, the UV light source, even if positioned to maximize the grazing light in relation to the substrate is unable to illuminate the ink for analysis.
The method of analysis
To describe the method, the visible dollar sign in Figure 1 was used. The test was performed as follows: firstly, the trace in the black ballpoint pen (on the right), then the character of the letter S (by laser printer) and finally the track with blue ball pen (left-hand). From an instrumental point of view, it can be shown that the order of affixing of the three graphic elements is the one described above through the use of various techniques. Now let us suppose that the letter “S” is not in contact with the two written lines. It is still possible to demonstrate the temporal sequence of the application of the letter S (that simulates the print text in a document) being examined compared to the two tracks in black and blue (which can simulate for example, two signatures). The test relative to the dollar sign serves this purpose.
First operation:
First of all we observe at low magnification the inks of the two ballpoint pens to detect the presence or absence of background toner.
Our target is represented by the ink of the two ballpoints pens (blue and black) in Figure 10, using: halogen coaxial illumination lighting, 10x lens and the motorized micro mechanical switch (assembled inside the camera Star Gate) positioned on the IR Cut filter (with bandwidth cutting 650nm).
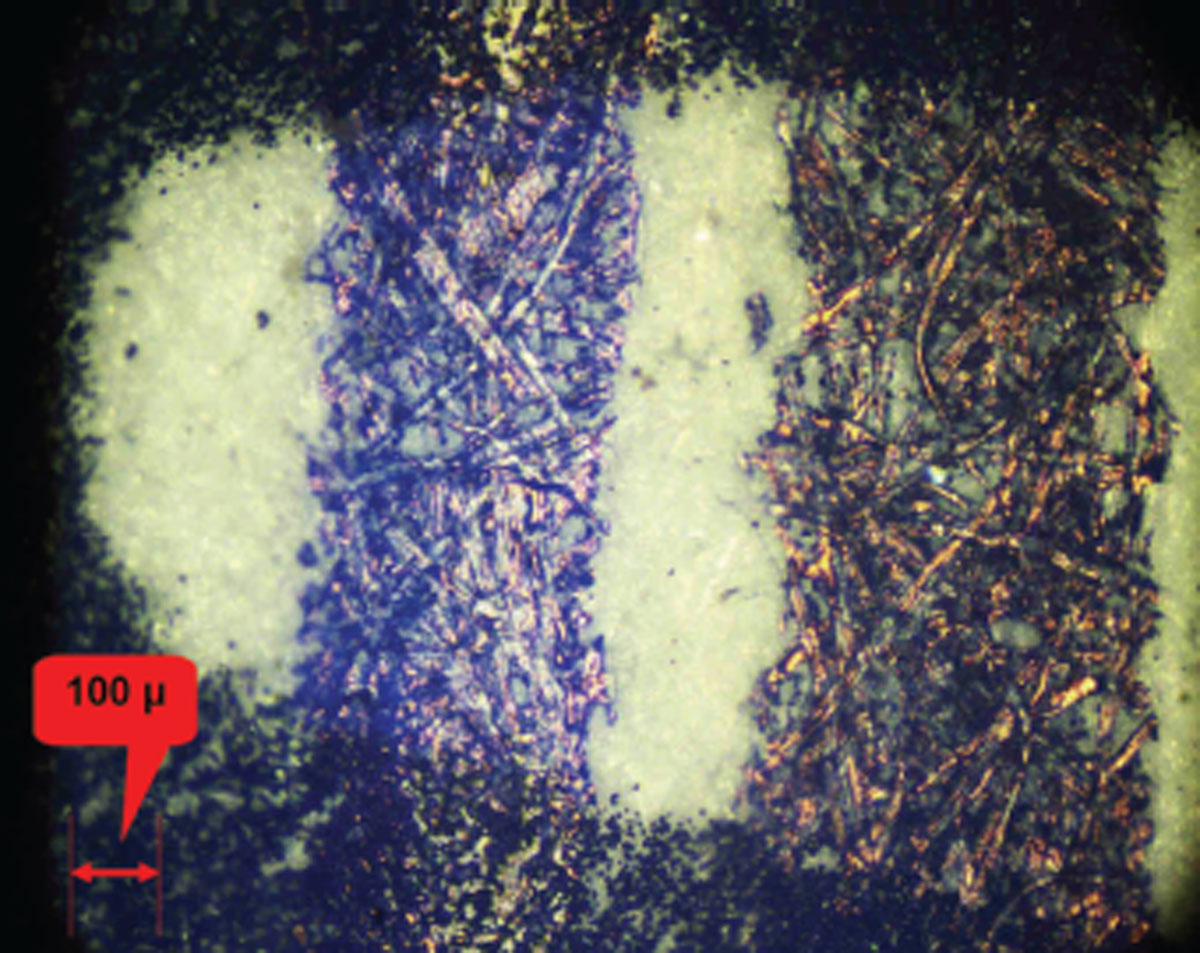
Figure 10
The target in the visible spectrum.
Second operation:
The target in Figure 10, taken in NIR transmitted mode.
In Figure 11 the target taken in the NIR transmitted mode with a peak emission of 910nm, using 10x lens and the motorized micro mechanical switch positioned on the neutral filter. The ink handwriting (of both ballpoint pens) disappear and several micro toner residues can be seen. This is done by illuminating the paper with NIR radiation.
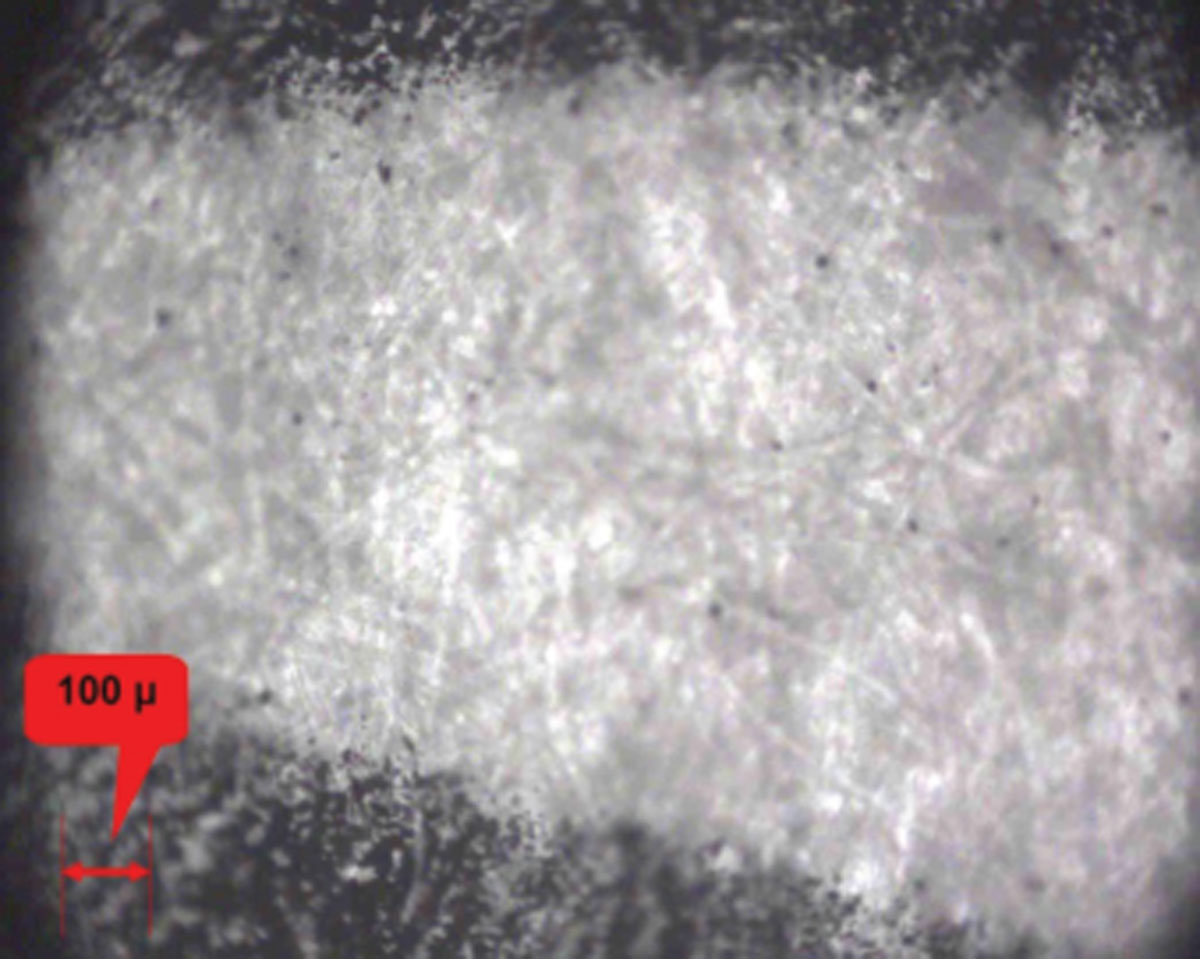
Figure 11
The target taken in NIR transmitted mode.
Third operation:
The target in Figure 11, taken in NIR transmitted mode and UV source in grazing light simultaneously.
In Figure 12 with the 10x lens, thanks to the double lighting (NIR transmitted mode with a peak emission of 910nm and UV with 370nm peak emission in grazing light) it is now possible to easily locate the micro residues along the two furrows released from the pens. The arrow indicates the particle (the larger one) which has been considered to perform the analysis of the overlap, between the same and the blue color ink of the pen (see in the left of the letter S of the dollar symbol).
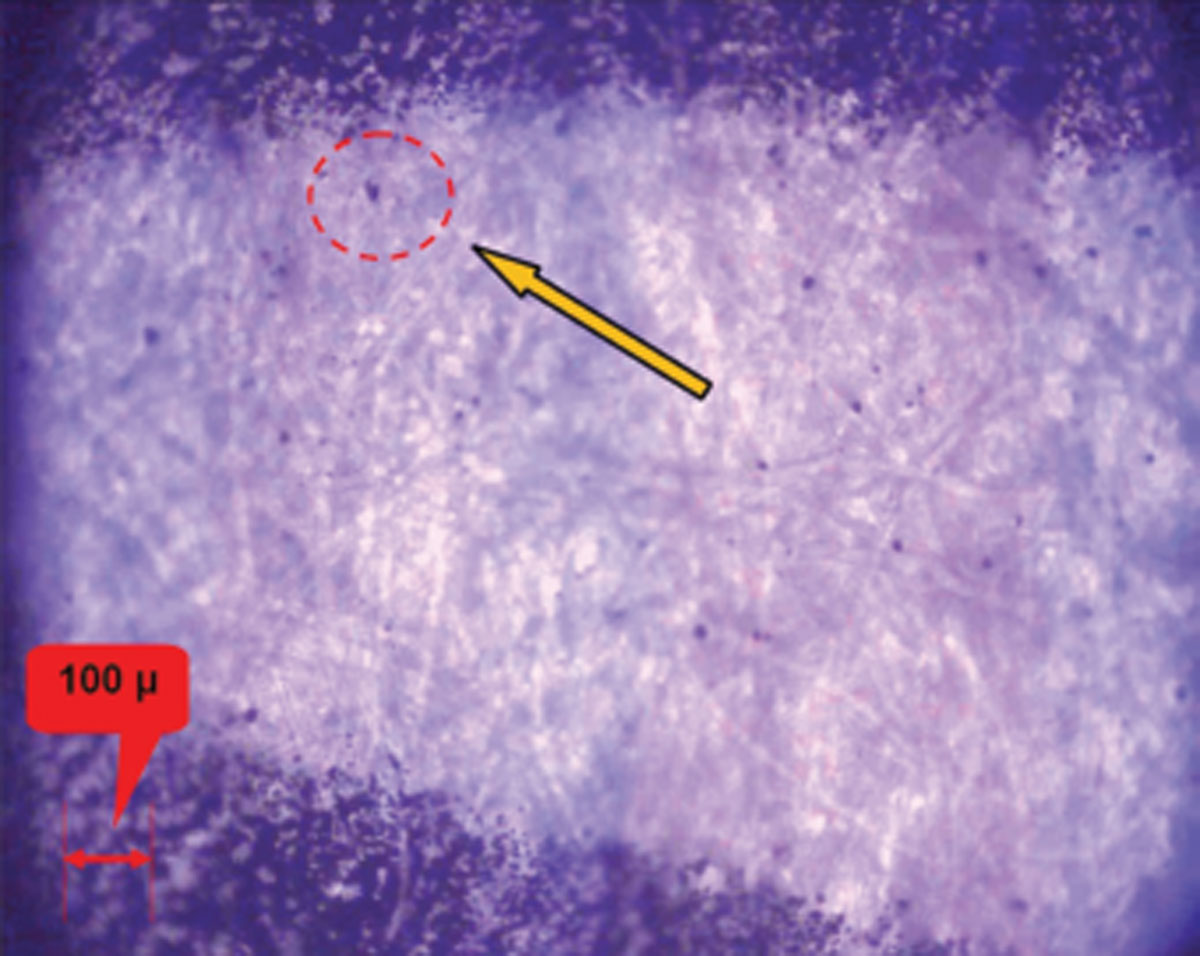
Figure 12
The target taken in NIR and UV in grazing mode simultaneously. A toner particle (red circle) present along the left path of the manuscript is the one that will be considered for analysis of the overlap.
Fourth operation:
The observation of the selected toner particle, at high magnification taken in NIR transmitted mode.
In Figure 13: the same toner particle indicated by the arrow in Figure 12, using only NIR lighting in transmission (with a peak emission of 910nm using a 50x lens. Thanks to the high magnification, it is possible to evaluate the size of the particle, to verify whether the same can be used to continue the analysis of the overlap.
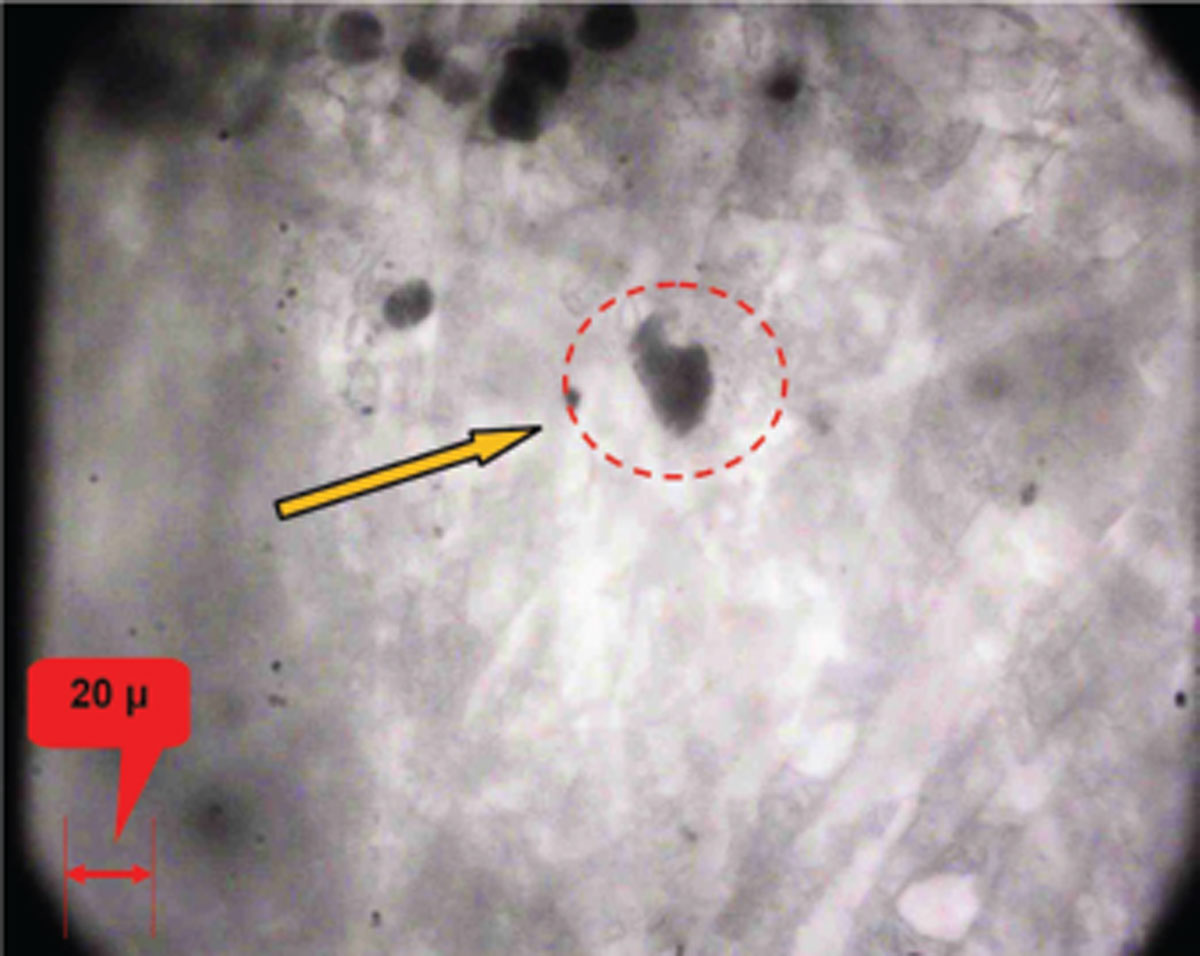
Figure 13
The same toner particle indicated by the arrow in Figure 12 appears with (only) NIR lighting in transmission, using a 50x lens.
Fifth operation:
The observation of the selected toner particle, with high magnification 50x lens in true color, using coaxial illumination (with a halogen lamp).
In Figure 14: the same particle observed in Figure 13, but now in true color mode, using: halogen coaxial illumination lighting, 50x lens and the motorized micro mechanical switch (assembled inside the Star Gate camera) positioned on the IR Cut filter (with bandwidth cutting 650nm).
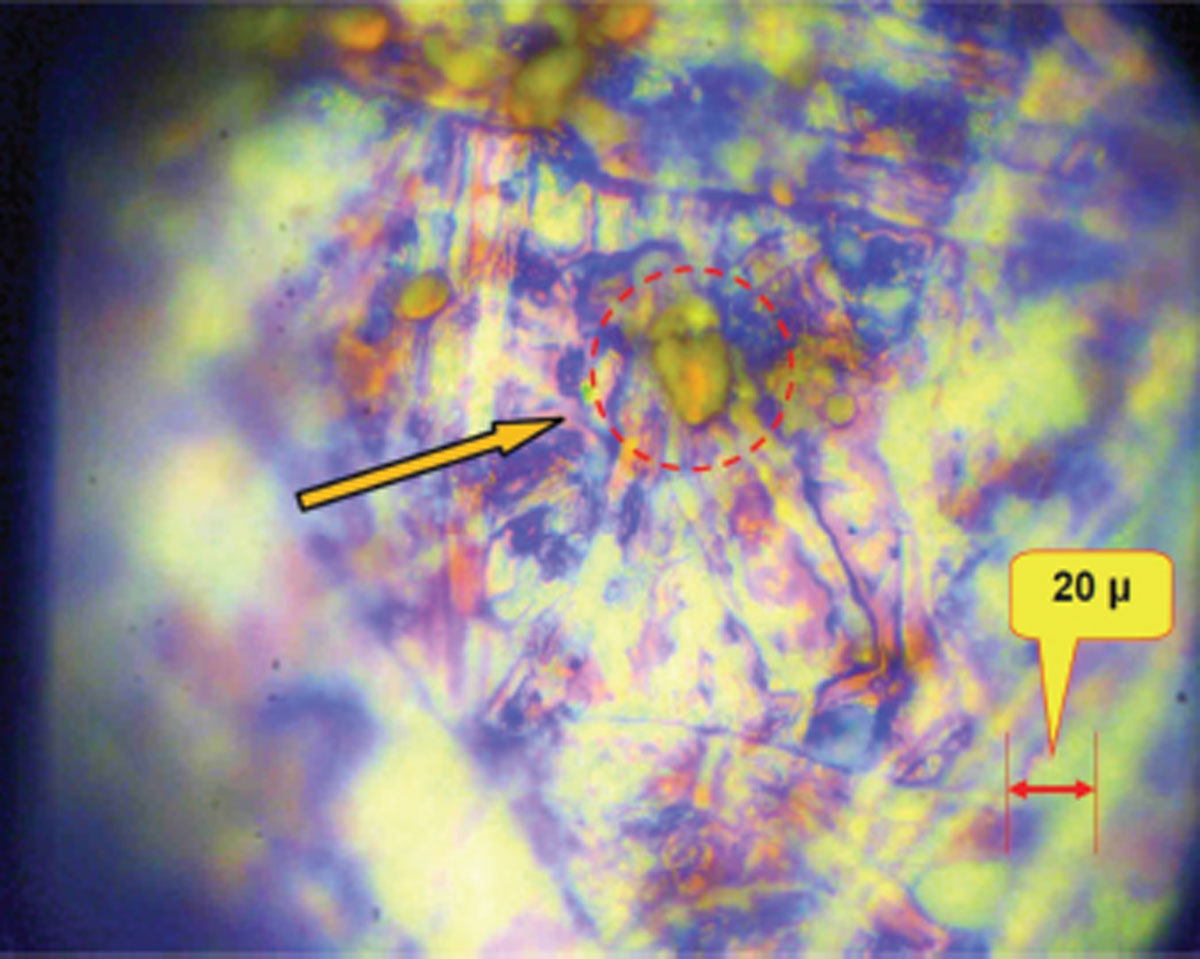
Figure 14
The same micro residue (referred to in Figure 13) taken by the Star Gate camera in true color mode using coaxial illumination, with 50x lens.
Now it is possible to check the spatial location of the particle. This must be in contact with some paper fiber covered by the ink of the blue ballpoint pen.
Sixth (and last) operation:
The observation of the selected toner particle, with very high magnification 100x lens in true color, using coaxial illumination (with halogen lamp).
In Figure 15 the same toner particle represented in Figure 14 is now imaged with very high magnification 100x, in true color, under the same operating conditions. As one can clearly see in the last two images (Figure 14 with 50x lens and Figure 15 with 100x lens), in this case the toner particle (also thanks to the coaxial illumination) has completely lost its typical black color.
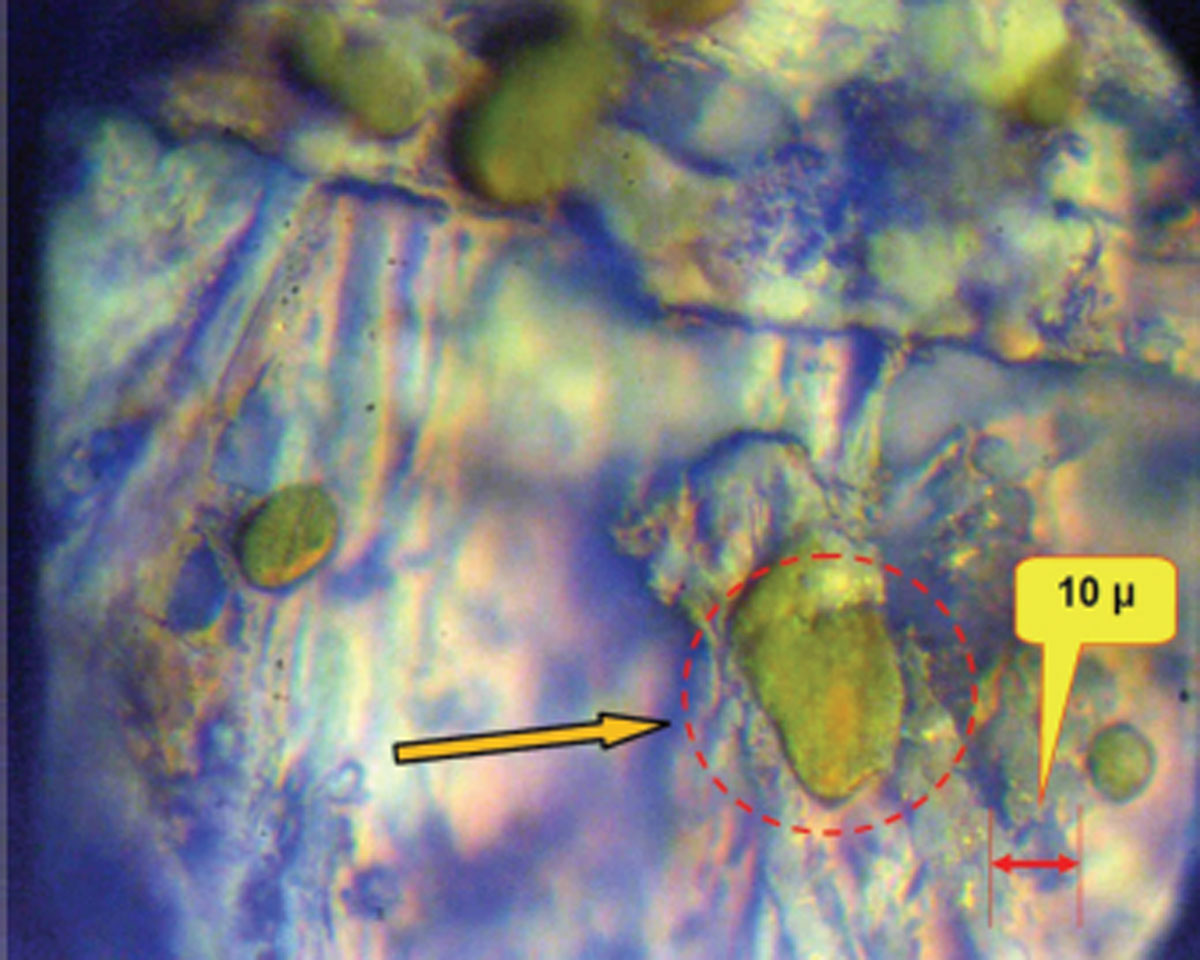
Figure 15
The same micro residue (referred to in Figure 14) acquired by the Star Gate camera in color mode in coaxial illumination and 100x lens.
In contrast, the same acquired a greenish color, with shades of brown also. The resulting image provides strong support for the toner particle being covered by the ink of the ballpoint pen.
To confirm this, it suffices to note also the other (smaller) toner particles in the same image. Their coloring is also in shades of green - green / brown. Now we repeat the same procedure, analyzing another particle of Toner, but this time along the second path: the pen of black color, to the right of the letter S (dollar symbol).
In Figure 16 the observation of the second toner particle selected, along the second stroke in handwriting: the black on the right of the dollar sign.
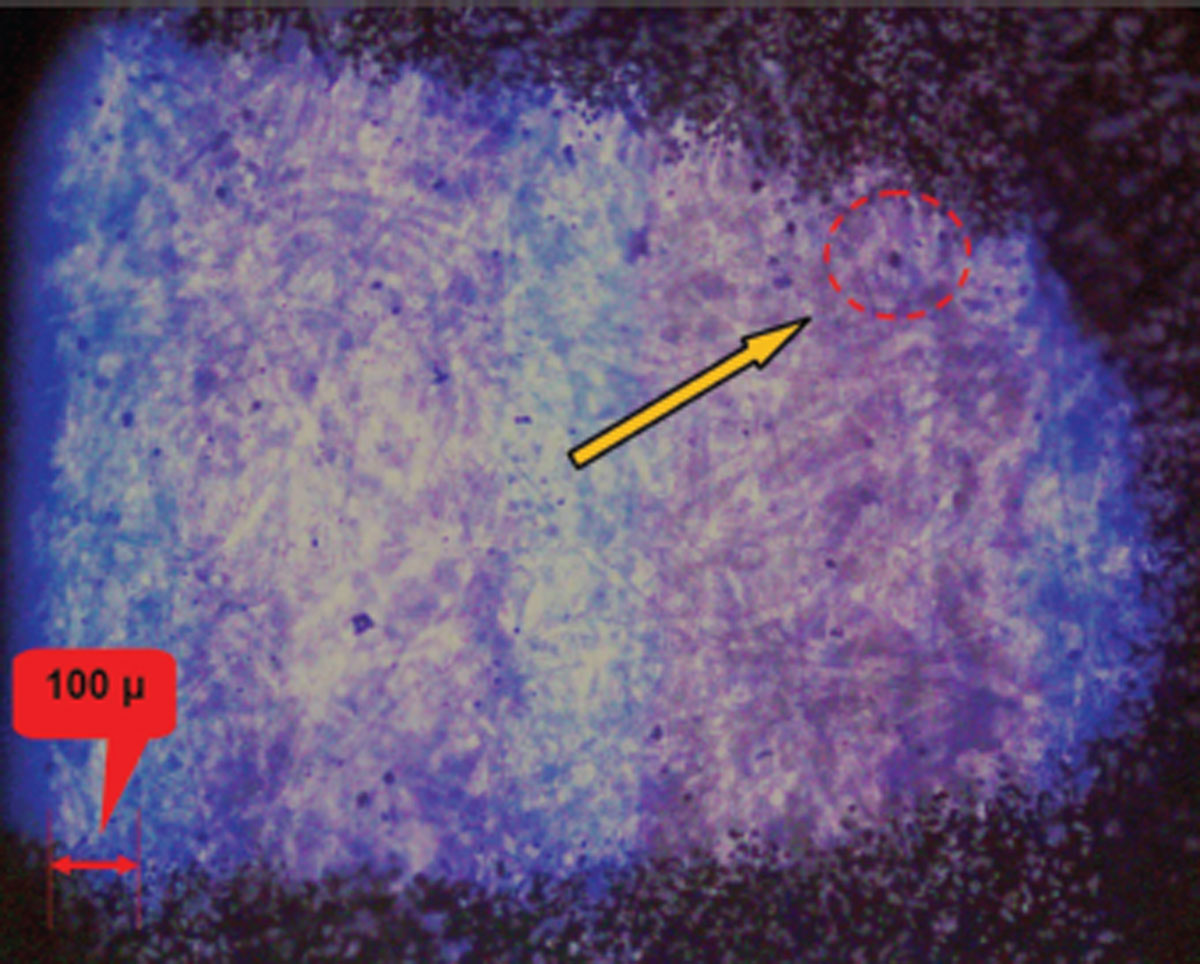
Figure 16
The micro residual toner chosen to determine the sequence of affixiation between it and the black pen ink.
The operating conditions are the same used for capturing the previous image of Figure 12 with 10x lens, using NIR transmitted mode and UV source in grazing light at the same time, to facilitate the identification of the pen tracks in the image.
In Figure 17: using the same conditions as in the fourth operation (using only NIR lighting in transmission and 50x lens). Thanks to the high magnification, it is possible to evaluate the size of the particle, to verify whether said particle can be used to continue the analysis of the overlap.
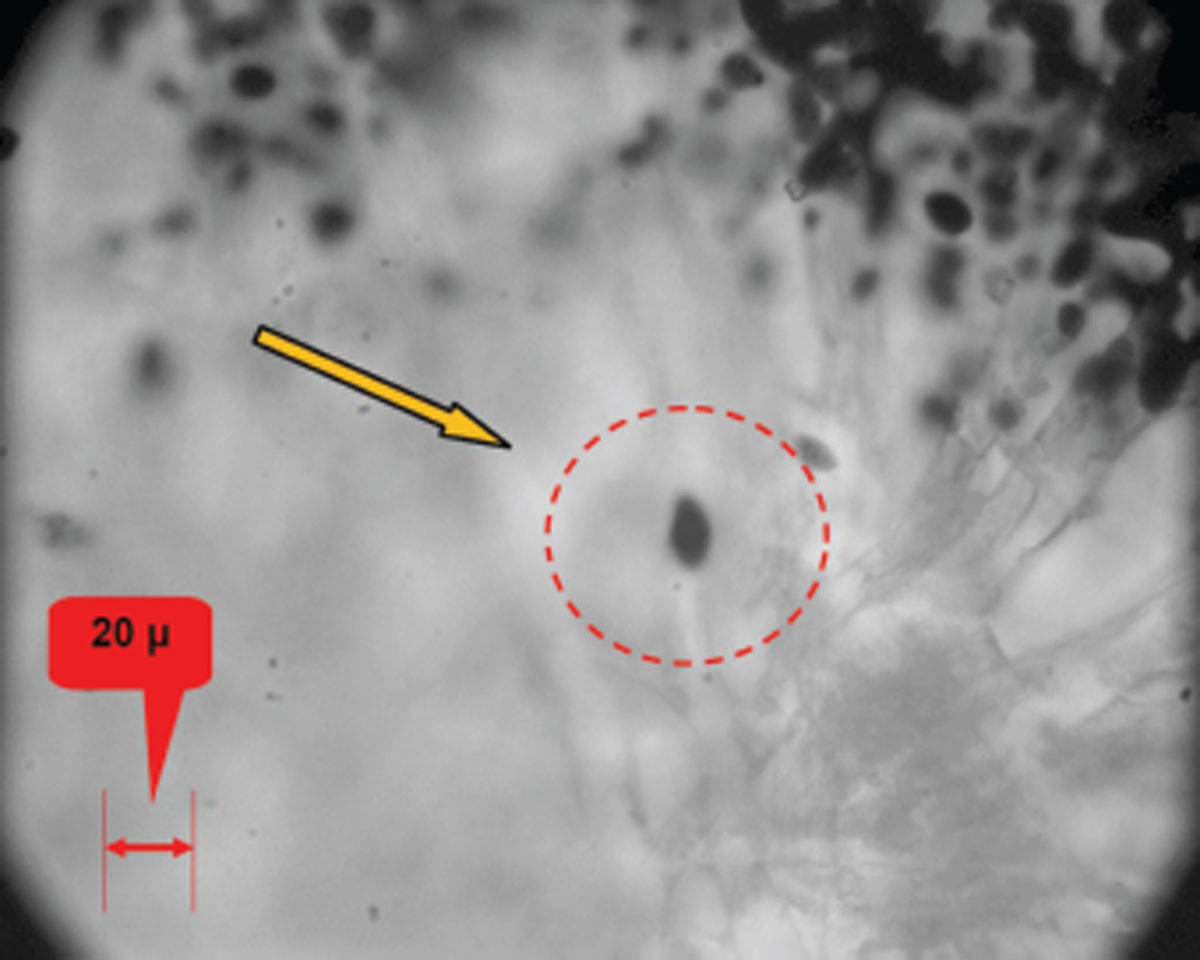
Figure 17
The same toner particle indicated by the arrow in Figure 16, using only NIR lighting 910nm in transmission, with 50x lens.
As can be clearly seen in the last two images (Figure 18 with 50x lens and Figure 19 with 100x lens), contrary to what is observed in the previous test, now the micro particle toner is not covered by the ink of the pen. The color of the ink of the pen, in fact, (under the effect of coaxial illumination) lost the color in black, turning into a shade of brown / light brown, while the particle of toner is left in black. In this case it is clear that the toner is above the handwritten line.
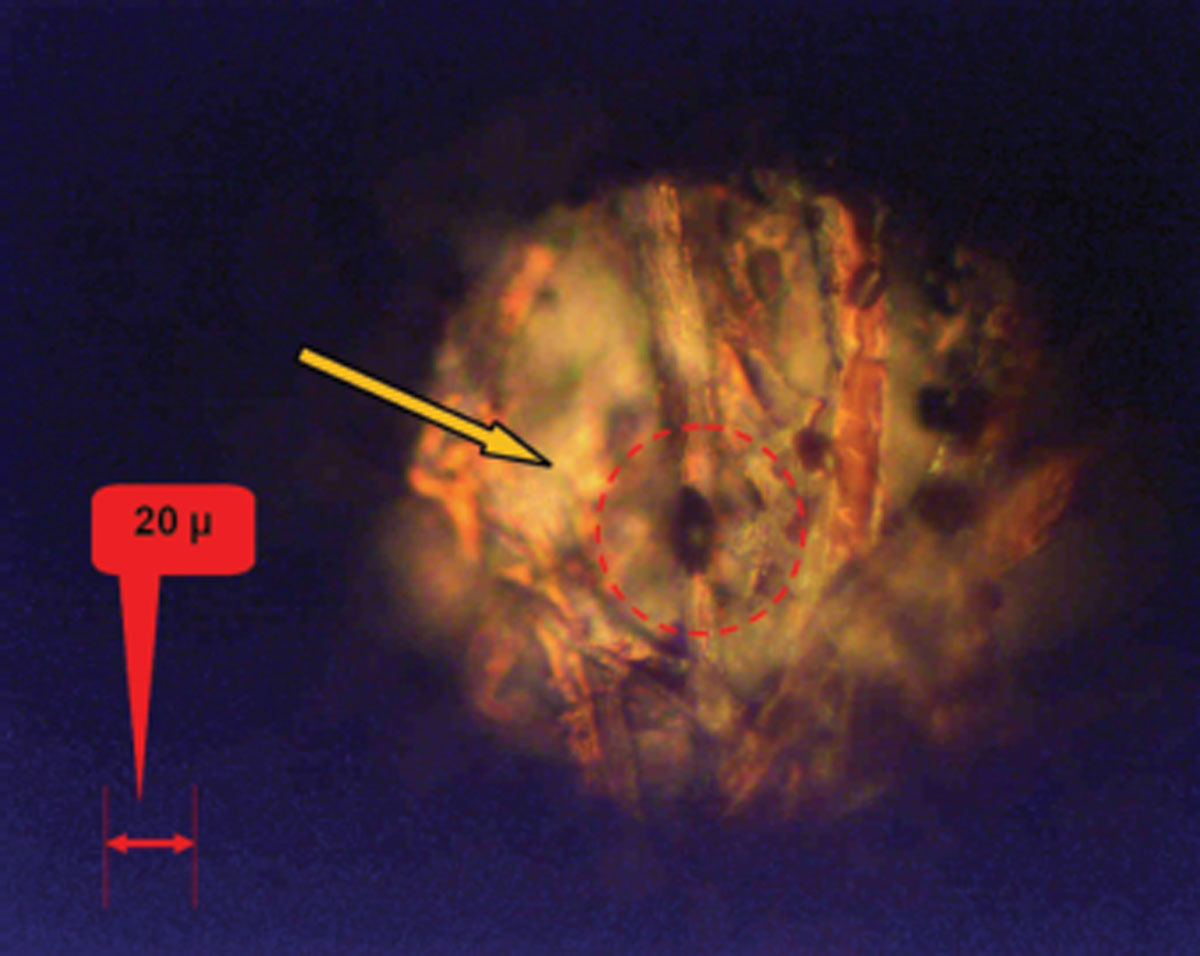
Figure 18
The same micro residue (referred to in Figure 16) acquired by the Star Gate camera in color mode in coaxial illumination and 50x lens.
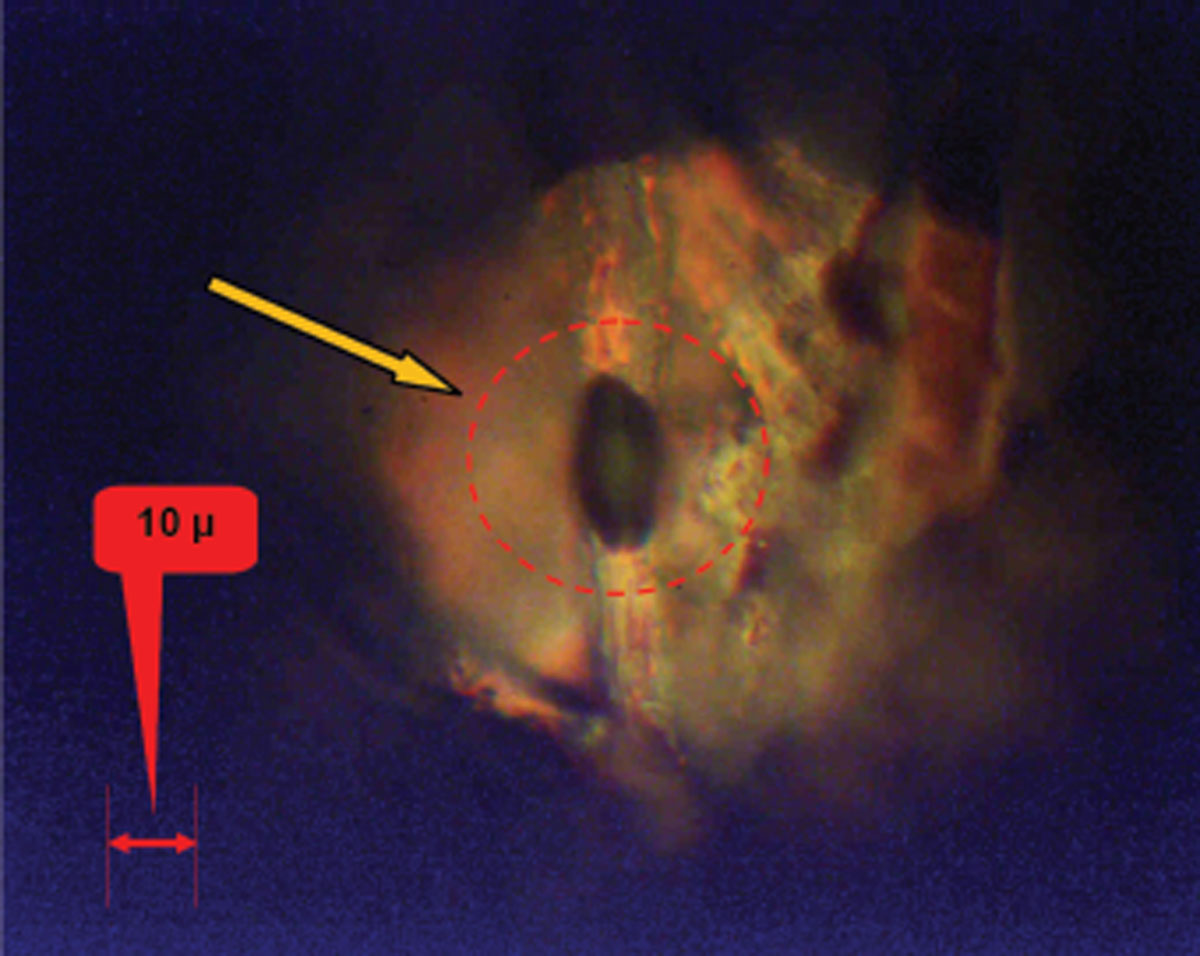
Figure 19
The same micro residue (referred to in Figure 18) but using 100x lens.
For this study, a particle of toner of very small dimensions was deliberately chosen in order to demonstrate the potential of the technique In order to better understand the major differences, both morphological and in color, between the two particles analyzed, the two images obtained at the highest level of magnification (100x with lens) were combined: Figure 15 and Figure 19 as shown in right hand column.
Figure 15
Ball pen Ink above Toner.
Figure 19
Toner above ball pen ink.
Discussion
As mentioned above, the writer further refined the technique described by colleagues [13], [14] and [15] using a suitable system of NIR transmitted mode (in addition to a source UV in semi grazing light). In the first stage this method makes it possible to uniquely authenticate the presence, size, and exact spatial location of residues of micro toner, along a path in handwriting, significantly simplifying the subsequent operations which consist in determining the order of sequence between ink and toner. Then, in the second phase (the most important), the operator can easily choose the micro toner residues to be analyzed in detail.
It should be pointed out that lighting NIR operates independently of the type and the chromaticity of the ballpoint pen used to perform the handwriting.
The suggested measurement protocol has the limitations described below:
Normally, for every square centimeter of the paper surface, there are about a hundred micro residues of toner [16]. The micro residues must (possibly) have a size of at least 10 microns in diameter. The micro toner residues must be in contact with at least one of the paper fibers covered by the ink of the ballpoint pen, and the instrumental data must provide the same results: toner particles above the ink of the handwriting (or vice versa) in at least three points analyzed.
The author confirms the peculiarities (shape, color, etc. of the particles) that colleagues have already observed: circular / elliptical particle (as the toner is above the ink, of a ballpoint pen), and on the contrary: “flattened” and uneven shape when the toner is below the ballpoint pen.
The technique has provided excellent results, (no false positives) when the dimensions of the particles were of a size equal to or greater than about 10 microns, irrespective of the type of inks for printing and handwriting.
When the particles are smaller than 10 micrometers:
The author is firmly convinced that it is possible to establish—uniquely—the sequence of the ink and toner, even for particles smaller than 10 micrometers in diameter.
However, in these cases, it is essential to use the microscope optics of the highest quality, with a very large numerical aperture, a minimum chromatic aberration, etc.
It should however be pointed out that in some cases an ambiguous situation can be found: the presence of micro particles can be found both above and below the pen tracing.
This may mean that the sheet of paper has been through the mechanical means of printing more than once. For example, in the case where text has been added, a correction, etc., in order to distort the real content of the document. As an example, the addition of text when the document had already been signed.
Obviously, in this case, it is appropriate to repeat the measurements at many more points, in order to demonstrate the steps described above.
In closing, no problems were encountered, neither in the case of thick paper, nor in the case of a different color from white (with the only exception being for thick black colored paper).
Future research:
The author has already started to experiment with the same technique with excellent results also in the following cases:
using ink pens like “Gel” and markers (with felt tip);
Inks generated by an ink jet printer. In this case much depends on the type of manufacturer of printing ink because certain ink jet inks “disappear” when they are illuminated by infrared radiation.
Acknowledgments
Acknowledgments to Dr. Dan Cojoc (CNR-IOM, Trieste, Italy), for reading and making suggestions on the text.