
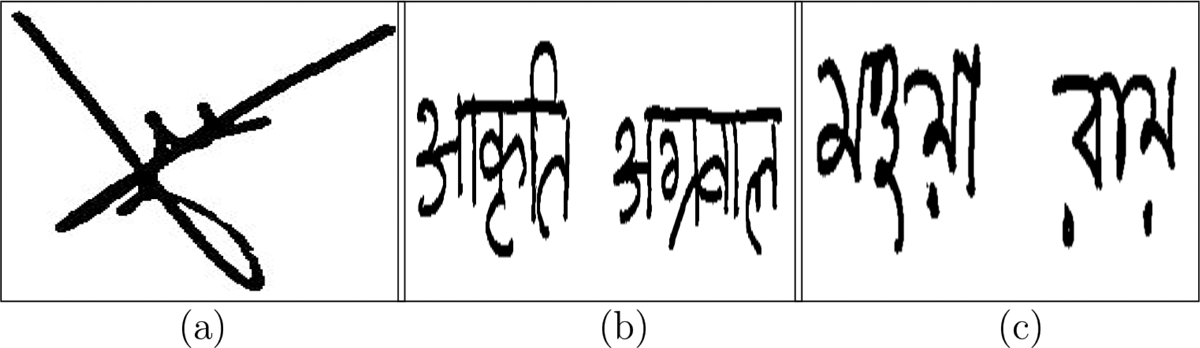
Figure 1
Sample off-line signatures of (a)English, (b)Devnagari, and (c)Bangla scripts.

Figure 2
Flow diagram of a complete signature recognition system. A knowledge base was created using the training signatures and test samples were recognised using the knowledge base.
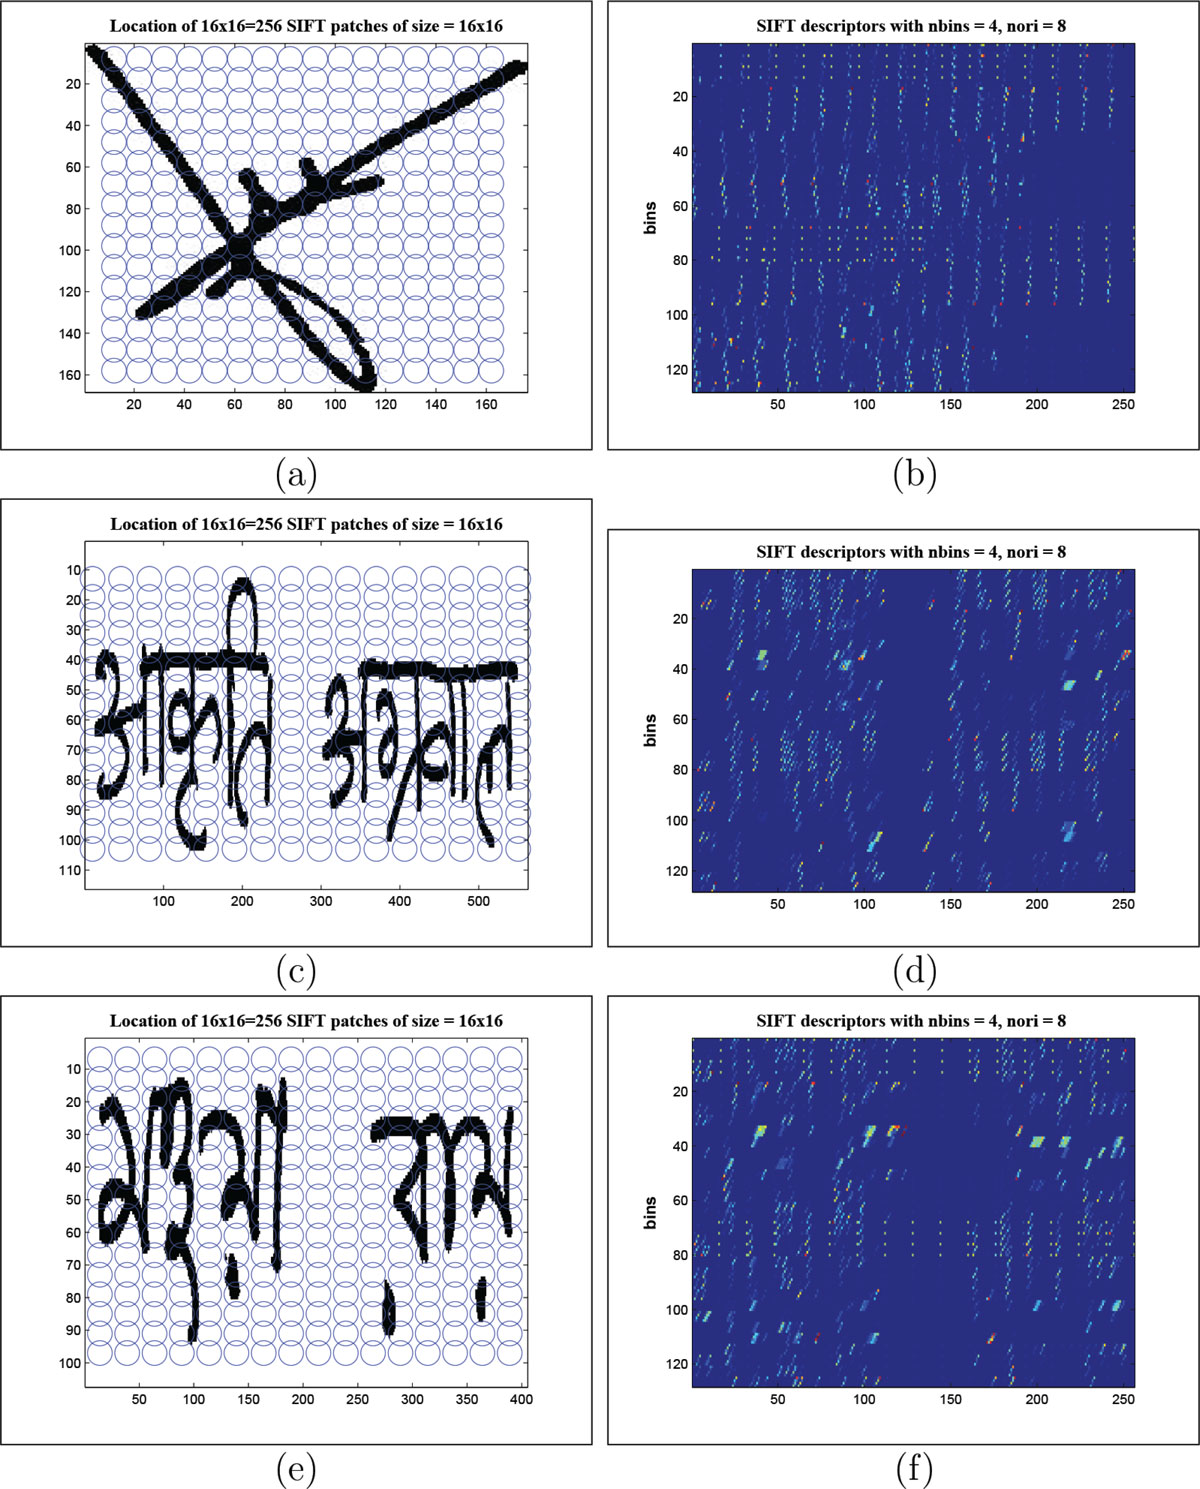
Figure 3
Blue circles represent 256 (of 16x16) SIFT patches of (a) English, (c) Hindi, and (e) Bangla signatures. SIFT descriptors with 4 bins and 8 orientations of signatures (b) English, (d) Hindi, and (f) Bangla are presented.
Table 1
6-fold cross validation results from signature identification experiment using Bag-of-Features approach. Columns F1-F6 represent the accuracy in percent (%) of the 6-folds.
| Signature Dataset | F1 | F2 | F3 | F4 | F5 | F6 | Overall |
|---|---|---|---|---|---|---|---|
| GPDS | 96.32 | 96.91 | 96.42 | 96.34 | 96.76 | 96.78 | 96.59 |
| Devnagari | 90.98 | 90.84 | 91.05 | 90.95 | 91.01 | 91.16 | 91.00 |
| Bangla | 94.69 | 94.46 | 94.29 | 94.08 | 94.57 | 94.37 | 94.40 |
| Combined | 92.85 | 93.14 | 93.08 | 92.82 | 93.03 | 93.00 | 92.99 |
Table 2
6-fold cross validation results from signature identification experiment using SPM- based approach. Columns F1-F6 represent the accuracy in percent (%) of the 6-folds.
| Signature Dataset | F1 | F2 | F3 | F4 | F5 | F6 | Overall |
|---|---|---|---|---|---|---|---|
| GPDS | 99.97 | 99.97 | 99.91 | 99.96 | 99.97 | 99.96 | 99.95 |
| Devnagari | 99.16 | 99.27 | 99.32 | 99.30 | 99.20 | 99.23 | 99.25 |
| Bangla | 99.59 | 99.50 | 99.55 | 99.55 | 99.66 | 99.63 | 99.57 |
| Combined | 99.29 | 99.39 | 99.33 | 99.31 | 99.29 | 99.31 | 99.32 |
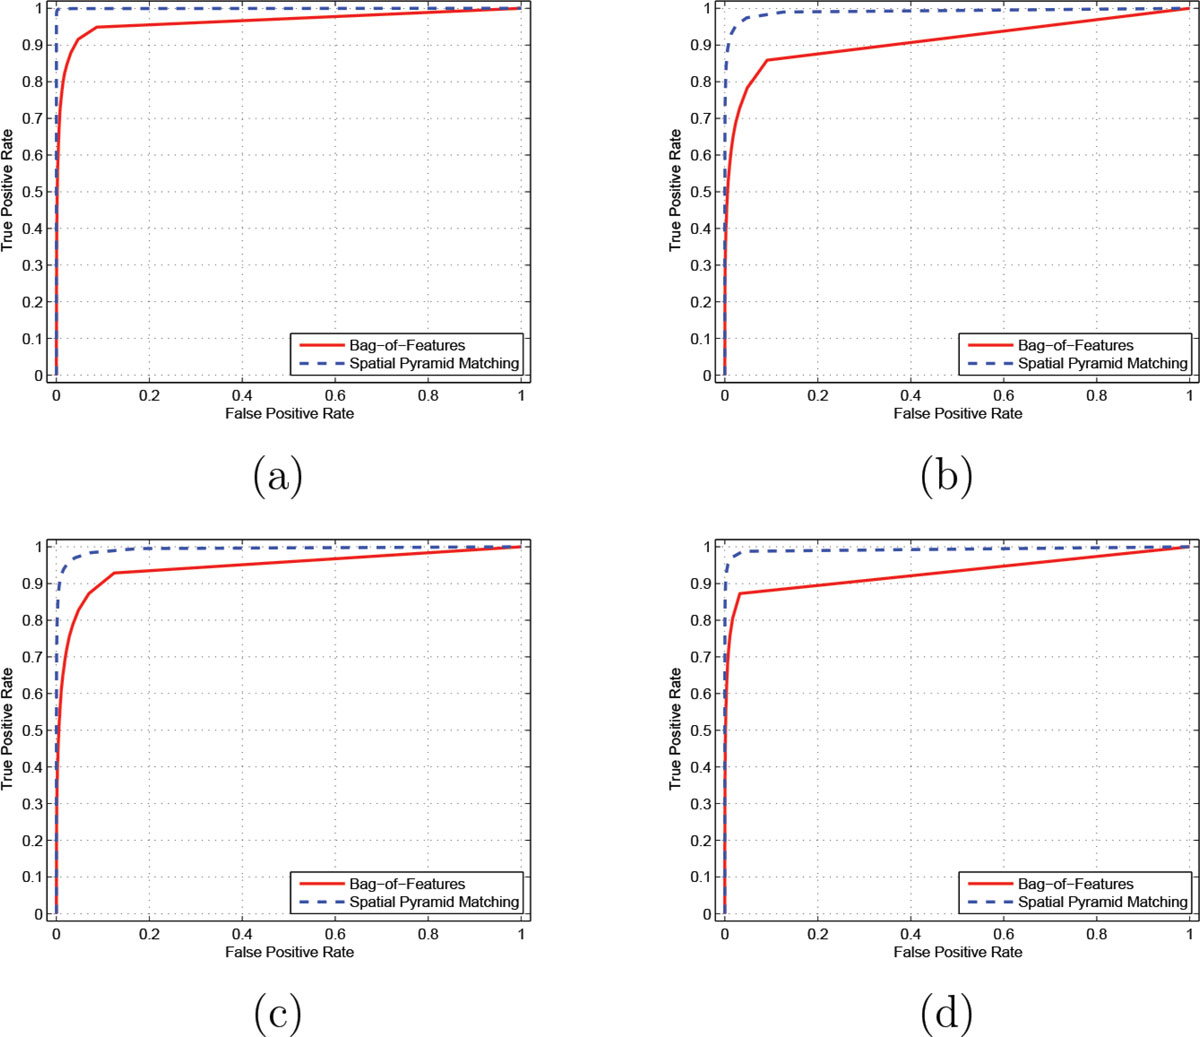
Figure 4
The ROC curves represent the performance of the Bag-of-Features (red) and the Spatial Pyramid Matching approach (blue dotted) on the signature identification experiment. A comparison between BoF-based and SPM-based techniques on different scripts (a) English, (b) Devnagari, (c) Bangla, and (d) combined, are shown here.