
Introduction
Forensic document examiners are often requested to examine inkjet printed documents. Therefore, there is a need in some instances to help determine the make and/or model of the printer used to produce the documents. There have been some studies in this area (Donnelly et al. 2010; Szafarska et al., 2011); however, the use of thirdparty inks may render ink analyses more challenging if not considered. Some researchers have shown that latent mechanical impressions on a printed document can help identify the model or brand of inkjet printer (Laporte, 2004; Yoshinori et al., 2005). In real cases, however, not all latent mechanical impressions can be effectively visualized. As a matter of fact, there are plenty of morphological features in print. Their forensic values have been addressed in the literatures (Doherty, 1998; LaPorte, 2010; Day & Bottom, 2001). Arslan et al. attempted the automatic identification of inkjet devices by analyzing banding in images and texture features in characters (Arslan et al., 2005; Arslan, 2006). The article on quantifying banding from the perspective of print quality evaluation by Briggs et al. (2000) should inspire document examiners because it not only proposed frequency analysis as the effective method to measure bandings produced by an inkjet printer, but also showed that bandings would change with the options of print quality. With methods of print quality assessment and some recognized applications, researchers have attempted to conduct the quantitative analysis on inkjet printouts. In Oliver and Chen’s study (2002), using an ImageXpert™ print quality analyzer, the outputs of three different inkjet printers were differentiated in terms of line raggedness and over-spray, dot roundness, and the quantity of satellite drops. Although these papers suggested potential methods of identifying an inkjet printer using printing features, in the author’s opinion, such methods are not valid until the changeability and stability of these features are better understood.
In this study, experimental research on the stability of class characteristics of inkjet printers was performed, on which two papers were previously published discussing two specific class features: satellite droplets (Liu, 2011) and increment of paper feed stepping (Liu, 2011) respectively. This paper is also based on the same experimental research, in which 80 different models of inkjet printers, primarily of three brands (Epson, Hewlett-Packard (HP), and Canon) were sampled and investigated.
It is known that media type can significantly impact inkjet print (Briggs et al., 1999). LaPorte (2010) pointed out that the limitations of the quantitative analysis might be obvious “when comparing documents produced on different substrates.” In addition, different inks used in the same inkjet printers are very common, including the original equipment manufacturer’s cartridges, third-party cartridges, and refilling inks with various qualities and properties. Therefore, the purpose of the stability research was intended to find out the printing features which are least affected by ink and substrate. As a result, some relatively stable class features were identified. They are: increment of paper feed stepping, halftone algorithm, halftone dot structure, nozzle arrangement, and color configuration.
Some features which are valuable for print quality evaluation, such as dot roundness, dot area, line width, blurriness, bleeding, darkness, mottle, and so forth (defined by ISO 13660), were found to be widely diverse if using different inks or types of paper. Accordingly, the attempt at quantitative methods failed to produce a meaningful result and then was abandoned in this research.
Apart from the ink absorption of the paper, the variety of print modes caused obvious variation of features on the printouts even by the same inkjet device (see Fig. 1). This gives the impression that inkjet features are unpredictable. Moreover, when examining a questioned printout, even though several types of stable characteristics are available, they seem to be unrelated, and thus a forensic analyst always has a problem with how to start an examination. In this study, the author attempted to find a solution to the problem by investigating the relatively stable features as follow.
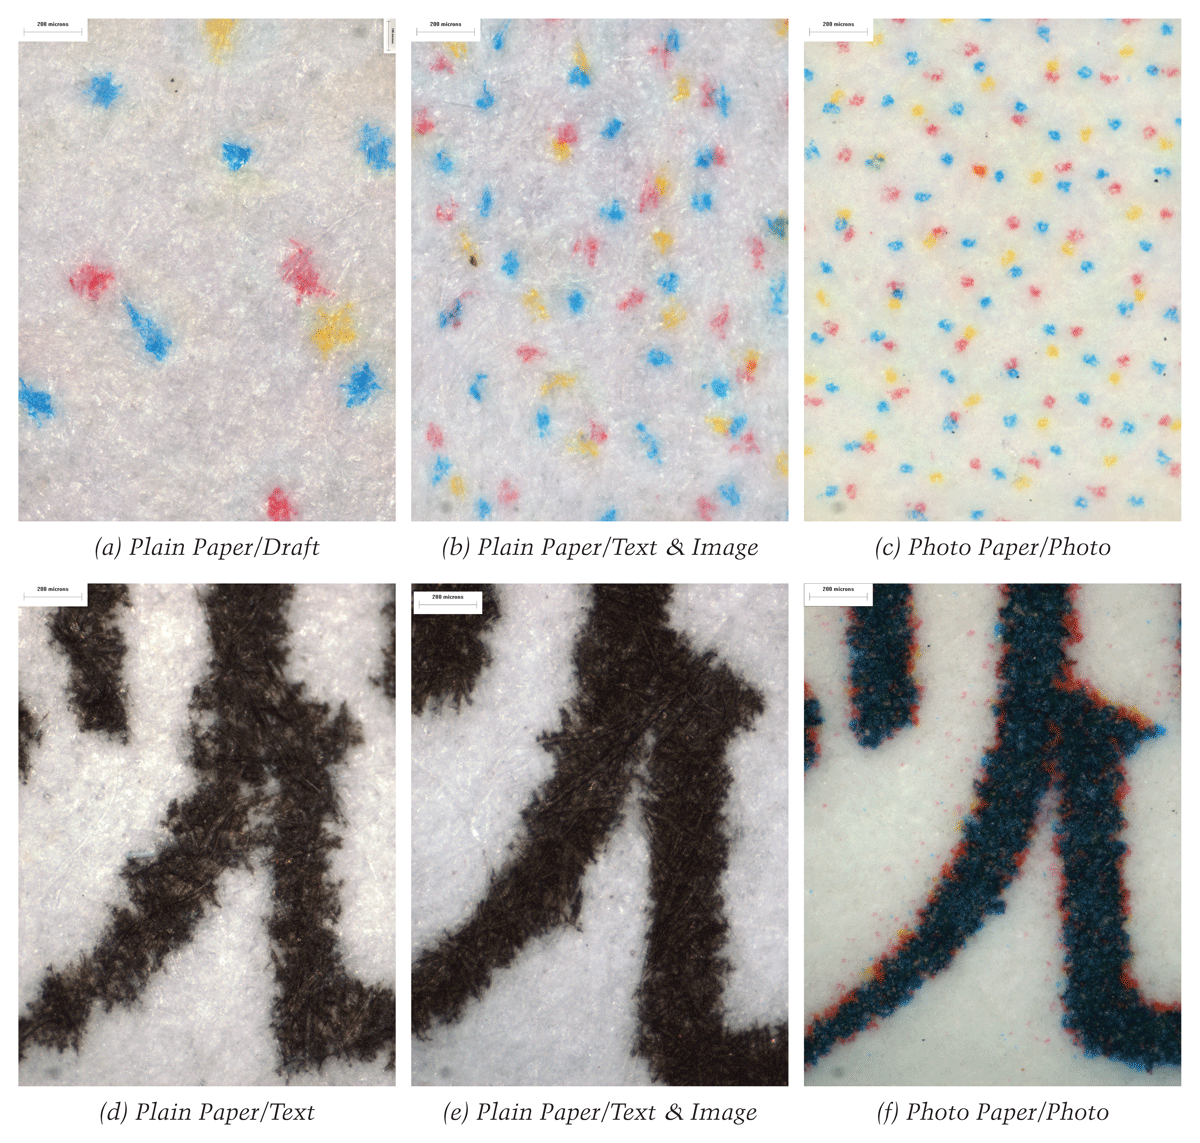
Figure 1
The comparison of the same image area (10% gray level) and the same text (the part of a Chinese character) printed in several print modes by an Epson SC67 printer.
Increment of Paper Feed Stepping
Increment of paper feed stepping refers to the measurement of the distance (along with the paper advance direction) between the two adjacent defects in print, such as bandings, linear voids, partial overlapping between swaths, vertical misalignment, and other repeated minor abnormalities. Most of these defects may be easily removed by using the maintenance functions in driver software or changed by replacing the cartridges or print heads. However, the distance between two adjacent defects is fixed because it is determined by the printer mechanism and the driver software. An inkjet printer has at least two essential stepper motors. One is responsible for moving a print head assembly horizontally across the paper to spray ink drops. Its stepping increment is so fine that it cannot be seen by the unaided eye. However, it exists and is associated with the horizontal resolution of the print. The other is for advancing a sheet of paper passing through a printer step by step in a configured increment. Both of these motors work in tandem with each other to ensure normal printing. The latter is called the paper feed stepper motor. The increments of paper feed stepping are configured in the driver software before a printer comes onto the market. If some flaws recur in every print pass, the flaws will reveal the increment of paper feed. This is the reason why the author named the feature as the increment of paper feed stepping (Liu, 2011). The measurement can be readily obtained as long as one kind of those defects recurs in an output. It can indicate an intrinsic class feature which is less affected by ink and substrate.
Halftone Algorithm
Inkjet printers generate halftone images with digital halftone algorithms. The digital halftone algorithms compute the positions where dots will be printed. Since inkjet technologies “have evolved to a point where it is possible to control the dot placement with extraordinary accuracy and speed” (Wandell & Silverstein, 2003), the dot distribution patterns can reflect the halftone algorithms if there were no printing malfunctions or excessive blurring/feathering. Hains et al. (2003) pointed out that the dot distribution pattern (or halftone structure) “is the most visible characteristic of halftone algorithm.” There are the distinguishing natures of the dot distribution patterns of amplitude modulated (AM) halftoning and frequency modulated (FM) halftoning. As a matter of fact, within the same types of halftoning methods, different algorithms or different matrices also produce the discernable differences in halftone dot distribution, which could be used as a feature for classification of inkjet printers. The author named this feature as halftone algorithm in order to emphasize the cause. This feature was not recognized at the lightest gray patches (e.g. 5% gray levels) and darkest gray patches (e.g. 80%-100% gray levels), because the inadequate amount of dots and the dot overlapping are both unlikely to show the characteristics of halftone algorithms.
Digital halftone algorithms can be categorized into three groups: 1) point processes (screening or dithering) which are characterized by applying a threshold array; 2) neighborhood algorithms (e.g. error diffusion) with which “each pixel is quantized based on the pixel itself in addition to neighboring pixels”; and 3) iterative methods which require several passes through the original images to compute the dot placement of its halftone images. The third type is not used in “commercial systems” due to their “computational complexity” (Lee and Allebach, 2005). The methods of the first category are subdivided into clustered dot halftoning (belongs to AM) and dispersed dot halftoning (e.g. Bayer dithering). They are both very fast to execute computationally. Error diffusion algorithms (belongs to FM) produce better details and higher image quality but their implementations are more complicated and time-consuming than threshold arrays (Baqai et al., 2006; Hains et al., 2003; Atkins et al., 2004).
Halftone Dot Structure
A halftone dot is a unit (or a cell) of a halftoned image, rather than a pixel which is the single drop a nozzle can spray. In a sense, it is the size of the halftone dot that determines the spatial resolution of the print. An inkjet printer could produce several levels of spatial resolution if modulating the size of the halftone dot. The feature named as the halftone dot structure defines the size and the composition of one halftone dot in the print. With an AM algorithm, a halftone dot could be a clustered dot comprised of a number of ink drops, which is primarily related to its dither matrix and the gray level of the processed image part; while an FM algorithm creates randomly dispersed and same-sized dots, a halftone dot could consist of one ink drop, or several ink drops according to the designated resolution of printing.
Satellite Droplets
Satellite droplets are inevitable due to current inkjet technologies. When a primary drop is ejected and breaks away from the ink in the chamber, the surface tension of the ink causes smaller droplets. These droplets are called satellites or satellite droplets. Because the speeds of satellites are lower than the primary drops during the droplet formation process after they are ejected from the nozzles (Chen et al., 1998), and because of the movement of the print head, they might not be located at the place where the primary drop landed. Some methods (Lorenze, Jr. et al., 1995; Maze et al., 1994; Lubinsky et al., 2002) and systems (such as piezoelectric inkjet systems) can minimize or eliminate satellite droplets, however, satellites are still hardly avoidable, especially with thermal inkjet systems.
The satellite’s location relative to the primary drop normally indicates the direction of the print head movement (LaPorte, 2010). Typical satellites could indicate the brand of an inkjet printer, and the analysis of satellites could be helpful in the classification of inkjet printers (Liu, 2011).
Color Configuration
In the context of this study, the color configuration refers to the ink(s) (or how many inks) in the cartridges that are used to print an image; this is determined by the default configuration in the printer driver software. Inkjet printers commonly used in homes and offices are typically equipped with four or six inks. The four inks are the three subtractive primaries (cyan, magenta, and yellow) inks and one black ink. Some printers may also contain light cyan and light magenta inks. According to the type of print object, print quality, print media, and other factors, an inkjet printer is configured to fire certain ink(s) from the cartridges onto the substrate to form the print. This configuration might vary with printer models.
During the stability study of class characteristics, the author discovered that there was a perceptible relationship between print mode and the variation of these features. This research was designed to reveal the role of print mode determination. Based on an extensive literature search, there has not been any published studies that focus directly on the relationships between print modes and inkjet printing features.
Materials and Methods
As shown in Table 1, 80 models of thermal (HP and Canon) and piezoelectric printers (Epson), commonly found in the Chinese market, were used for this study. Inkjet printers in homes and offices were the main focus of the study.
Table 1
A list of inkjet models used to produce the experimental samples.
| Epson | Hewlett Packard | Canon |
|---|---|---|
| Stylus Color 20 | Deskjet 640c | BJC-8200 |
| Stylus Color 460 | Deskjet 656c | BJC-210SP |
| ME 1 | Deskjet 880c | BJC-255 sp |
| ME 1+ | Deskjet 1180c | BJC-1000 sp |
| Stylus Color 480 | Deskjet 1120c | BJC-265 sp |
| Stylus Color 41 | Deskjet 1125c | BJC-4310 sp |
| Stylus Color 43 | Deskjet 920c | BJC 4650 |
| Stylus Color 61 | Deskjet 930c | BJC F-360 |
| Stylus Color 65 | Deskjet F388 AIO | S100 |
| Stylus Color 67 | Deskjet 3325 | S200 |
| Stylus Photo EX | Deskjet 3820 | S6300 |
| Stylus Photo EX3 | Deskjet 3748 | S900 |
| Stylus Color 80 | Deskjet 3938 | i70 |
| Stylus Photo 1200 | Deskjet 3918 | i455 |
| Stylus Photo 830 | Deskjet 3658 | i950 |
| Stylus Photo 710 | Deskjet 9808 | i6100 |
| Stylus Photo 790 | Deskjet 9868 | PIXMA iP 1000 |
| Stylus Photo 1270 | Deskjet D4168 | PIXMA iP 1200 |
| Stylus Photo R230 | Deskjet 1280 | PIXMA iP 1600 |
| Stylus Photo R310 | Officejet 5510 AIO | PIXMA iP 1980 |
| Stylus Photo R250 | Officejet 5608 AIO | PIXMA iP 2000 |
| Stylus Photo 925 | Photosmart 2110 | PIXMA iP 2200 |
| Stylus Photo 950 | Photosmart 1406 | PIXMA iP 2680 |
| Stylus CX 5100 | Photosmart 1218 | PIXMA iP3680 |
| Stylus CX 3500 | Photosmart 7550 | PIXMA iP 4000 |
| Stylus Photo R1390 | Photosmart 7660 | PIXMA MX 338 |
| Photosmart 7150 | PIXMA iX 4000 |
Sample Preparation
A designed test page was printed from each printer (please see Appendix 1 for the details) with its own drivers as they function normally in terms of its hardware and software, despite that the tested inkjet printers ranged from brand new devices to ones more than ten years old. The test page, which consisted of text, graphics and images, was printed with Microsoft Word 2003 in a Windows XP operating system environment for the whole sampling process.1
The variables in the sampling experiments were ink, substrate, and print mode. Two kinds of inks were applied respectively in each sampled device: the original equipment manufacturer’s cartridges, and the third-party cartridges or inks. The media types included machine-glazed paper (30 g, unknown brand), glossy paper (80 g, produced by Siwei Industrial Corporation Limited, China), copier/printer paper (Gold Flagship Multipurpose Paper 70 g, and Double A Copier Paper 80 g), inkjet paper (Epson Photo Quality Ink Jet Paper), and photo paper (Epson Economy Photo Paper). The selected print modes were the combinations of three aspects: quality, paper, and color. For print quality, the names of options vary with different printer makes, which are shown in Table 2. In this study, only a few models, such as the Canon iP1000, HP Deskjet 930, Canon S900, and Epson Stylus Photo 710, were sampled with every print mode option. It was found that the configurations for all of the print modes in the drivers of these four models were limited to several combinations. This was one of the reasons why the author designed the sampling experiments with only the commonly used print modes. As for the paper options for print modes, Plain Paper or Photo Paper were chosen according to the types of print media. Generally, Plain Paper for copier/printer paper and Photo Paper for inkjet paper and photo paper.
Sample Analysis
After sampling, all produced printouts were scrutinized, and the aforementioned features in different print modes were morphologically compared with each other using an Olympus® BX51TM microscope (compound microscope). The stepping increment of paper feed was observed and measured using a 10X magnifier and a micrometer with 0.1 mm minimumscale. In this study, to observe and capture the features at the micron level, the 5X objective lens of the microscope was used with a Media Cybernetics EvolutionTM MP 5.0 mega-pixel camera and Image-Pro® Plus 5.1 software.
To reduce interference, the print areas without obvious printing defects were selected for observation, avoiding areas containing malfunctions or notable defects, except for measuring the increments of paper feeding, where defects were considered helpful. Additionally, in order to reveal the increments of paper feed, several methods were deliberately employed, such as replacing flawless cartridges with defective ones which can create various flaws, or cancelling the print process in the course of a printing operation to show the unfinished or unlapped swaths.
This paper, which focused on print mode, was an extension of the stability study. Therefore, the materials and methods were the same as those in the stability study. In addition, the author executed the supplemental sampling experiments for the purpose of clarifying some facts which might be unrecognizable due to the ink feathering or bleeding on plain paper. In this case, photo paper was exclusively used in every print mode.
Results and Discussion
Common print modes are mainly used to control print quality and print speed, though there are custom options for media type, resolution, speed, color management, and so forth in many printer drivers. Before an inkjet product comes to the market, several often-used print modes have been set with fixed parameters in its driver for users to minimize the number of button clicks necessary to operate a printer.
By sampling experiments and investigating the features in print, it was found that all sampled printers have similarities and differences in terms of parameter modulation for print modes. They were similar in a principle, that is, there has to be a trade-off between print quality and print speed. This means that a printer conducts high speed printings at the expense of print quality by applying the quicker halftone algorithms, higher speeds of the print head (resulting in lower horizontal resolutions), fewer printing passes, and narrower color gamuts, and so forth. For higher-quality printings which have a preference for print quality over speed, more complicated algorithms, lower speeds of print head (resulting in higher horizontal resolutions), more printing passes, and better color rendition were assigned. The obvious variations can be found in the said features produced in different print modes. Meanwhile, the different types of printers vary in their technologies to achieve the modulations, which can be observed in these features as well.
Print Mode and Increment of Paper Feed Stepping
Depending on the mechanism of an inkjet printer, especially of the length of nozzle array, the increments of paper feed stepping were configured for different print modes.
Fast/draft mode is often one-pass printing. In one-pass printing, each motion of the print head typically prints a swath as wide as the length of nozzle array. Each pixel is formed by one pass of the print head in this print mode, therefore print defects/artifacts are revealed. Alternatively, high-quality print modes adopt multiple-pass printings to avoid or minimize defects/artifacts, and therefore, improve print quality. In a multiple-pass mode, every pixel is visited more than once by the print head (Lee and Allebach, 2005), while the paper stepping increment is smaller than the length of nozzle array; however, the tradeoff is that the print speed decreases. Table 3 shows a comparison of the data of the increment of paper feed, which were measured in the printed samples from several models in different modes. The data was obtained by averaging the repeated measurements of multiple objects using a ruler, or by more sophisticated methods, such as a frequency analysis on scanned images. The comparison shows that an increment of paper feed stepping indicates not only the class of an inkjet printer but also the print mode used.
Table 3
The data of the increment of paper feed obtained from the samples printed by six selected inkjets in different print modes (Unit: mm)
| Print Mode | Part of Print | Canon iP 1880 | Canon S200sp | HP Deskjet C1120 | HP Deskjet D4168 | Epson CX5100 | Epson SC 43 |
|---|---|---|---|---|---|---|---|
| Plain Paper/Full-color/Fast | Black | 13.50 | 4.50 | 12.75 | 14.00 | 25.33 | 3.17 |
| Color | 8.00 | 1.66 | 5.40 | 8.50 | 8.20 | 3.17 | |
| Plain Paper/Full-color/Normal | Black | 13.50 | 4.50 | 1.375 | 3.95 | 6.44 | 0.50 |
| Color | 4.00 | 0.83 | 1.375 | 3.95 | 2.07 | 0.50 | |
| Plain Paper/Full-color/Best | Black | 2.00 | 0.83 | 0.625 | 1.00 | 1.00 | 0.23 |
| Color | 2.00 | 0.83 | 0.625 | 1.00 | 1.00 | 0.23 |
Print Mode and Halftone Algorithm
In accordance with print qualities, a few halftone algorithms with the given resolutions are assigned to various print modes in an inkjet driver. In this study, the dot patterns resulting from diverse halftone algorithms were distinguishable on the image parts printed by different types of Canon and HP printers, and in the various print modes by one device as well.
Some typical patterns of halftone dot distribution could be recognized as a result of certain halftone algorithms, whereas others could not be traced back to the specific algorithms due to the author’s limited knowledge on digital halftoning. However, the differences between the dot distributions produced by different halftone algorithms, or different filter matrices, could be distinguished more easily. For example, HP Deskjet 930 and some of the HP contemporaries adopted a clustered-dot algorithm in fast and normal mode for printing monochrome (black) images, but with different resolutions (see Fig. 2a, 2b); for printing images in full color, a Bayer’s dither matrix was applied in fast mode (see Fig. 2c), while an error diffusion algorithm was employed in normal mode (see Fig. 2d).
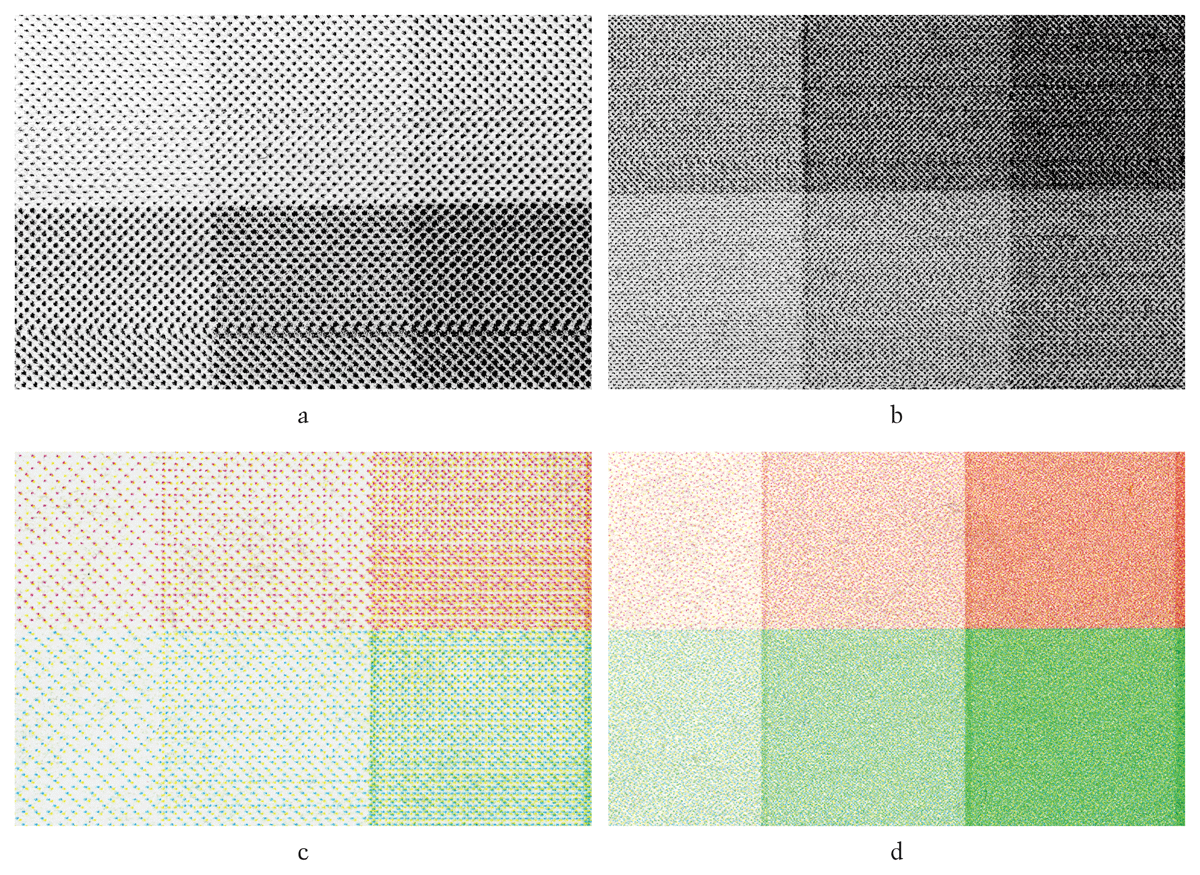
Figure 2
The halftone images produced by HP DJ 930c (scanned images): a) fast/black-only/plain-paper mode; b) normal/black-only/plain-paper mode; c) fast/color/plain-paper mode; and d) normal/color/plain-paper mode.
However, other HP devices, such as Deskjet 3938, Deskjet 3918, Deskjet 3658, Office 5510, Officejet 5608, applied error diffusion or other stochastic (nonperiodic) halftoning techniques both in fast draft mode and normal mode, but with different matrices and different resolutions. A distinguishable artifact, called structure artifact or texture artifact, i.e. “repetitive or semirepetitive visible structures” (Ostromoukhov and Hersch, 1998), was easily observed in images of 20%~60% gray-level printed in fast mode by these HP devices (see Fig. 3). This kind of halftone dot distribution pattern was not present in other print modes for the HP devices, nor on any output produced by the ink jets of other manufacturers in this study. In this case, the special pattern of the structure artifacts, which is due to this halftone algorithm, could be a signature for determining the type of the device used and the print mode in which a document was printed.
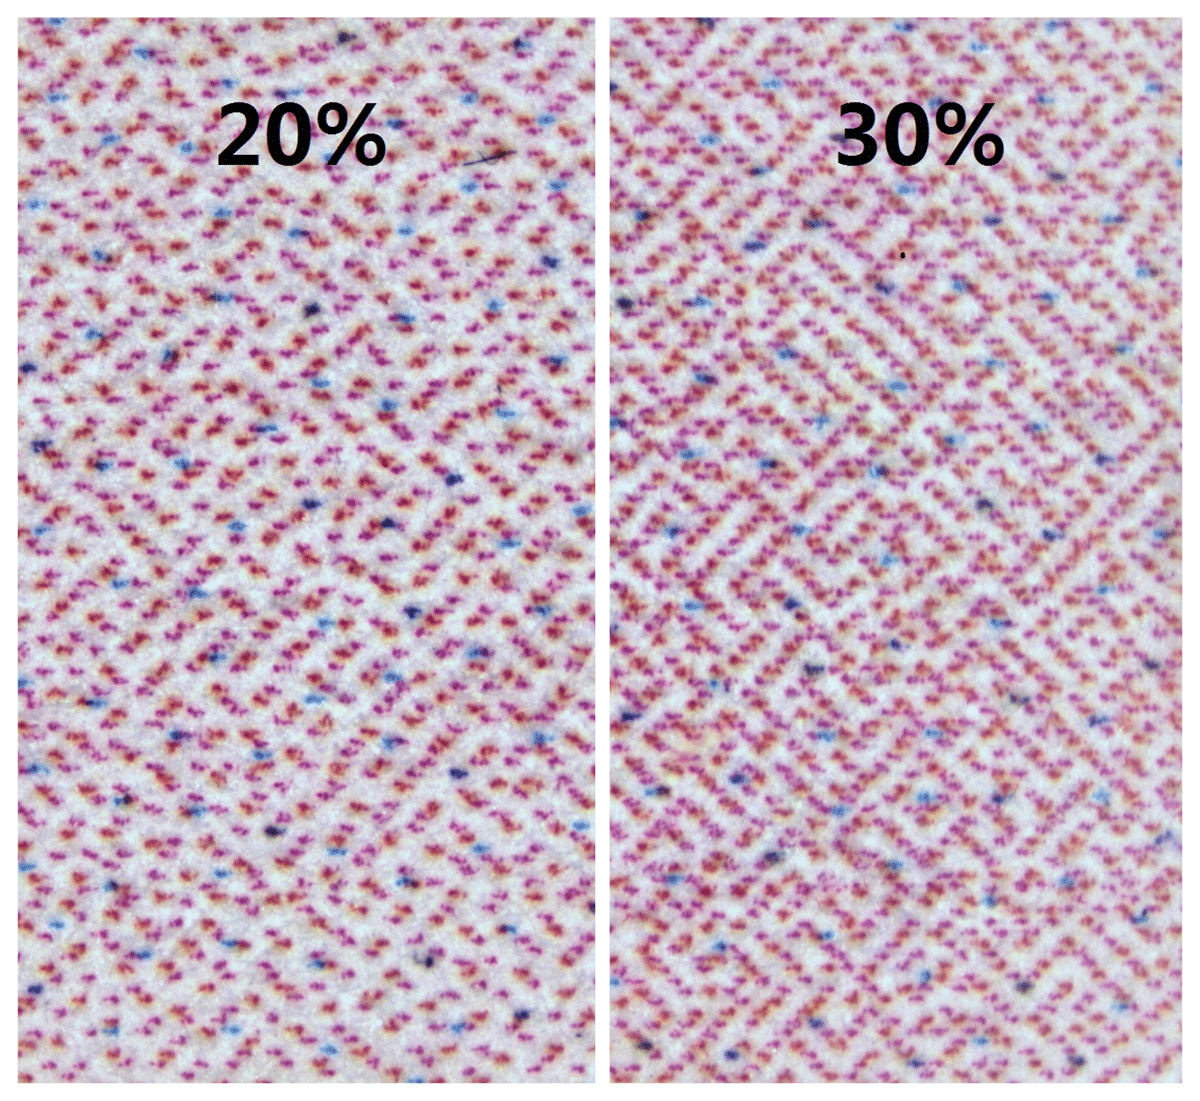
Figure 3
Examples of the structure artifact produced by HP Deskjet 3938 in fast mode (scanned image, ‘20%’ and ‘30%’, which refer to the gray scales of the images, were labeled on by the author).
Even though some ink jets (e.g. Epson printers) applied the same halftone algorithm in each of their print modes, different resolutions were assigned. This is achieved partially through modulation of the halftone dot structures.
Print Mode and Halftone Dot Structure
Generally, ink jet printers are configured to produce bigger halftone dots at lower spatial resolutions to improve printing speed, or smaller halftone dots at higher resolutions to improve print quality. This embodies the necessary trade-off between print resolution and print speed. The sampling experiments in this study verified that this principle was perceivable in the features of halftone dot structure.
The patented Epson’s Variable-Sized Dot Technology enables the ejection of several volumes of drops at the same time, normally 3 or 5 kinds of larger-volume drops in fast mode and smaller drops in high quality modes, both according to the grayscale values: darker, larger drops, and vice versa. Figure 4 shows the sizes and the structures of the halftone dots. To avoid the disturbance of ink feathering, photo paper was used for every print mode.
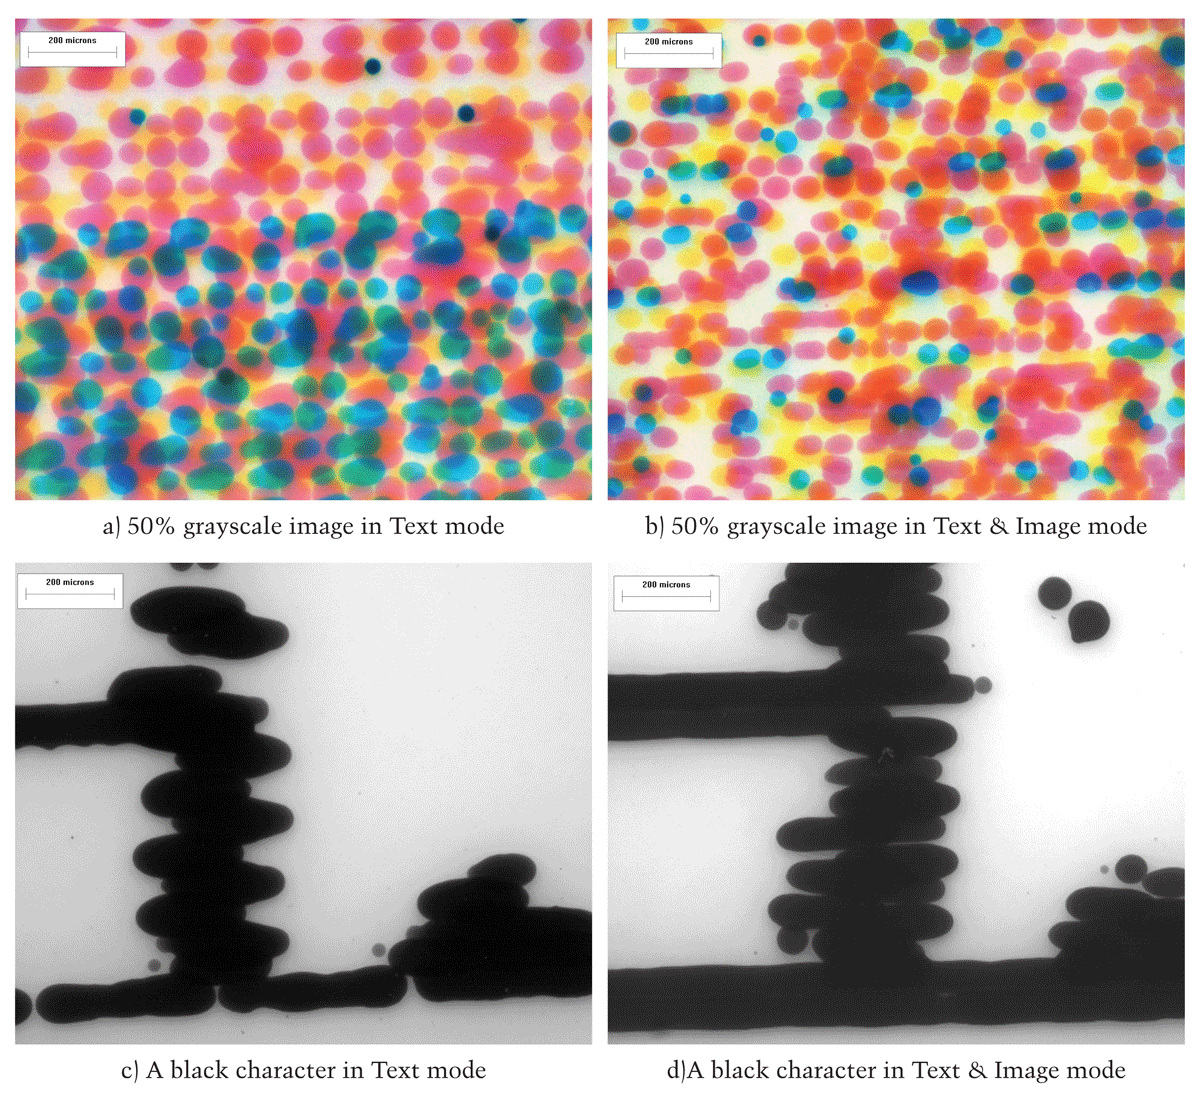
Figure 4
The comparison of the microscopic photos from images and characters printed in different modes by an Epson CX5100.
The tested HP and Canon printers cannot modulate the volumes of ink drop as Epson’s piezoelectric technology does; instead, the newer Canon and HP models, such as, Canon iP series, Canon MX 338, Canon iX 4000, HP Deskjet 12 80/3748/3938/3918/3658/9808/9868/D4168, and HP Officejet 5510/5608, achieve variable resolutions for different modes by modulating the quantity of ink drops. With Error Diffusion, normally either four drops or two drops were observed in the printouts in fast mode, and one drop for higher quality modes. This phenomenon is shown both in Figure 5 and Figure 6. In addition, some Canon ink jets (i, iP and iX series) employed another strategy, which selects smaller nozzles of their multi-nozzle print heads to eject secondlevel drops in high-quality photo modes.
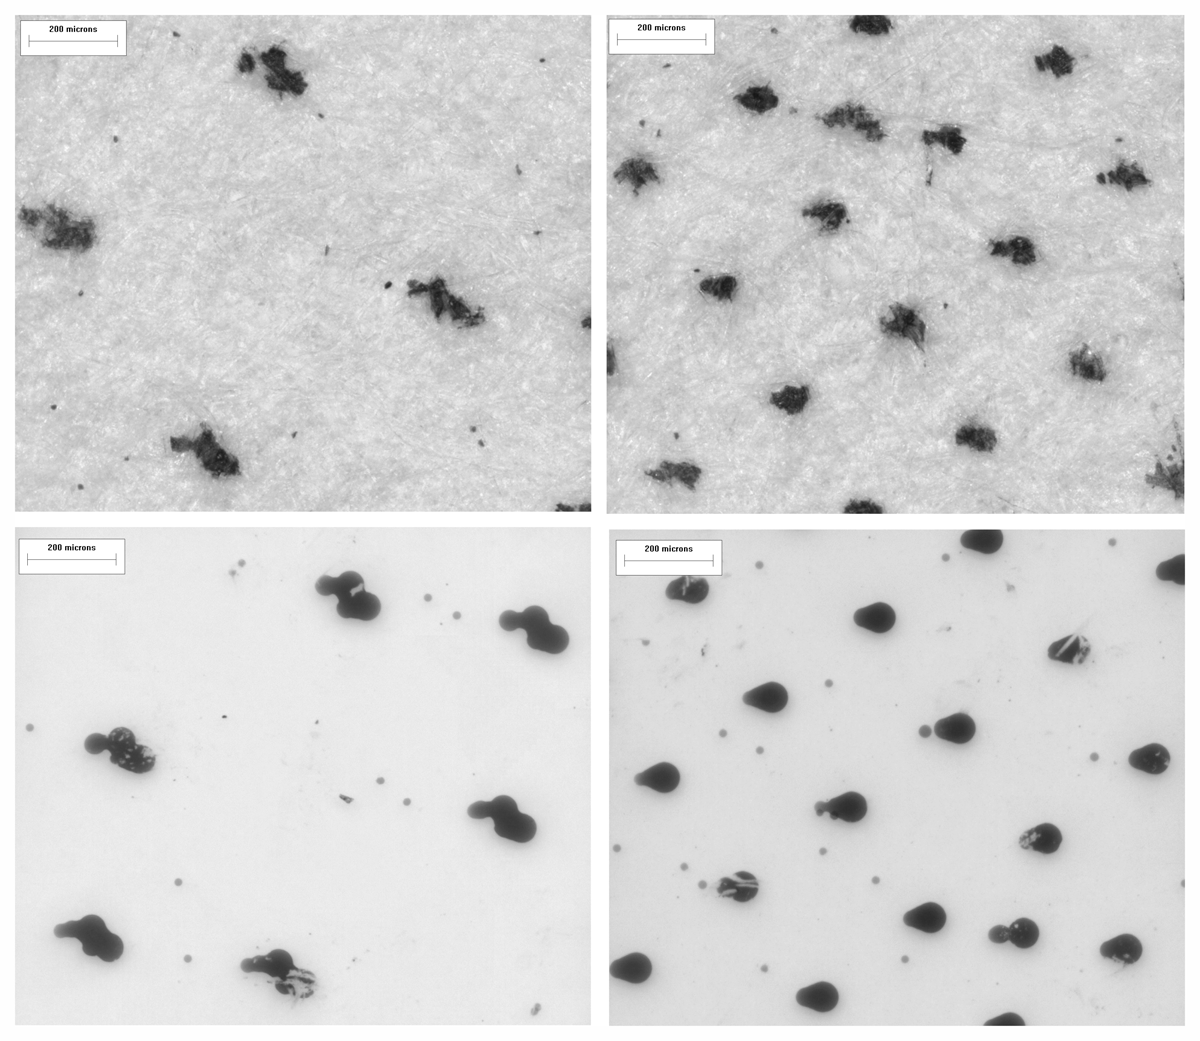
Figure 5
Halftone dots produced in draft (left) and standard (right) modes by a Canon iP2680 (The upper pictures were on plain paper, the lower were on photo paper).
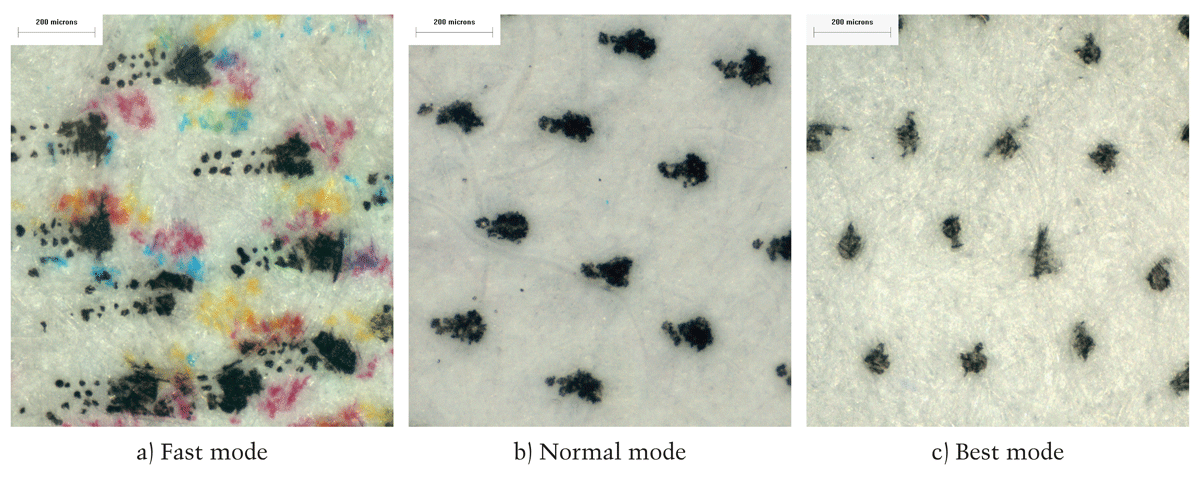
Figure 6
The comparison of satellites and halftone dots produced in different modes by an HP DJ D4168 device.
Print Mode and Satellite Droplet
The author has addressed satellites as an unstable but valuable feature in another paper (Liu, 2011). One of the values or examining satellite formation is restated here. The satellites were found changeable in the selected print modes, which are mainly manifested in two aspects:
1. Satellites and the Speed of Print Head
Under a microscope, the evidence of the changes of satellites in different print modes was observed. Some printers, such as the majority of the tested HP devices, produced satellites with different tail lengths (see Fig. 6), while others produced satellites with the same tail length in almost every print mode. To explain these phenomena, supplemental experiments were conducted to measure the speeds of pen movement in several print modes, by recording print head movements on videos and then analyzing their timing. It was shown that the pen speeds in photo quality modes were lower than that in fast mode and normal mode for some of the tested printers. For xample, the HP Office 5608 print head scanned across the whole width of paper in about 0.31 second in normal mode, versus approximately 0.47 second in photo mode.
2. The Distribution of Satellites and One-Pass or Multiple-Pass Mode
The experiments proved that bidirectional printers produce, in a swath of printed area, satellite tails pointing in the same direction in one-pass mode, whereas satellites are deposited on both sides and point to both the left and right directions in multiple-pass modes. These can be easily found in light-colored images, and the edges of images and characters under a microscope (see Fig. 7). However, the unidirectional printing generates satellites located on only one side of the primary dots throughout the whole printed area. Old inkjet printers, for example Canon BJC 255/265, applied unidirectional printing in every print mode. Some new inkjets models in their Photo/Best modes also employ unidirectional printing; as a result, the same phenomenon was observed.
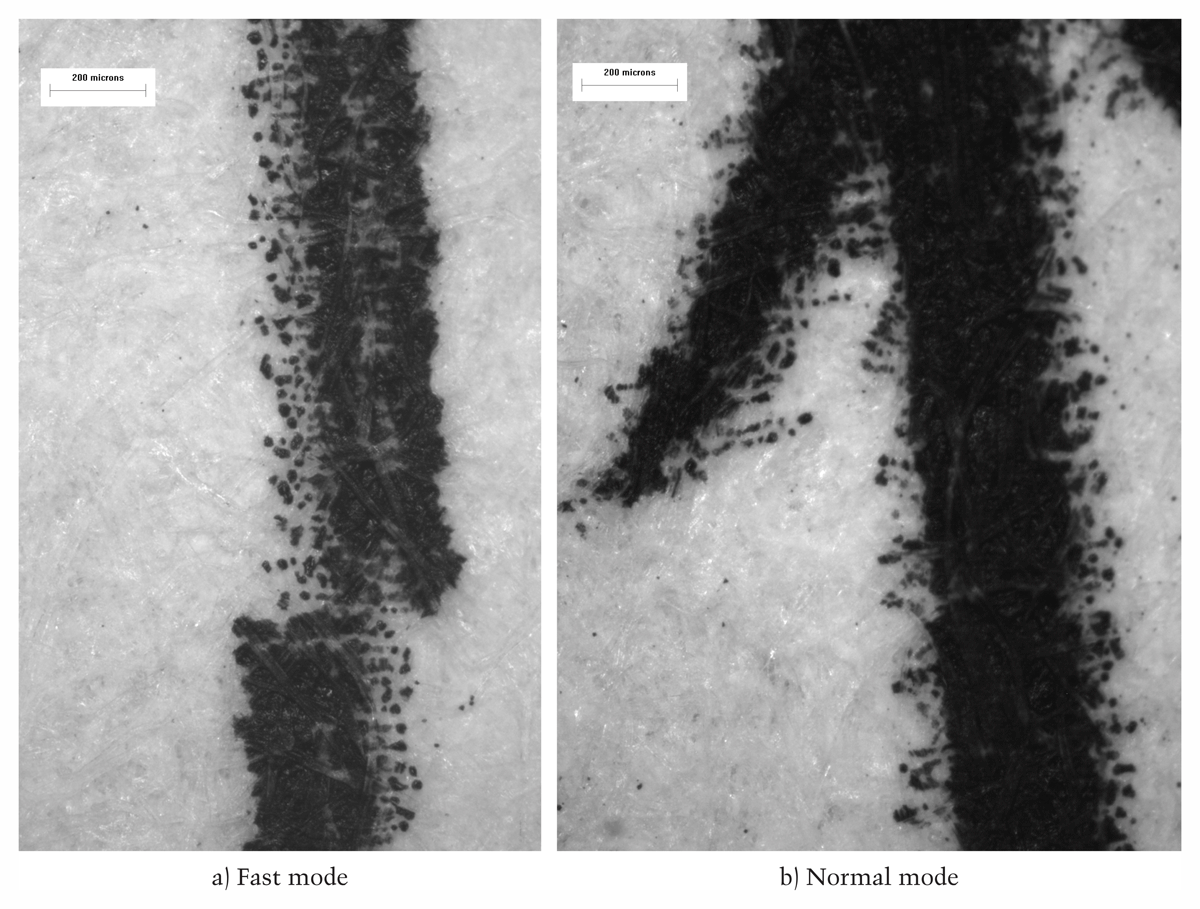
Figure 7
The distribution of satellites in texts produced by an HP DJ D4168 printer in different modes.
Print Mode and Color Configuration
Color configuration manifested in print also revealed differences as the print modes changed. For instance, to print black text, most tested devices sprayed only black ink in plain-paper mode; whereas, in photo-paper mode, they ejected black and color inks, or more often, three primary color inks (synthesize the “composite black”) instead of black ink (see Fig. 8). Unlike most other models, some HP ink jets, such as HP Deskjet 930c/1120c/1125c, sprayed black ink and three color inks to form black text when under the default configuration in plain-paper & normal mode. This could be the signature of the HP devices with the same color configuration, which was rare among the tested models. Equipped with six ink cartridges, Canon photo ink jets used photo cyan ink and photo magenta ink only for their photo modes. By contrast, Epson photo inkjets were found to eject all six inks in every print mode. As other features contributing to print mode determination, the evidence of color configuration is useful for inkjet classification.
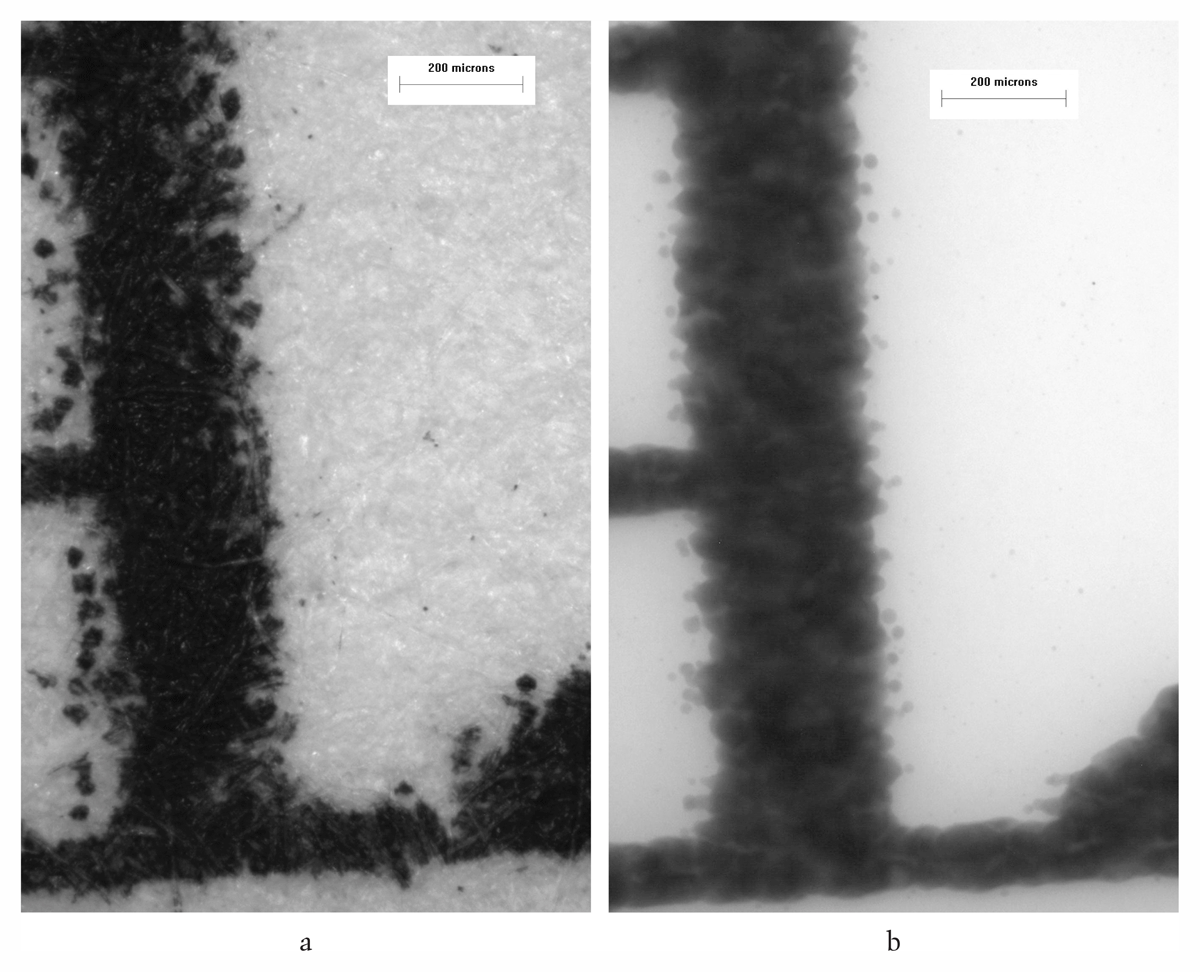
Figure 8
The ink marks of the same black character printed by a Canon MX 338 in different print modes: a) plain-paper/standard mode; and b) photo-paper/photo mode.
Conclusion
Every printout contains features that are affected as print modes change. Apart from the ink absorption of the paper, the variety of print modes caused obvious variation of the features. However, the laws that govern this variation can be understood and followed. Print parameters which are fixed in a configuration result in a set of features that make up an identifiable pattern, which is unique for classification.
In view of the findings from this study, the print mode determination should play an essential role for identification of inkjet printers. Firstly, starting with print mode determination, which can link the various and disordered features into one system, document examiners can avoid the chaos in analyzing inkjet printouts. By adhering to assessing the print mode in the whole process of the examination, the reliability of the result will be improved if there are no conflicts among the features in terms of print mode. Secondly, only a combination of the features under a print mode (rather than a few discrete features) can represent a particular class of printers, except for a small number of features which are produced by the unique patented technologies. Therefore, print mode determination could contribute to the reliable and efficient classification of inkjet printers. Additionally, in order to relate a disputed document to a suspected inkjet, before the comparison, a document examiner needs to know the print mode used to produce the questioned document and then obtain the samples of the suspected device in the same print mode.
A printed document with multicolor images, graphics, and text would be preferable for this type of analysis, because the aforementioned features will be sufficient for the examination. If the documents are black text based or with only solid images and graphics (100% gray level), some of these features will not be discerned; however, the satellites, increment of paper feed stepping, color configuration, and spatial resolution, if they are available, may still provide enough evidence for print mode determination and even for ascertaining the makes of inkjet printers involved.
With the progress of the technology, some dynamic print modes might be developed to control multiple qualities and speeds of printing on one output. That is, the features on one printed page might reflect more than one print mode for different objects. However, this might simply raise the uniqueness level of the type or the device which applies this kind of application. This would also be revealed by assessing print mode.
This paper explores the usefulness of print mode determination in the forensic analysis of inkjet print features. The research was preliminary and some limitations are known. Due to the limited resources and time, this research did not conduct the sampling of inkjets from manufacturers other than Canon, HP, and Epson. Only the commonly used print modes were investigated. Moreover, other versions of Microsoft Office or software from Adobe Systems were not thoroughly experimented with in this study. More and further research is necessary in order to guide the utilization of the features and the standardization of the procedure in the classification of inkjet printers.
Notes
[1] *This research was funded by the Public Security Department of Jiangsu Province (No. 06SGJ-26) and by the Special Fund for the Key Discipline Construction Program of Jiangsu Higher Education Institutions.
[2] Preliminary experiments conducted by the author proved that the features discussed in this study are produced by the hardware and software within inkjet printers. There was no evidence showing the variations of these features when connected to different types of computer with the operating systems of Windows 2000, XP, Vista, and Windows 7. Technically, these features are formed when/after a raster image processor (RIP) has interpreted the data file (digital description of the full printed page, including image, graphics, text, and multicolor data) sent from a computer into a raster image, and then output by a printer (Kipphan, 2001). Every inkjet printer in homes and offices has a built-in RIP chip. Although it was found that some inkjet printers, such as some Canon devices, output different halftone dot distributions with Adobe Reader® software than those with Microsoft Word® software, the differences are due to variant interpretations of images and graphics – still produced by the RIPs within the inkjet printers. In this study, there were not any RIP hardware or software interfering outside the inkjet printers. Therefore, the operating system or application was not considered as a variable in this study.
Appendices
Appendix 1
The test page in the study, in A4 size, was a composition of text, graphics and images, simulating random content of common print. The images comprised the black patches and color patches, which were both designed in gray scales, including 5%, 10%, 20%, 30%, 40%, 50%, 60%, 70%, 80%, 90%, 100%. Please see the Fig. 9. The graphics consisted of black lines and solid patches of RGB and CYM primaries. The text included Chinese characters and the English alphabet.
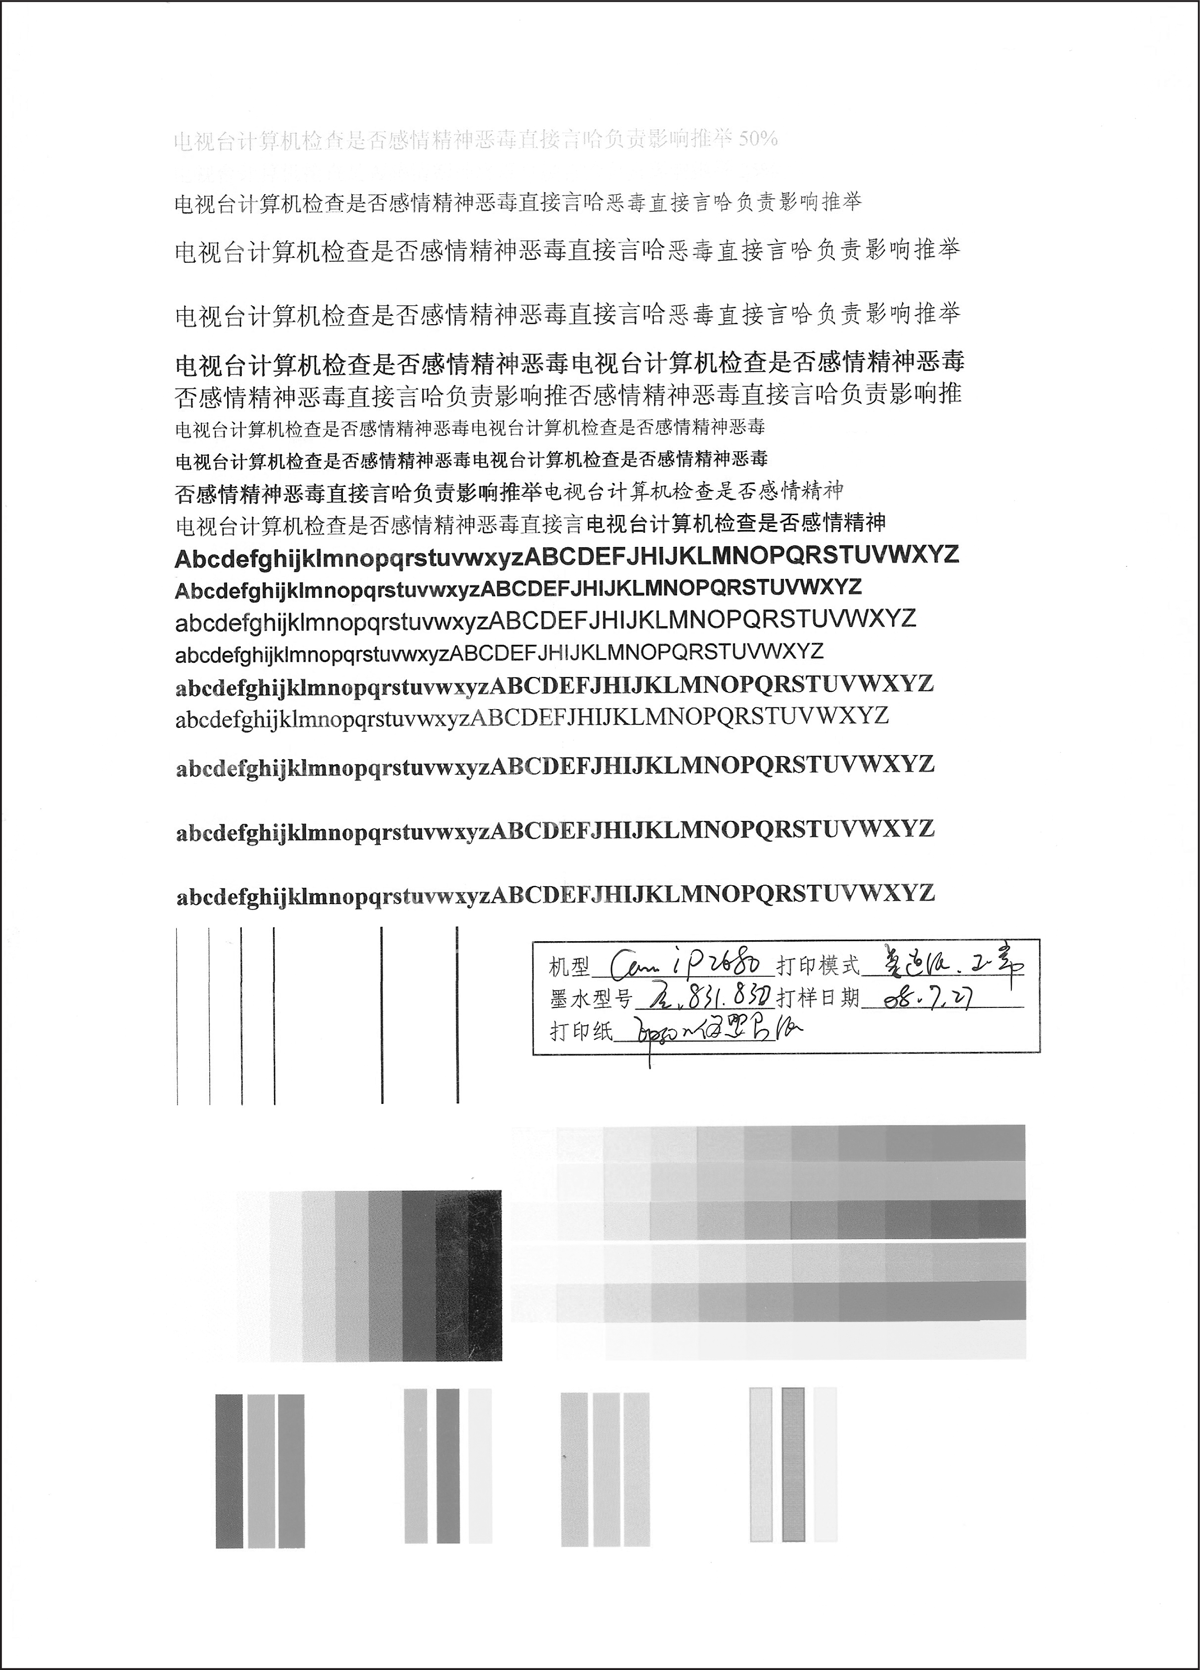
Figure 9
A page of standard sample in the study.
Acknowledgements
The author gratefully acknowledges Lei Pei (Institute of Forensic Science, Nanjing Municipal Security Bureau, China) for her continued encouragement and offering the experimental instruments. The author also wishes to extend sincere thanks to the members of her research team for their efforts of sample collection for this paper.