
Introduction
Product information is increasingly available in digital form. Digital Product Passports (DPPs), established under the Ecodesign for Sustainable Products Regulation (Regulation (EU) 2024/1781 of 13 June 2024), and online labels under the EU Energy Labelling (Regulation (EU) 2017/1369 of 4 July 2017) are being introduced not only in the EU but in similar form also in other regions worldwide. For instance, the EnergyGuide label in USA must be shown in online retail since 2014 (American Federal Trade Commission 2013). In parallel, energy performance product registries such as EPREL (short for European Product Registry for Energy Labelling) in the EU, ENERGY STAR Certified Products Database in the USA and Canada, and Energy Rating in Australia already provide application programming interfaces (API) that can be directly used by software developers (EPREL 2026; ENERGY STAR 2026; Energy Rating 2026). These developments enable online stores and direct-to-consumer brands to implement new tools and user experience (UX) patterns along the customer journey, from information search and product comparison to purchase decision, use and loyalty. Research on digital choice architecture shows that such interventions – including framing, salience, and social norm cues – can significantly influence consumer decisions and promote more sustainable purchasing behaviour (Demarque et al. 2015; Mertens et al. 2022). Evidence from product choice contexts further indicates that simplified and well-integrated information can shift preferences towards more environmentally favourable options (Vanclay et al. 2011). Such approaches can therefore support energy-efficient purchasing while delivering tangible savings to customers. The impact of digital product information ultimately depends on data quality, its translation into user-centered choice architecture, and the incentives for retailers to implement these solutions.
What is user experience (UX) design?
User experience (UX) design focuses on shaping how people interact with products and services to achieve meaningful outcomes. While user interface (UI) design makes information and features visually accessible and attractive, UX design precedes this layer: it defines not how the interface looks, but the quality and structure of the experience itself. In the context of this project, UX design structures and supports the user’s decision-making process. Figure 1 illustrates an example of such a UX design pattern. Notably, one design pattern is already mandatory in EU online retail: The energy efficiency label or arrow must be shown in proximity to the price of the product, and the energy efficiency class must be in a font size equivalent to that of the price. Along the same lines must the EnergyGuide label in USA be clear and conspicuous and in close proximity to the product’s price.
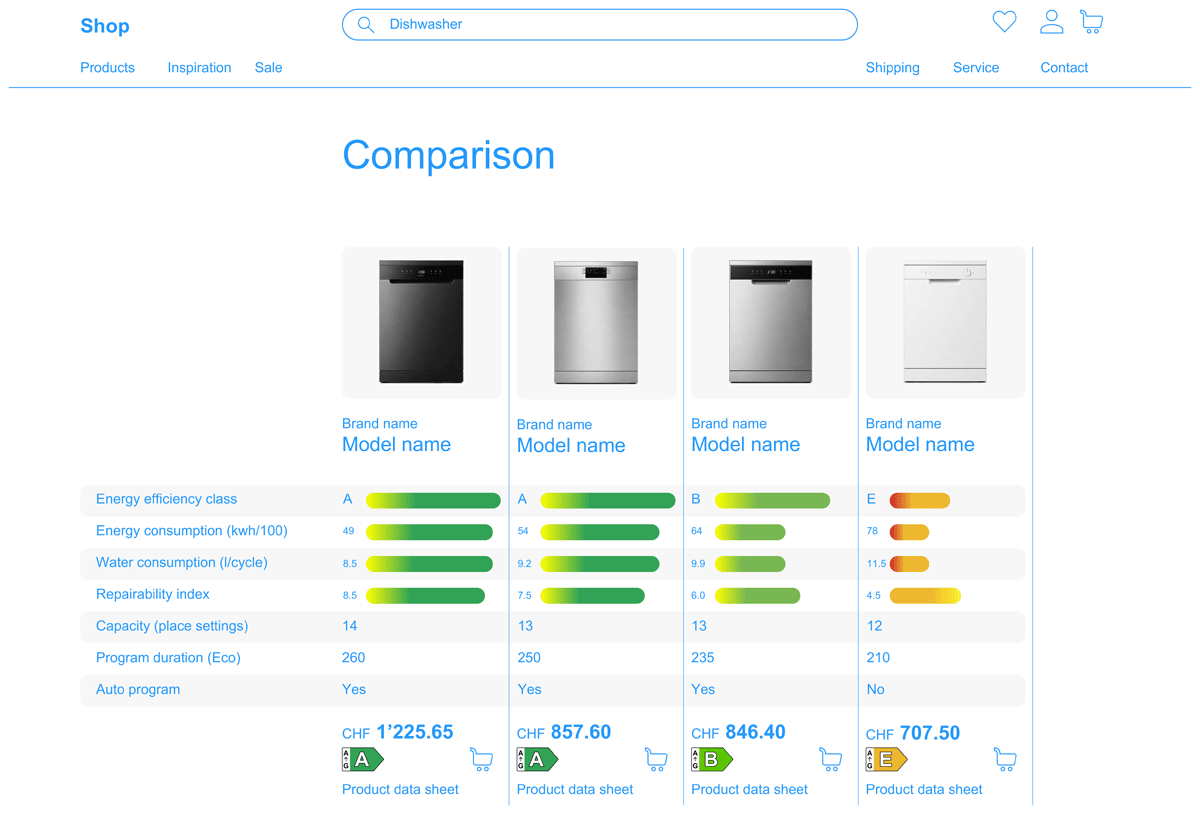
Figure 1
Example of a “green” UX pattern that positions energy and water consumption and repairability at the top of the list in the product comparison. Additionally, colour is used to reinforce the lower consumption and better repairability. This frames these attributes of the product as most relevant and visualizes the best-performing regarding products in a persuasive way.
Note: that this use of colour sits at the threshold between “green” and “dark” patterns. The project and the Circular Experience Library do not endorse dark patterns but seek to highlight that grey areas exist and that designers and retailers need to make conscious, context-specific choices when applying such patterns.
Key instruments include personas and user journeys. Personas are evidence-based archetypes representing user groups, their needs and behaviours, helping to align design decisions with real contexts. User journeys map the sequence of interactions and touchpoints over time, revealing where information and interventions can support decisions.
UX design can have a manipulative character and needs to be used with care. Gray et al. (2018) analysed the phenomenon known as dark patterns: “We use the term dark patterns to define instances where designers use their knowledge of human behavior (e.g., psychology) and the desires of end users to implement deceptive functionality that is not in the user’s best interest”. One example is price comparison prevention: “The retailer makes it hard for you to compare the price of an item with another item, so you cannot make an informed decision.” Another example is (fake) alerts like “only 2 items left” or “10% off if you order today” that pressure to purchase immediately.
Market participants are making efforts to counteract manipulation and ensure good practice in UX design. One example is the standard ISO 9241-210:2019 – Ergonomics of human-system interaction – Part 210: Human-centred design for interactive systems. The requirements and recommendations in this standard are intended to improve human well-being and counteract possible adverse effects.
Importance of online shopping and online energy information
In the European consumer electronics market, the online share has quickly grown and is now expected to account for more than half of the total market value (offline and online). Of all online retail sales, consumer electronics are the second-largest market with a share of 13%, behind the fashion sector with 15.5% (Pleuni 2025). The growing importance of online product information is also reflected in a recent call for evidence by the European Commission (2026) regarding omnibus simplification of energy-efficient product legislation: “With the European Product Registry for Energy Labelling (EPREL) database offering digital possibilities that were not anticipated at the time, it seems opportune to revisit the interplay between obligations asking for printed documents and digital formats.” APPLiA, the trade association of home appliance manufacturers in Europe, goes as far as questioning the usefulness of physical energy labels printed on paper altogether. With the intention to reduce costs for manufacturers as well as paper waste, they propose abolishing the requirement for printed energy labels in favour of digital energy labels (APPLiA 2025).
Structure of the paper
This paper brings together findings from two independent projects: one on what consumers look for and which information sources they actually use, and one on how energy efficiency can be presented in online retail through UX design. It explores the following questions with a practical view for implementation:
What information do consumers look for when buying household appliances, heating systems and consumer electronics, and which online sources do they consult?
What can UX designers do along different steps of the customer journey to support energy-efficient purchasing?
How willing are manufacturers and retailers to implement such UX patterns? Would they use specific patterns under certain conditions? Which patterns are attractive to them, which ones not?
In the first part of the paper, we present survey results from the ‘EPREL Services’ project, funded by the LIFE programme of the European Union, which aims to develop EPREL-related tools and services for multiple target groups, including online retail.
In the second part, we present findings from a UX design project ‘Energieeffizienz im Warenkorb’ (in English: energy efficiency in the shopping cart) in Switzerland that developed design patterns enabling online retailers and brands to make energy information visible, comprehensible, and actionable for consumers – delivering more value than merely meeting minimum regulatory display requirements.
In the third part, we make final considerations about services, guidelines or regulations that could increase the impact of digital product information. The recommendations presented there should be read as informed proposals for policy discussion rather than as conclusions derived solely from the presented empirical evidence. The two projects were developed independently, and the connections drawn in this paper between survey findings and design patterns are retrospective rather than the result of an integrated research design.
The fourth part is the conclusion of this paper, in which we summarise the presented results and our thoughts briefly.
Improving access to energy performance data for consumers and businesses in Europe
The EPREL Services Project (www.eprel-services.info) is working to transform how individual consumers and professional stakeholders access energy performance data for products across Europe. Building on the European Product Database for Energy Labelling (EPREL), the project is developing new tools to improve data access, ensure data quality, and promote sustainable purchasing decisions.
EPREL, a database where all products with an energy label on the EU market have to be registered, gives consumers a single EU-wide online source where they can quickly search, filter and compare energy-labelled products – and obtain product information that includes the efficiency ratings, technical details and product data on energy, water consumption and other performance characteristics (depending on product category).
The EPREL Services Project, co-funded by the European Union under LIFE Programme, aims to significantly enhance the impact of EPREL database by:
Developing a new modular web application tailored to the needs of consumers, procurers, retailers, and policymakers.
Ensuring data quality through technical software tools and monitoring processes, in collaboration with suppliers.
Raising awareness of EPREL and new tools among stakeholders.
Improving existing product information platforms by adding EPREL data and facilitating direct links.
Promoting broad adoption through tailored communication and dissemination strategies.
Here, we present findings from a consumer survey that was conducted in the beginning of the project (November 2024–January 2025) to gain insight into the aspects that are most important to consumers when they search for products – in order to develop a web app that would help them to identify and select products with better efficiency parameters than they would normally do. The goal of the survey was to search for what exactly consumers look for when searching for a new product and what role energy efficiency related parameters have in such searches.
Method
A consumer survey of more than 2,500 consumers across 10 EU countries was conducted between November 2024 and January 2025.
The survey was organised in an electronic format, using a survey platform localised for respective EU member states – inviting consumers to reply through social media, general press, through membership platforms, etc. – ensuring a range of respondents, broadly aligning with the EU population in terms of age, sex, income, etc. (Figure 2).
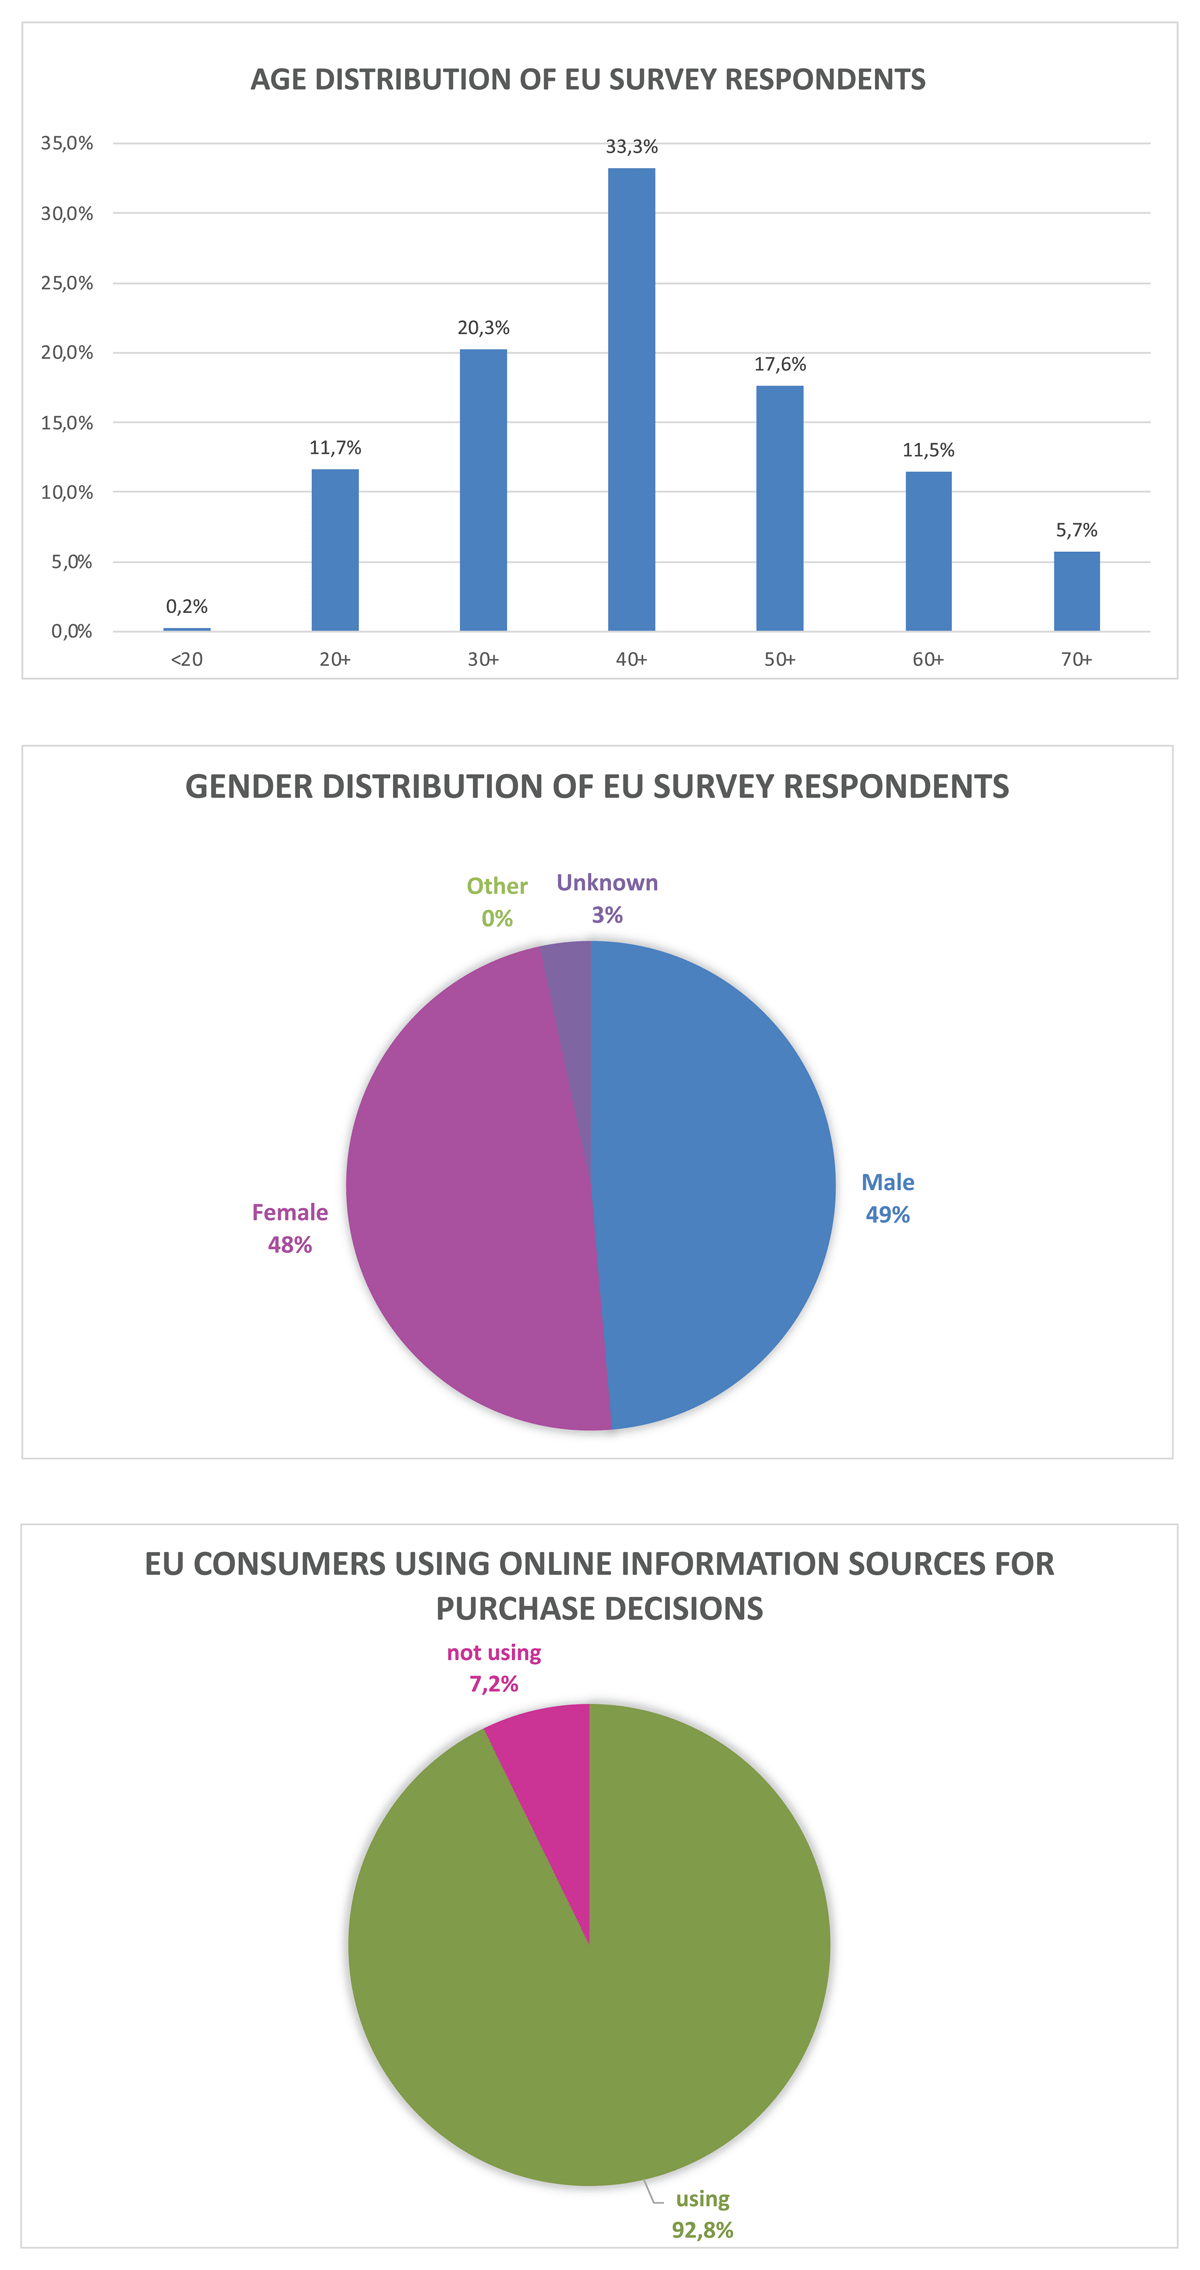
Figure 2
Overview of the type of consumers who provided the input into the survey by their age and gender and the share of those using online information sources for purchasing decisions.
Communication channels included individual emails – consumers subscribed to newsletters, individual consumer advisories, information on consumer webinars – attendees were encouraged to complete the survey during the session, individual in-store surveys, incentives, social media & websites, etc.
Focus countries included Austria, Belgium, Czechia, Denmark, France, Greece, Italy, Poland, Portugal, and Spain.
Respondents provided detailed information about their purchasing habits, history of appliance purchases, and factors that motivate them to change their purchasing decisions when choosing a specific model. The rationale was to obtain as practical information as possible about the purchasing factors and tools in order to be able to design a webapp that would assist and motivate consumers to identify more energy efficient products on the market. The survey evaluated not only parameters related to energy consumption, but also other operating parameters in order to provide a comprehensive picture of the motivating factors in the selection of electrical appliances.
Given the complexity of the survey (motivated by the effort to identify parameters that consumers really look for when considering a purchase of a new products), the time needed to fulfil the survey was the key obstacle to ensure widespread number of replies – as nowadays even spending a few minutes on a survey needs a specific dedication and motivation to do so.
Results
The survey revealed that while over 90% of consumers rely heavily on online information for purchasing decisions, EPREL database as well as QR codes on energy labels, as a form of online source of information available to consumers across the entire EU, remain underutilized.
When using online tools and services for product search and comparison, EU consumers place the greatest importance on completeness of product information and filters, followed by the ability to compare products and sorting by price, various features or the brand.
Regarding how often they consult different information platforms when purchasing products with energy labels, consumers indicated that product review and test platforms and price comparison tools are used most frequently. Customer feedback platforms are consulted less often, while sustainability calculators are the least known.
Cost-related considerations remain the dominant influence on purchasing decisions, with consumers valuing energy efficiency of products, but their relative importance shifts by product category:
For household appliances and heating/air-conditioning systems energy consumption and efficiency is the single most influential criterion, along with purchase price, total cost of ownership, and running costs.
In consumer electronics the up-front purchase price stands out as the decisive factor, while energy consumption and running costs play a smaller role.
The consumers have also indicated the relative importance of various factors when using online tools and services for product search and comparison on a scale from 0 (not important) to 3 (very important). When EU consumers use online tools for product searches, they prioritize completeness of product information and filters (2.6), followed by possibility to compare products and sorting by brand, price and features (2.5), see Figure 3.
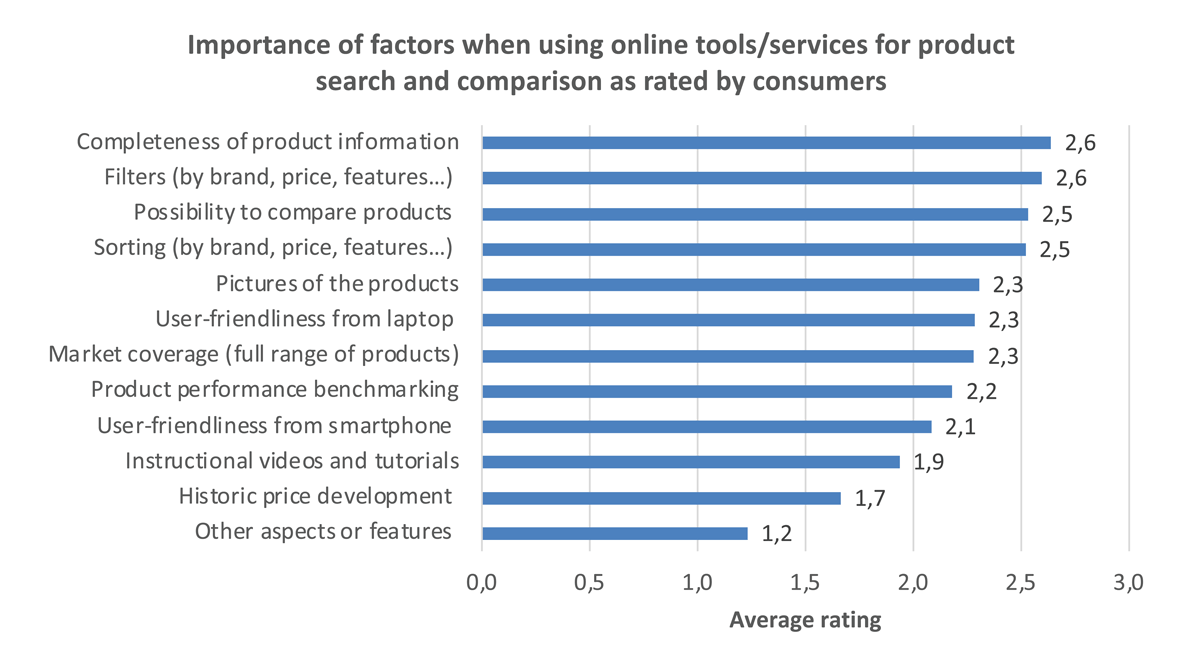
Figure 3
The most important aspects when using online tools for product search and comparison – aggregated consumer ratings.
Consumers have rated the frequency of using information platforms when purchasing products with energy labels on a scale from 0 to 3, with higher values indicating more frequent use. As shown in Figure 4, product review and test platforms, along with price comparison tools, are the most frequently consulted (2.2). Customer feedback platforms are used less often (1.9), and energy and sustainability calculators (1.4) are the least popular tools.
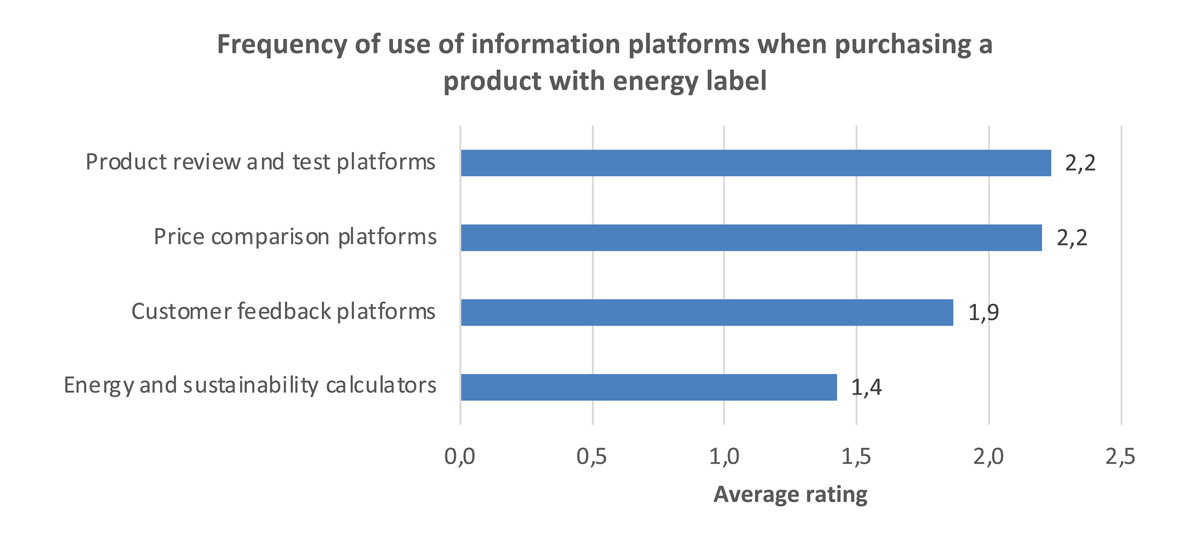
Figure 4
Frequency of use of information platforms as declared by consumers when purchasing products with energy labels – aggregated consumer ratings.
Warranty consistently ranks near the top across all product categories, reflecting consumer focus on product durability. Other factors rated at least moderately important across categories include quality of repair services, consumer and expert reviews, spare parts availability, pollutant emissions, brand, delivery times and availability, manuals and installation requirements.
Survey results confirmed strong consumer interest in energy efficiency parameters across household product categories (see charts below). This likely reflects both the long-term communication efforts to promote energy labels and efficient products, and the recent energy crisis in the EU with its associated rise in energy prices and public attention to energy costs. These findings are consistent with broader European evidence: Eurobarometer surveys found that 93% of EU citizens recognise the energy label and approximately 79% report that it influenced their purchasing decisions (European Commission 2024). Given this, the survey confirmed that consumers actively seek to identify and prioritise energy-efficient products, particularly for household appliances and heating systems where running costs are most tangible.
Consumer feedback additionally pointed to key priorities for EPREL’s future development:
Increasing awareness and visibility of EPREL resources.
Improving the clarity and accessibility of technical information.
Accelerating and refining search and filtering capabilities.
EPREL Services aggregated consumer surveys’ results
The following figures show the average assigned values for importance rated on a scale from 0 to 3, with higher values representing greater importance. Answer possibilities for all questions were given as options from O (not at all important or never) to 3 (very important or always).
The aggregated scores rank the factors by their influence on consumer choices, with most rated as at least moderately important. Consumers prioritize different factors depending on the type of product; however, cost-related factors play a key role across all product categories.
For household appliances (refrigerators, dishwashers, washing machines), consumers focus primarily on cost-related and efficiency-related factors (Figure 5). Energy consumption and efficiency (2.60), total costs including purchase and running costs (2.58), purchase price (2.57), and running costs (2.51) are most influential. Warranty (2.45), noise during operation (2.40), and quality of repair and maintenance services (2.33) are also important.
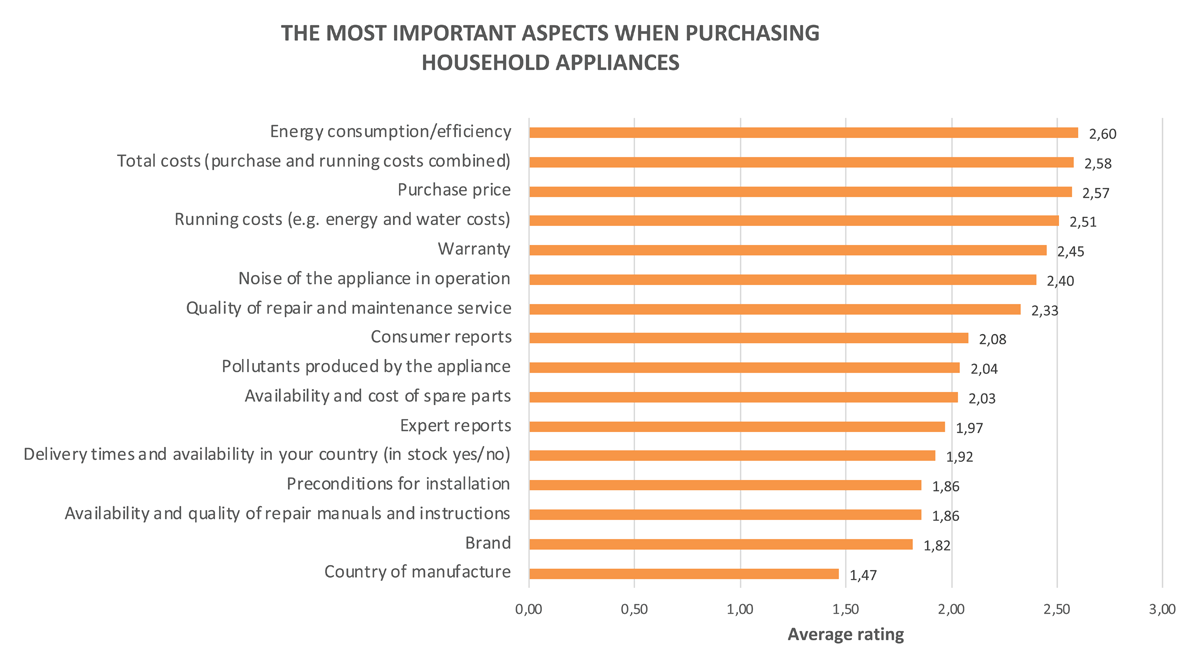
Figure 5
The most important aspects when purchasing household appliances – aggregated consumer ratings.
In the case of heating and air conditioning systems, cost-related criteria are even more dominant, as shown in Figure 6. Energy consumption and efficiency (2.74), running costs (2.69), and total costs combining purchase and running expenses (2.68) are clearly the leading factors. Purchase price (2.57) and warranty (2.56) remain highly influential, followed by noise during operation (2.51) and the quality of repair and maintenance services (2.48).
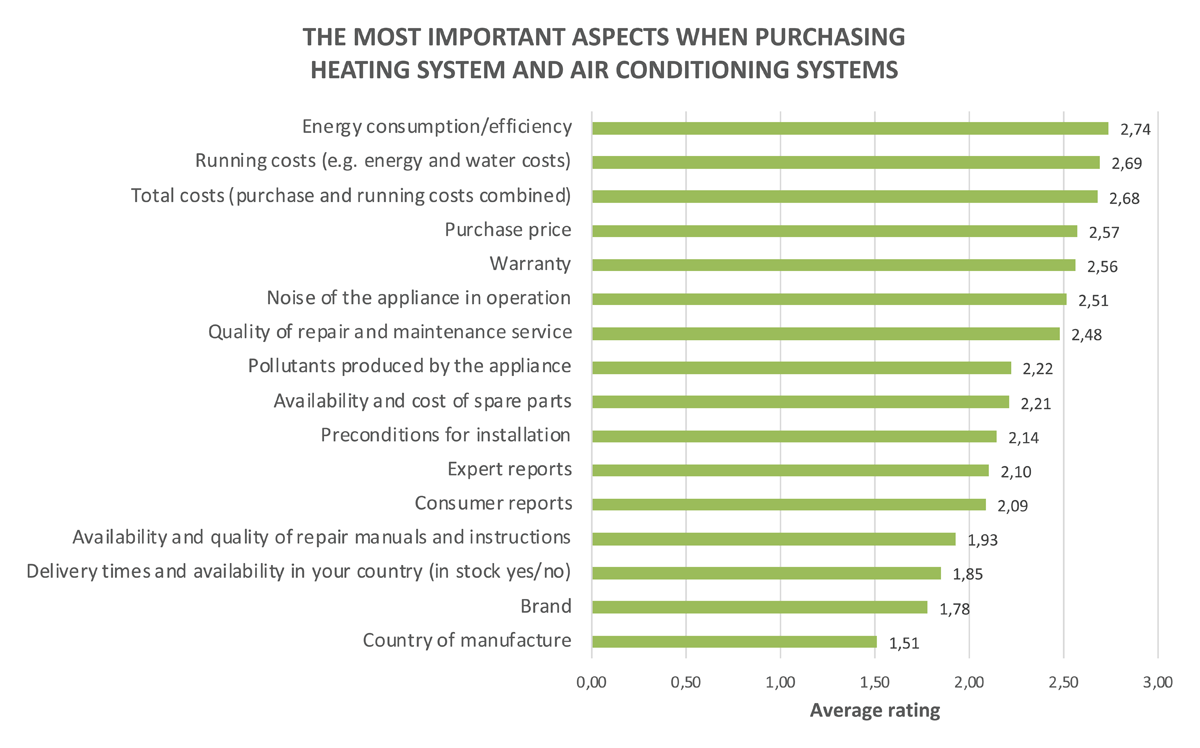
Figure 6
The most important aspects when purchasing a heating system and air conditioning – aggregated consumer ratings.
For consumer electronics (TVs, PCs, smartphones), the purchase price (2.54) and warranty (2.35) emerge as the most decisive factors (Figure 7). These are followed by total costs including purchase and running expenses (2.20), the quality of repair and maintenance services (2.15), consumer-report ratings (2.11) and brand reputation (2.07). Energy consumption and efficiency and expert reports (both 1.98) are of moderate importance, with energy efficiency being notably less significant here compared to household appliances and heating and air-conditioning systems.
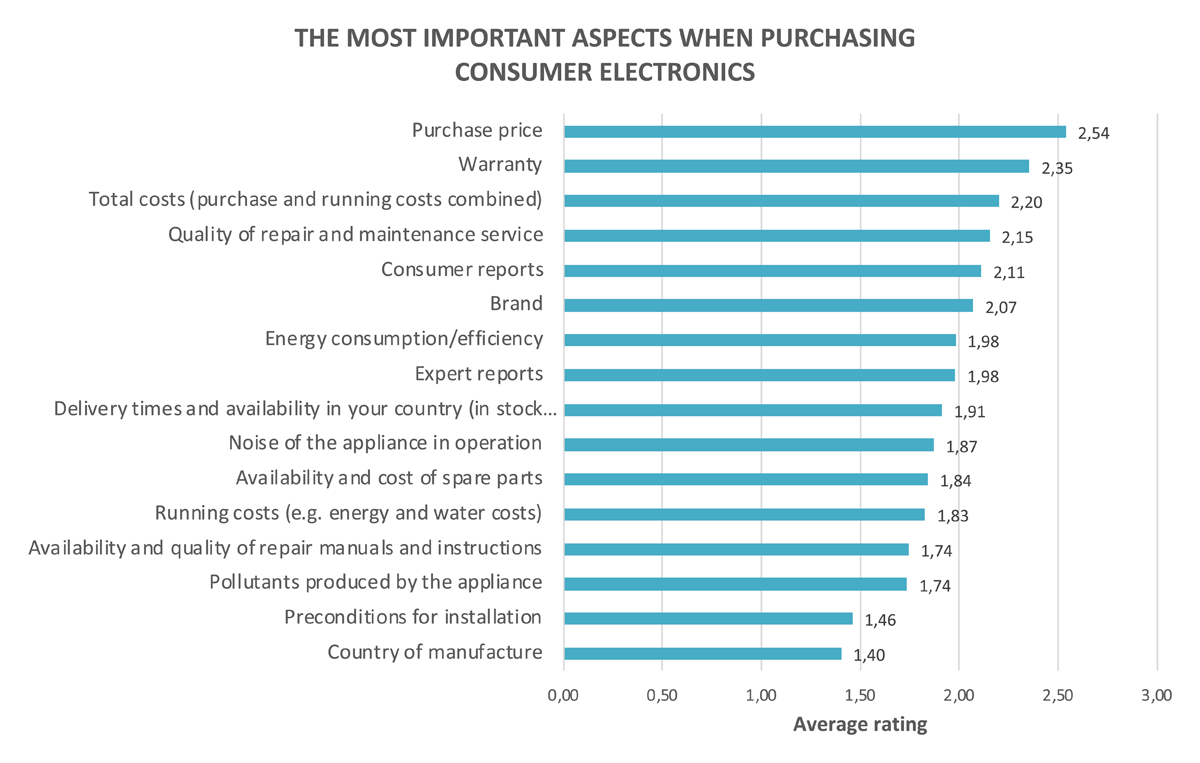
Figure 7
The most important aspects when purchasing consumer electronics – aggregated consumer ratings.
The survey also highlights the low utilization of QR codes on energy labels, with most consumers either unaware of their existence or currently not interested in using them (Figure 8). The majority of respondents (51.4%) reported that they had never noticed a QR code, indicating a general lack of awareness. 30.2% had seen the QR code but did not use it, suggesting limited interest despite its visibility. Only 6.3% scanned the QR code and accessed EPREL, thus, actual utilization of the database via the QR code is low. Additionally, 5.9% noticed the QR code but did not use it, although they were familiar with the EPREL database, while 4.6% had not noticed the QR code but were still aware of the database. Lastly, 1.7% of respondents did not provide an answer.
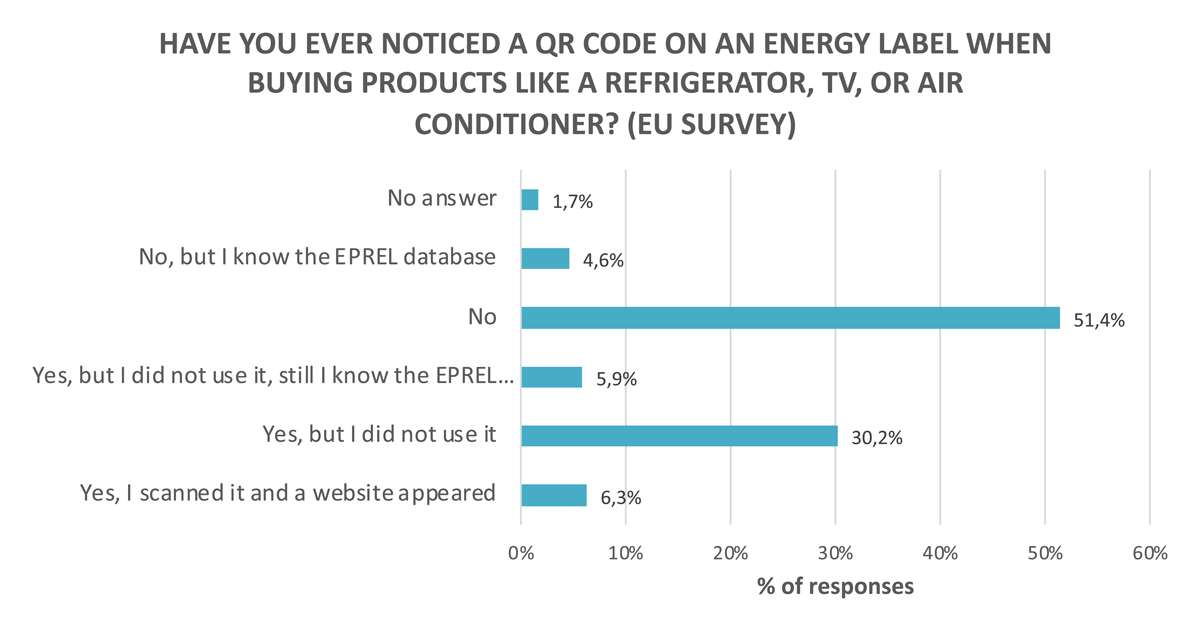
Figure 8
Awareness of consumers about the QR code on energy labels.
As the survey confirmed, cost-related considerations remain the dominant influence on purchase decisions, but with relative importance shifts by product category:
For household appliances and for heating or air-conditioning systems, energy consumption and efficiency are the single most influential criterion. Together with purchase price, total cost of ownership, and running costs, all cost-related factors fill the top four positions.
In consumer electronics, however, the purchase price stands out as the decisive factor, while running costs such as energy use have a much lower ranking in the priority list.
In addition, warranty consistently ranks near the top across categories. It is the second-most important factor for consumer electronics, only marginally behind purchase price, and it still features prominently for household appliances as well as for heating and air-conditioning systems.
Discussion
The consumer survey achieved a substantial sample of more than 2,500 respondents across ten EU countries. However, recruitment relied on self-selection through social media, press coverage and membership platforms rather than stratified probability sampling. As a result, participants may hold stronger-than-average attitudes towards energy efficiency, implying that the reported importance ratings could overestimate the weight these factors carry within the general consumer population. In addition, the survey captures stated preferences only, which are known to diverge from actual purchasing behaviour in real-world contexts.
Despite these limitations, the survey findings highlight a persistent gap between consumers’ expressed interest in energy-efficiency information and the tools currently available to translate this interest into effective purchasing decisions. While consumers value energy performance, operating costs and durability, existing digital product information environments often fail to make these factors sufficiently visible, comparable or actionable.
In response, the EPREL Services project is developing an integrated web application that links EPREL product data with market, cost and availability information to better support energy-efficient decision-making, complemented by automated and participatory mechanisms to systematically improve data quality in the EPREL database.
Taken together, these insights point to deficiencies not only in general awareness, but also in the online presentation and structuring of product information relative to consumer needs and expectations. The following section therefore presents how to address this gap through concrete UX design patterns for presenting digital product information more effectively in e-commerce environments, with the aim of encouraging energy-efficient consumer behaviour.
Encouraging energy-efficient consumer behaviour in online retail
Leveraging digitalisation, how can online retailers make energy-efficiency information visible, understandable and behaviourally effective along the shopping journey: from need recognition to post purchase and use phase? To investigate this question, a user experience (UX) design project was conceived for Switzerland and carried out between October 2025 and May 2026, under the name ‘Energieeffizienz im Warenkorb’ (in English: energy efficiency in the shopping cart). The customer journey was considered broadly, from recognition of need through to the post-purchase usage phase.
Aim and deliverables of the project
By equipping UX designers and e-commerce decision-makers with practical, modular UX patterns, the project aims to shift purchase decisions beyond price toward durable, efficient products – or at least contribute a small part to this larger goal. The project created and published a suite of freely usable UX design patterns available at https://www.circular-experience-library.org/energy-efficiency. Each pattern is presented with visual, clickable prototype, PNG/FIGMA download, written user guide and video tutorial. The project included a moderate amount of dissemination to UX design and e-commerce platforms in Switzerland. The patterns are for inspiration, best practice and guidance. As every shop system has its own tech stack and every development team its own workflow and toolchain, they are not available as code that could directly be inserted into online store software. Neither could they be directly placed and offered in vendor ecosystems (e.g. Shopware partners and PrestaShop integrators). Retailers and direct-to-consumer brands must programme the patterns in order to use them.
Method to develop and evaluate the patterns
The following steps were carried out to derive and validate effective UX patterns:
Initial research and proposal of 17 patterns covering a 6-phase customer journey.
Narrowing down from 17 to 11 patterns in a focus group.
Reflection of the 11 patterns in chats with AI-assisted personas based on established consumer segments.
Evaluating the 11 patterns in 1-hour interviews with potential implementers.
Patterns and customer journey
The first step involved initial research to define a typical six-stage user journey. These stages are based on established models of online purchasing behaviour by Philip Kotler and the Nielsen Norman Group. Kotler’s five-step model was extended with a sixth stage to emphasise the importance of the post-purchase experience in supporting the efficient use of products during the use phase (Table 1).
Table 1
Description of the customer journey with six phases used in the project.
| PHASE | EMOTION/MINDSET | TYPICAL QUOTES | PARALLEL ACTIVITIES | TRIGGER FOR NEXT STEP |
|---|---|---|---|---|
| 1. Recognise need | Uncertainty, perception of problem | ‘The old washing machine is making strange noises.’ | Discuss with partner, ask friends, check old bill | Defect or increased energy consumption, change in household |
| 2. Search for products | Curiosity, orientation | ‘I’ll see what models are available.’ | Research in online shops, tests, forums, energy advice | Interesting model found, clear criteria emerge |
| 3. Evaluate & compare | Trust grows, consideration | ‘We read reviews yesterday – the B model sounds good.’ | Read reviews, compare prices, check subsidy programmes | Favourite identified, price/availability is right |
| 4. Purchase | Determination, certainty | ‘I’ll take that model; it has good reviews and also saves electricity.’ | Check delivery conditions, gather final opinions | Sufficient trust, delivery time and price are right |
| 5. Post purchase | Focused, anticipation | ‘Ordered! Delivery is on Wednesday.’ | Tracking, plan installation, dispose of old appliance | Product delivered, commissioning successful |
| 6. Use | Satisfaction, confirmation | ‘Good thing we bought that – it runs quietly and uses less electricity.’ | First use, share experiences, monitor energy consumption | Positive user experience, energy savings visible |
Based on these six stages, patterns were developed to support efficient choices at every step of the journey. Most of the patterns build on established, user-friendly interface components such as filters, but apply them in ways that prioritise products with higher efficiency ratings. In addition, new components were developed, such as a cost-over-time slider, which involves a slightly steeper learning curve but is intended to stimulate innovation in UX design for greener choices.
In some phases, alternative versions of patterns were deliberately developed for later A-B testing, which ultimately resulted in a total of 17 patterns (Table 2).
Table 2
Overview of the 17 proposed patterns and where they act along the customer journey.
| NO. | PATTERN NAME | SHORT DESCRIPTION | JOURNEY |
|---|---|---|---|
| 1 | Pre-anchoring in search engine results | Introduce energy efficiency early via search engine advertisement by a trusted organisation | 1. Recognise need |
| 2 | Efficiency first sorting | Default product sorting by energy efficiency | 2. Search for products |
| 3 | A+B class toggle | Toggle to show only highly efficient products | |
| 4 | Total cost calculator | Make lifetime costs visible and comparable | |
| 5 | City-based challenge | Show personal impact as part of regional savings | |
| 6 | Framing | Design comparisons to favour efficient products, highlight subsidy information | 3. Evaluate & compare |
| 7 | Interactive energy label | Replace static labels with interactive widgets | |
| 8 | Lowest lifetime costs | Highlight products with lowest total lifetime costs | |
| 9 | Reinforce decision with info on savings and durability | Reminder of energy and cost savings, reinforce with extra repairability data | 4. Purchase |
| 10 | Hyperlocal social proof | Nudge via local peer comparisons | |
| 11 | Efficient alternatives | Suggest more efficient options in the cart | |
| 12 | Anti-licensing | Prevent rebound effects after sustainable purchases | 5. Post purchase |
| 13 | Validation | Confirm and validate the user’s good decision | |
| 14 | Onboarding in delivery-phase | Use waiting time to share energy-saving advice | |
| 15 | Sense of impact community | Communicate shared savings during product use | 6. Use |
| 16 | Capsule structure | Expand efficiency mindset across product categories | |
| 17 | Milestone communication | Visualise savings progress via milestones |
In the second step, the 17 patterns were presented to a focus group consisting of nine persons (an e-commerce professional, two energy efficiency consultants and from the Swiss Federal Office of Energy three product policy specialists and three communication specialists.). Every person appointed a maximum of seven green points (yes) and no more than two red points (no) to the patterns. Participants were free to give multiple points for the same pattern if they wanted. For the final choice of patterns to be further developed, at least one pattern was chosen for each of the six phases in the customer journey. The core stages of the journey – information search, evaluation, and purchase decision – are each addressed by two to three patterns, resulting in a total of 11 patterns.
Chats with AI-assisted personas
In the third step, we developed AI-assisted personas representing five consumer segments based on segmentation by the Ellen MacArthur Foundation. The personas are described in Table 3. They were developed using AI based on the sources listed in Table 4.
Table 3
Five AI-assisted personas were developed for evaluating the UX patterns.
 |  |  |  |  |  |
|---|---|---|---|---|---|
| Name | Clara Meier | Marc Schneider | Yasmine Keller | Hans Müller | Elena Gruber |
| Type | Committed Caretaker (15%) | Progressive Purchaser (19%) | Novelty Seeker (23%) | Casual Conscious Consumer (19%) | Savvy Economiser (24%) |
| Age | 52 | 34 | 24 | 45 | 62 |
| Place of residence | Small town in the canton of Aargau | City of Zurich | Lausanne | Suburb of Bern | Canton of St. Gallen (rural area) |
| Household | Married, two adult children (no longer living at home) | Single, shared flat with friends | Single, first job (marketing) | Married, two children (aged 10 and 14) | Widowed, lives alone |
| Income | Upper middle range (~CHF 110,000/year) | Good (~CHF 75,000/year) | Lower middle class (~CHF 50,000/year) | Average income (~CHF 65,000/year) | Fixed (AHV + pension fund) (~CHF 45,000/year) |
| Online purchasing behaviour | Regular but careful; prefers Swiss shops, sustainability of products is important | Frequent, tech-savvy, orders new products, interested in reviews, but not exclusively | Very active – loves new products, gadgets, impulse purchases, strongly influenced by social media | Regular, but primarily purpose-oriented (family, household), not necessarily technology-first | increasingly online (coronavirus trend), but rather price-sensitive, vouchers, comparisons |
| Attitude towards sustainability | Very high – “I want to live as ecologically as possible”, willing to pay more, returns only in exceptional cases | High – pays attention to environmental aspects, but not uncompromisingly; “if it fits and makes sense” | Moderately experimental – interested if trendy; but price and design often more decisive | Conscious, but not radical; “I try, but I don’t want to make every compromise” | Low to moderate – energy and cost savings are key, environmental aspects are secondary |
| Main hurdle | High acquisition costs, complex technology, uncertainty regarding manufacturer’s efficiency claims | Usability (installation, app control), data protection concerns, effort versus benefit | Price, fast-moving innovation (“what will be new next year?”), installation & compatibility | Price premium for top efficiency, lack of time for research, possible overload of information | Complexity of technology, financing, little interest in premium features |
Table 4
Sources given to the AI on the basis of which the five personas were developed.
|
|
|
|
The personas were used as a structured framework to critically reflect each design pattern. This resulted in feedback for every pattern regarding its potential relevance, acceptance, and usability from the perspectives of different user types. For UX designers working with the patterns, these insights provide useful guidance when considering implementation for specific target groups. Proper design processes still require user testing with real customers. However, the upfront assessment provided by AI-assisted personas helps identify high-potential patterns early on, thereby reducing the number of options to evaluate as well as the associated effort and costs.
Interviews with potential implementers
In the fourth and last step, 1-hour interviews were led with five manufacturers, one retailer, one online retail service provider, and one sustainable procurement advisory service. The 11 patterns, in some cases in variations, were presented one by one to the interviewees. Each person was asked if they would a) implement the pattern, b) maybe implement it under certain conditions, or c) not implement it. They were asked to answer speaking for their organisation, and where not possible in their personal view.
Results
Eleven UX patterns as shown in Figure 9 (selected examples) are available for free use under https://www.circular-experience-library.org/energy-efficiency. There is a short video and written explanation for each pattern.
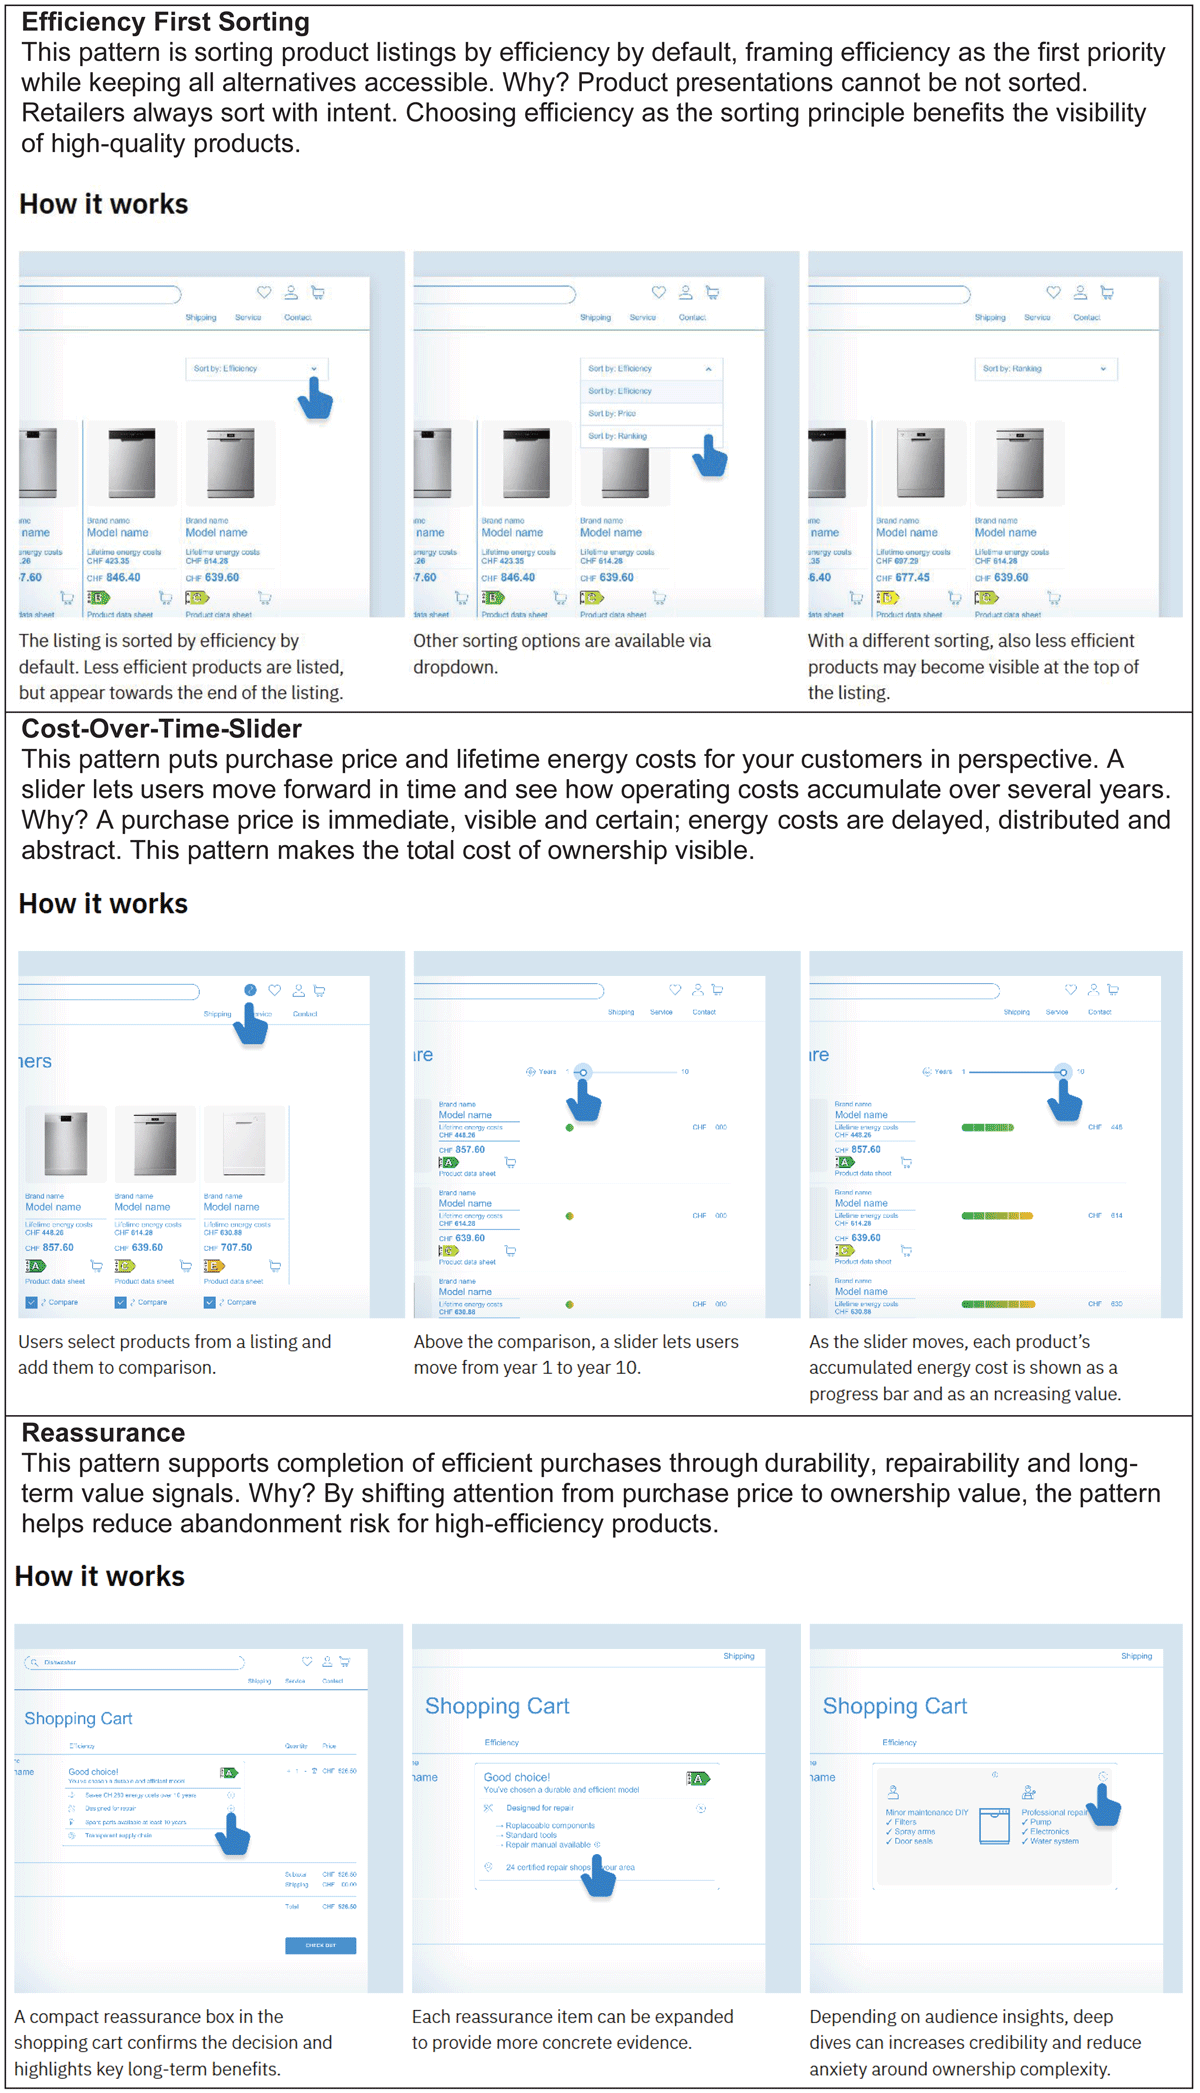
Figure 9
UX patterns to encourage energy-efficient behaviour are available for free use.
The written pattern explanations also show results from the tests with AI-assisted personas (“Persona-Based Evaluation”) and interviews with potential implementers (“Expert Evaluation”). These are meant to help UX designers when they embed the patterns for specific target groups. The endorsement quotes are, of course, also intended to promote the patterns. Figure 10 shows an example for the pattern Efficiency First Sorting.
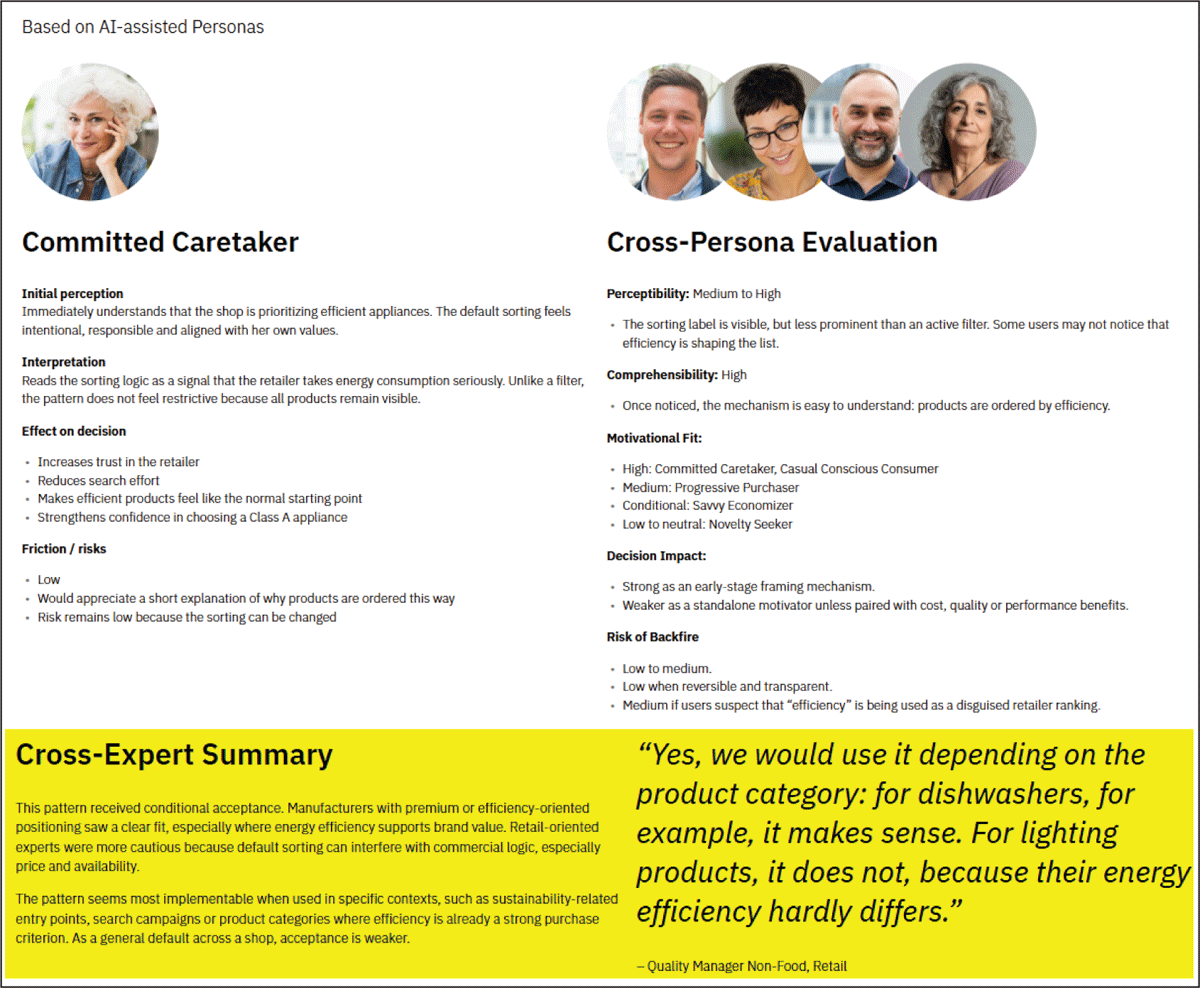
Figure 10
Insights from AI-assisted personas and interviews with potential implementers provide guidance to UX designers. Here, the example for the pattern Efficiency First Sorting is shown.
Discussion
The UX design project is explicitly exploratory, and its primary contribution is generative rather than evaluative. The interview sample is small and asymmetric: five manufacturers and only one retailer and one retail service provider. The use of AI-assisted personas provides a structured framework for testing design decisions, but it generates hypotheses about consumer acceptance rather than empirical evidence. We mean in no way that this method could or should replace testing with humans. Such testing needs to be conducted in the context of real stores, with real products and real content, in order to deliver robust results. The aim of this project is to make this process faster and more cost-effective by offering pre-evaluated patterns as a starting point. Testing user acceptance of the patterns is one side of the equation. Equally important is engaging with online retailers and direct-to-consumer manufacturers, who ultimately decide whether such patterns are implemented. While both actors are primarily driven by sales performance, energy efficiency and durability play a different strategic role within their business models. The interviews helped understand under which conditions specific patterns could support their commercial objectives – and where potential misalignments might occur. For example, for some manufacturers, “energy efficiency” or “durability” are core brand values. Pre-filtering product overviews in their own direct-to-consumer shops according to these criteria helps reinforce and communicate these values. Some manufacturers even expressed the wish that retailers would apply similar principles. Retailers, however, are not primarily in the business of brand communication. This example illustrates that the implementation incentives for energy-efficiency-related UX patterns differ significantly between manufacturers and retailers and must therefore be considered separately. Some patterns favoured by manufacturers may not work for retailers and vice-versa. The project was conducted in the Swiss context, where market structure and consumer expectations may differ from other European/EU countries.
Product information increasingly used by AI agents, not only humans
In the foreseeable future, AI agents will transform the entire online shopping journey – from initial product discovery to final purchase – by acting as autonomous assistants that analyse user needs, research products, compare alternatives, and even complete checkouts without human involvement. AI agents can perform tasks that typically require extensive manual effort. An agent can scan thousands of product reviews, extract key themes, and summarise sentiment – e.g., “Most buyers praise the quiet motor of this vacuum cleaner, but about 15% report issues with durability.” It can also analyse expert reviews, compare technical specs across brands, and highlight trade-offs such as price vs. performance or sustainability vs. delivery speed. Advanced agents can even conduct the purchase autonomously. After receiving approval, an AI agent could place an order in an online store, apply available discount codes, select the best shipping option, and track the delivery. For recurring needs, such as pet food or office supplies, the agent can reorder items automatically as a standing instruction or when inventory runs low. While this is in an early-adopter-state today, in only a few years this may be the normal way to go about online shopping. This has implications on how data and information is structured and embedded. In agentic commerce, influence no longer comes from what users see – but from what systems consider worth explaining. Figure 11 shows a fictional chat between a person and his or her AI agent providing support in product research. For this chat to happen, efficiency data must be machine-readable and contextualised for usage scenarios on the websites of brands and dealers. Policymakers can support this with guidelines and their own procurement.
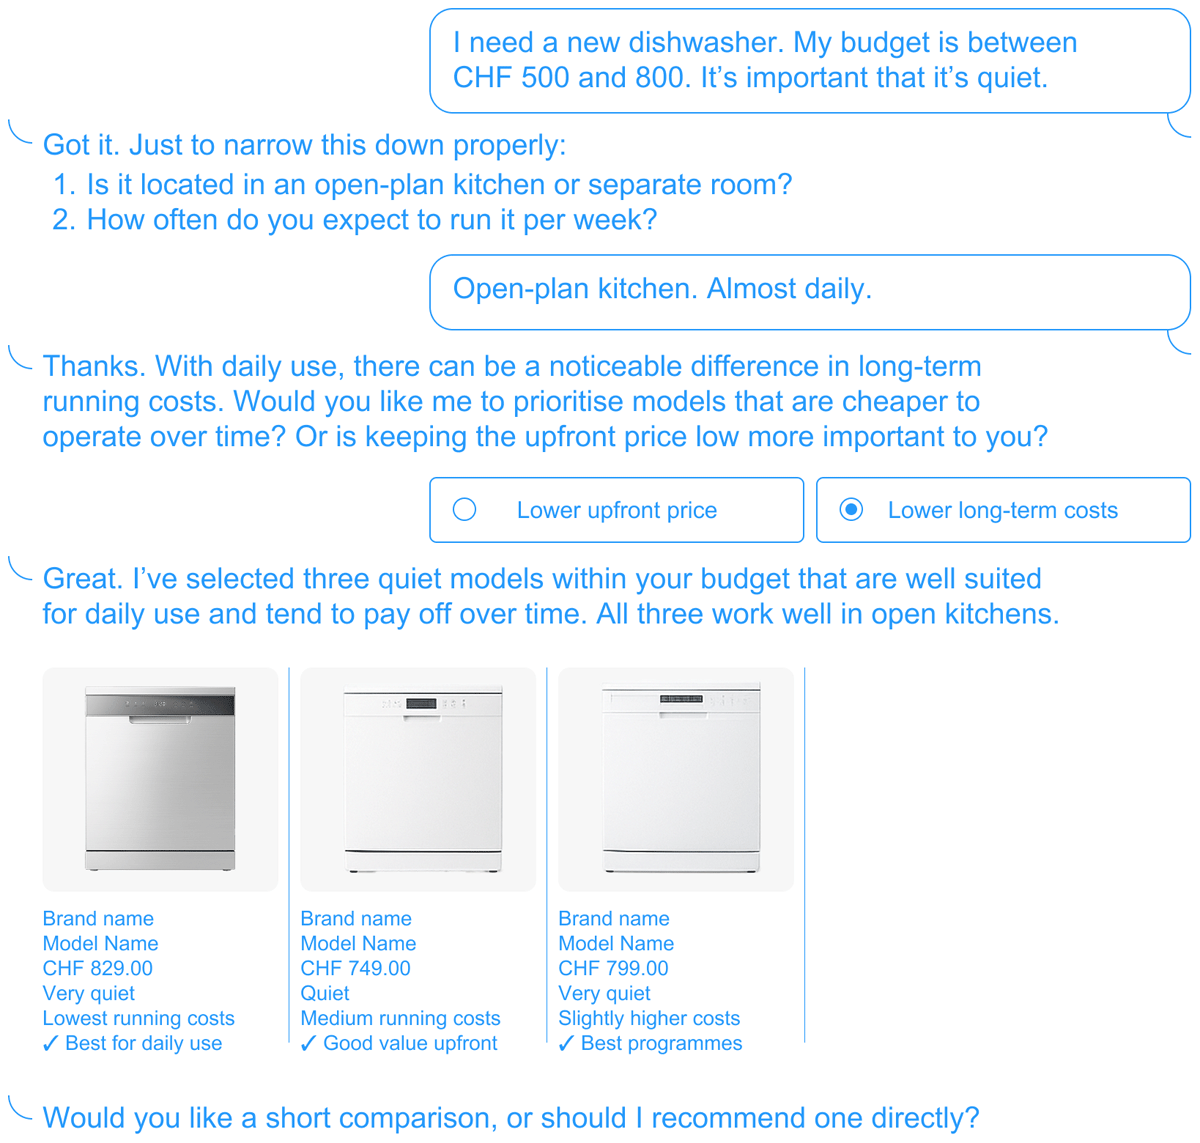
Figure 11
Fictional chat with an AI agent lending support for finding the right product.
However, this development also carries the same risks associated with the use of AI in other contexts: the quality of the training data, the quality and vulnerability to influence of the sources used by AI for search, the resulting bias, and consumers’ limited understanding of the underlying systems. Not least, it may lead to a loss of agency: the less frequently consumers go through processes themselves and instead delegate them, the less practised and experienced they become in assessing the outcomes and recommendations those systems produce.
Policy recommendations
Considering the above findings from both projects, the authors view the following measures effective in further promoting consumer preference for energy-efficient products.
Mandatory filters and cost calculation: Manufacturer websites, marketplaces and online retailers could be legally required to offer a product search with filters for energy efficiency class and specific energy consumption. According to the EPREL Services survey, EU consumers value complete product information and effective filters most highly. In addition, online retailers could be required to display a direct, clickable link to each product’s EPREL entry alongside the energy label, since the QR code is designed for in-store scanning and offers little value to consumers shopping online, regardless of the device they use. Considering the high consumers’ interest in total cost of ownership and running costs, also a customisable cost calculator could be made mandatory for household appliances and heating/air-conditioning equipment.
Common European reference for default usage: User-friendly cost calculators provide default values for number of cycles, operating hours, lifetime of products, energy and water tariffs, etc. Consumers immediately see a result based on default values, and they can easily adjust the values with sliders and input fields. Today, for every cost calculator these default values must be defined anew. It would be helpful to have a European reference for everyone to use freely. Who would be best suited to produce it is open. The European Commission could provide the assumptions from the preparatory studies as structured, machine-readable data. Or resources developed in the EU-funded LABEL2020 project could serve as a starting point – one of the project’s deliverables was a web app tool for calculating energy costs. Alternatively, a technical specification could be developed and published within CEN/CENELEC. Maybe Product Category Rules (PCR) for Environmental Product Declarations (EPD) could include the needed default values, but these are developed and published individually for every product category – it would not be one common document for cost calculators, but many product-specific references.
Conclusion
This paper examined how digital product information can more effectively support energy efficient purchasing decisions in online retail environments, drawing on empirical insights from the EPREL Services project and results from a complementary UX design project. Together, the two projects illuminate the full chain from data availability in e-commerce to its translation into user-centred decision support.
The consumer survey confirms that energy efficiency, operating costs and durability are highly relevant decision criteria for many product categories, particularly household appliances and heating systems. At the same time, it highlights a persistent gap between consumers’ stated interest in these parameters and their practical ability to act on them in current online shopping environments. While the necessary data often exists, most notably through EPREL, it is rarely presented in a way that makes cost implications, efficiency differences and long-term benefits sufficiently visible, comparable or actionable at the point of purchase.
Addressing this gap requires more than improved data availability alone. The EPREL Services project demonstrates how structured, machine-readable product data can be combined with market and cost information to create integrated tools that better align with users’ decision-making needs, while also improving data quality through automated checks and stakeholder feedback. The UX design project complements this data centric perspective by showing how concrete design patterns, such as default efficiency framing, cost-over-time visualisations and post-purchase reinforcement, can translate technical information into meaningful choice architecture without resorting to manipulative practices.
Taken together, the findings suggest that the impact of digital product information depends critically on the interaction between three elements: reliable and structured data, user-centred design that reduces cognitive burden, and incentives for retailers and platforms to implement such solutions. Without this alignment, even well-established instruments such as energy labels risk remaining underused in online contexts.
Looking ahead, digital product information will grow, and purchasing will shift further from offline to online. Online information will ever more strongly shape consumer decision-making and sustainability outcomes. The rise of agentic AI shopping will amplify the impact of online data. Ensuring that energy performance data remains interpretable not only for human users but also for machine agents will be an important consideration for future policy and design frameworks.
Overall, this paper argues that advancing energy efficient consumer choices in online retail can rely on already high awareness, and it is now a question of making efficiency, costs and durability available within purchasing journeys. Combining high-quality product data with carefully designed digital choice environments offers a promising pathway to achieve this goal.
Additional File
The additional file for this article can be found as follows:
Conference presentation
Slides presented at the eceee 2026 Summer Study, summarising the EPREL Services consumer survey findings and the UX design patterns developed for online retail. DOI: https://doi.org/10.66506/essp.8-204-26.s1
eceee paper ID
8-204-26