
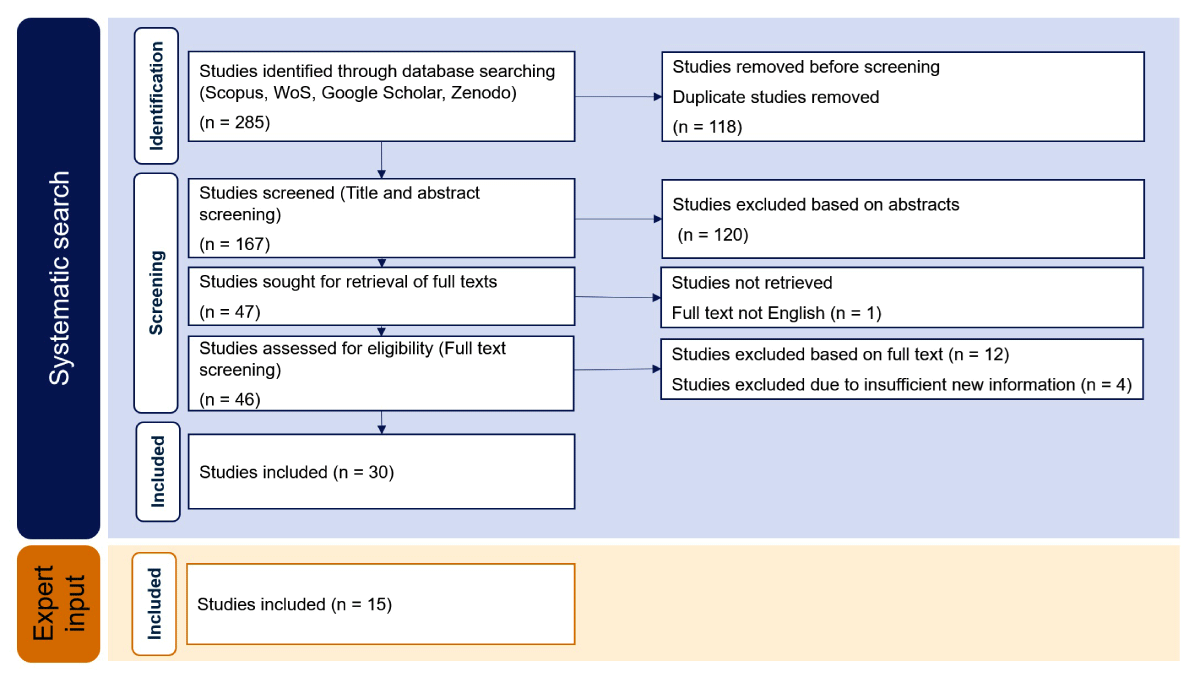
Figure 1
Adjusted PRISMA Flow Chart.
Table 1
Overview of Paper Characteristics.
| PAPER CHARACTERISTIC | NUMBER OF PAPERS |
|---|---|
| Covered labels | |
| EU Energy Label (or slight modifications) | 15 |
| EU Ecolabel | 1 |
| Other labels (including hypothetical labels) | 29 |
| Label type | |
| Mandatory | 18 |
| Voluntary | 14 |
| Hypothetical | 17 |
| Comparative | 32 |
| Non-comparative | 18 |
| Product categories covered | |
| Household appliances | 17 |
| Other electronic appliances | 7 |
| Food and beverages | 13 |
| Clothing | 3 |
| Other | 5 |
| No specific product category | 5 |
| Countries covered | |
| More than one EU country | 22 |
| Austria | 2 |
| Belgium | 1 |
| Germany | 6 |
| Greece | 1 |
| Ireland | 2 |
| Italy | 1 |
| Netherlands | 1 |
| Poland | 1 |
| Spain | 3 |
| Non-EU country | 11 |
[i] Note. If a paper covered multiple categories (e.g., both household appliances and other electronic appliances), it was counted in each relevant category. Therefore, the sum of papers per category does not necessarily equal the total number of papers reviewed (n = 45).
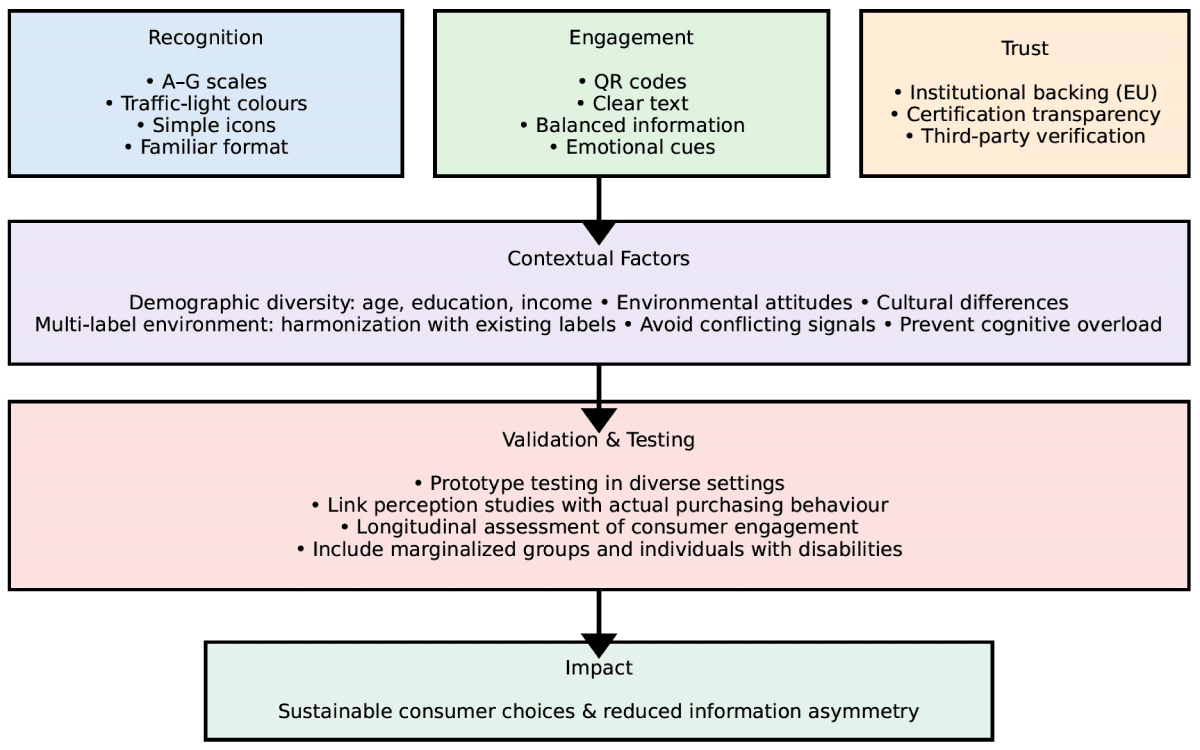
Figure 2
Conceptual framework for effective eco-label design.