
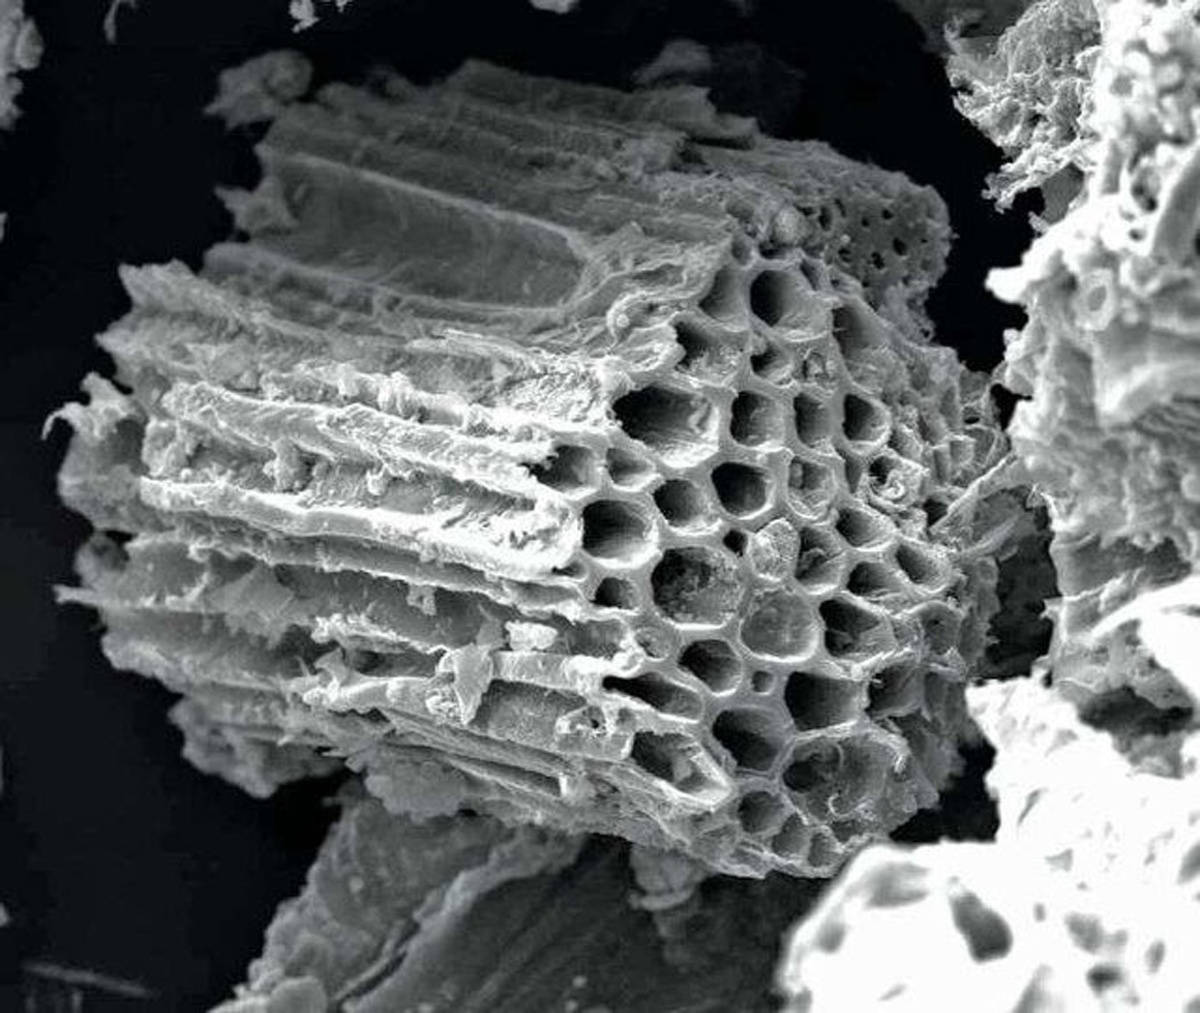
Figure 1
The porous structure of biochar (Gąsior and Tic, 2017).
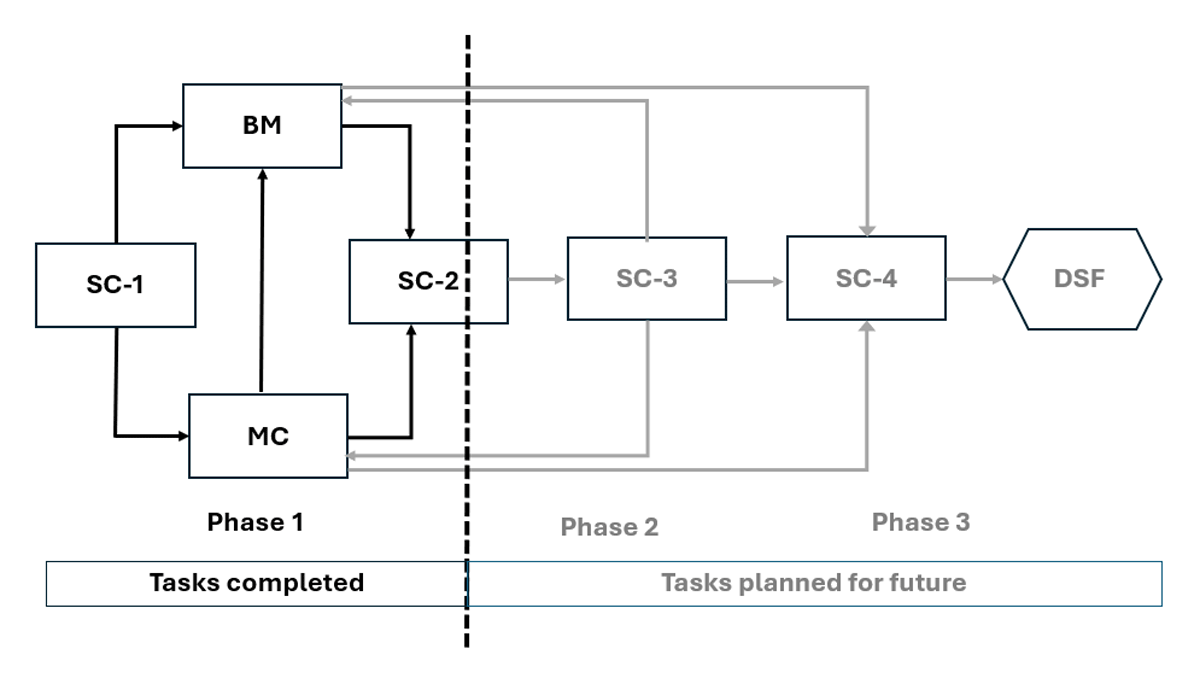
Figure 2
Research methodology flow chart. (Note. BM: building modelling; MC: material characterization; SC: stakeholder consultation; DSF: decision support framework).
Table 1
Mix proportions and nomenclature of the mixes.
| SERIES BASED ON BC/AGG (VT.%) | TOTAL SOLID COMPOSITION (VT.%) | TOTAL SOLID COMPOSITION (WT.%) | PC/NA (WT.%) | BC/NA (WT.%) | W/PC (WT.) | SP/PC (WT.%) |
|---|---|---|---|---|---|---|
| 0BC | 30PC + 70NA | 20PC + 80NA | 24 | 0 | 0.45 | 1.0% |
| 10BC | 30PC + 63NA + 7BC | 21PC + 77NA + 2BC | 27 | 2 | 0.50 | 1.5% |
| 50BC | 30PC + 35NA + 35BC | 29PC + 60NA + 11BC | 48 | 18 | 0.60 | 3.0% |
[i] Note: vt.%: per volume; wt.%: per mass; Agg: aggregates; NA: natural aggregates; W: water; BC: biochar; SP: superplasticizer; PC: Portland cement.
Table 2
Results of the mechanical and physical tests after 28 days.
| SAMPLES | CS (MPa) | FS (MPa) | BULK DENSITY (g/cm3) | WA (%) | THERMAL CONDUCTIVITY (W/mK) |
|---|---|---|---|---|---|
| 0BC | 65.2 (±1.05) | 9.0 (±0.60) | 2.32 | 6.82 | 1.53 |
| 10BC | 56.4 (±1.30) | 8.4 (±0.58) | 2.24 | 7.63 | 1.27 |
| 50BC | 25.3 (±0.55) | 5.5 (±0.16) | 1.94 | 15.88 | 0.76 |
[i] Note: CS: compressive strength; FS: flexural strength; WA: water absorption.
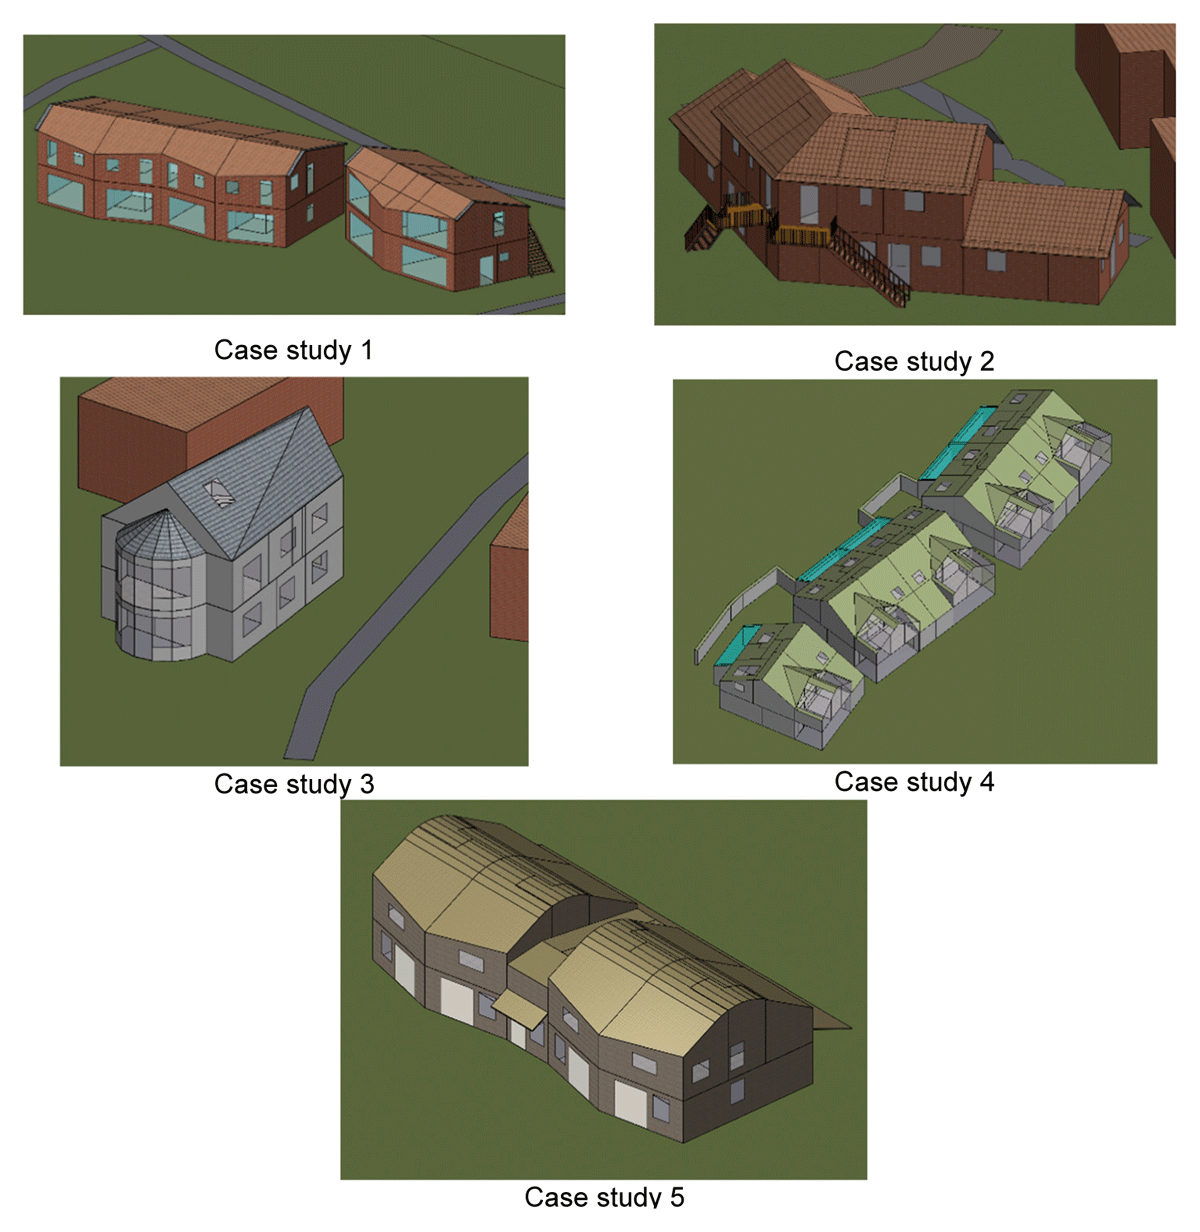
Figure 3
Case study buildings in IES-VE.
Table 3
Case study buildings’ specifications.
| SIMULATION SCENARIO 1 | SIMULATION SCENARIO 2 | SIMULATION SCENARIO 3 | SIMULATION SCENARIO 4 | |
|---|---|---|---|---|
| External wall type | Timber | Concrete | 10BC Biochar-concrete | 50BC Biochar-concrete |
| External wall U-value (W/m2K) | 0.1546 | 0.1561 | 0.1558 | 0.1545 |
| Roof U-value (W/m2K) | 0.1019 | |||
| Floor U-value (W/m2K) | 0.2042 | |||
| Windows U-value (W/m2K) | 1.2097 | |||
| Heating system | Air source heat pump | |||
| Case study 1 GIA (m2) | 541 | |||
| Case study 2 GIA (m2) | 380 | |||
| Case study 3 GIA (m2) | 193 | |||
| Case study 4 GIA (m2) | 828 | |||
| Case study 5 GIA (m2) | 381 | |||
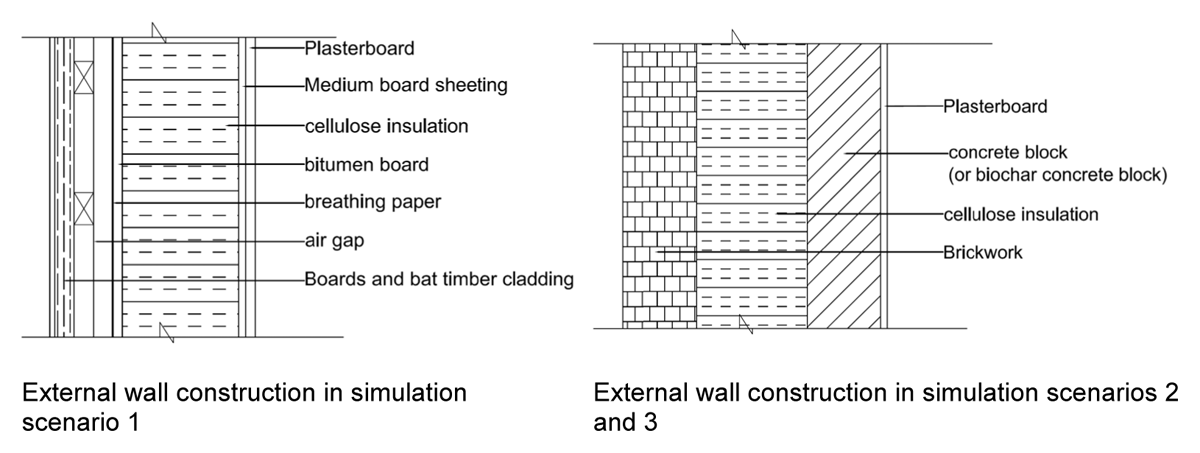
Figure 4
External wall construction details in each simulation scenario.
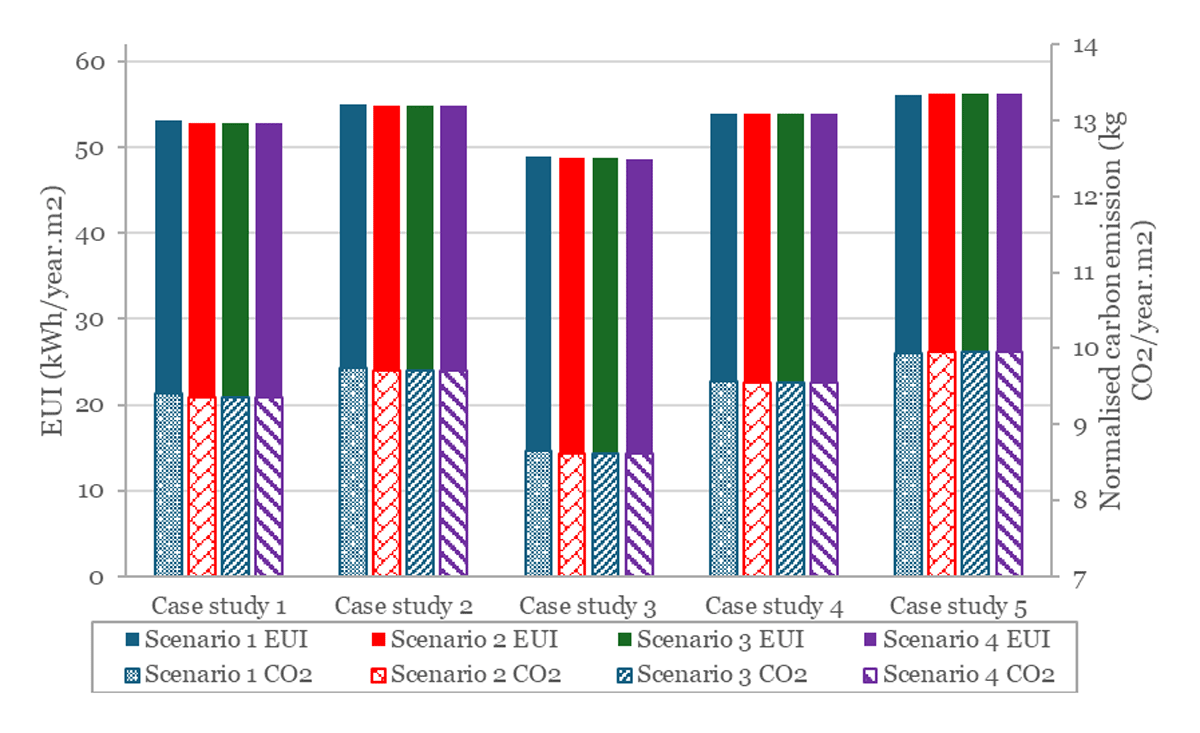
Figure 5
Operational energy and carbon emissions in the case study buildings.