
Introduction – issues with regulating displays
Displays, such as televisions, computer monitors and signage displays, are ubiquitous in our digital society and are becoming larger, brighter and more connected; see Figure 1 for the stock of displays in the European Union and Figure 2 for the models registered in EPREL according to size.
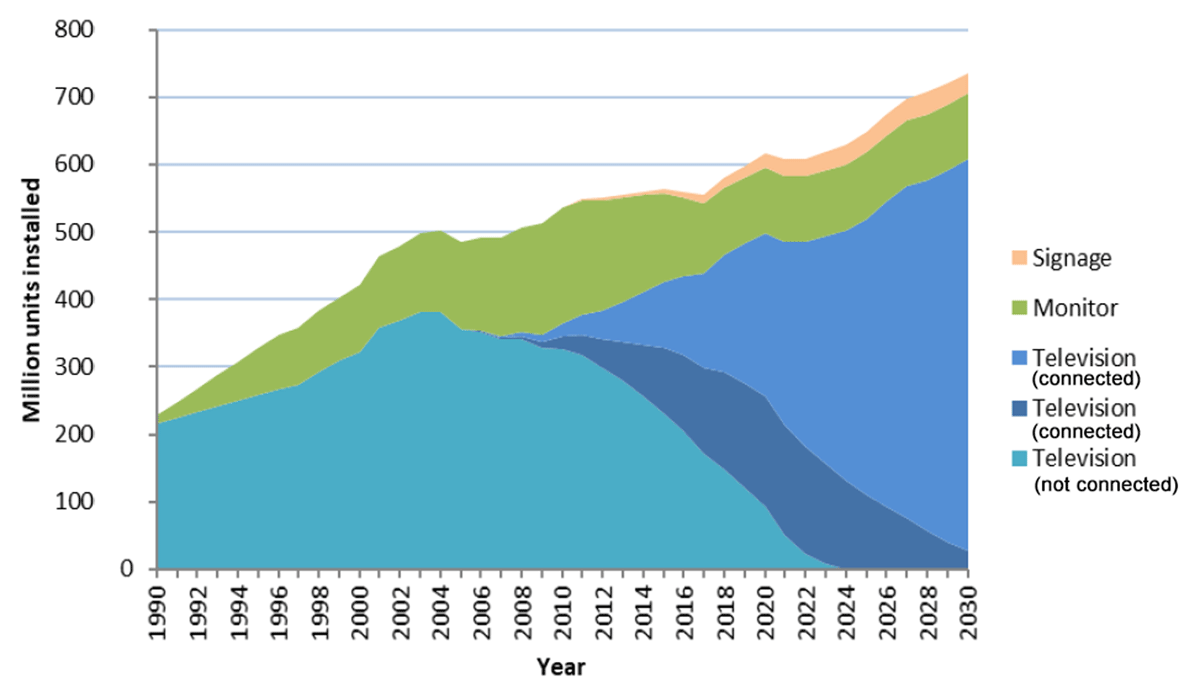
Figure 1
Displays, EU stock (source: Kolbinger et al. 2025, p. 9).
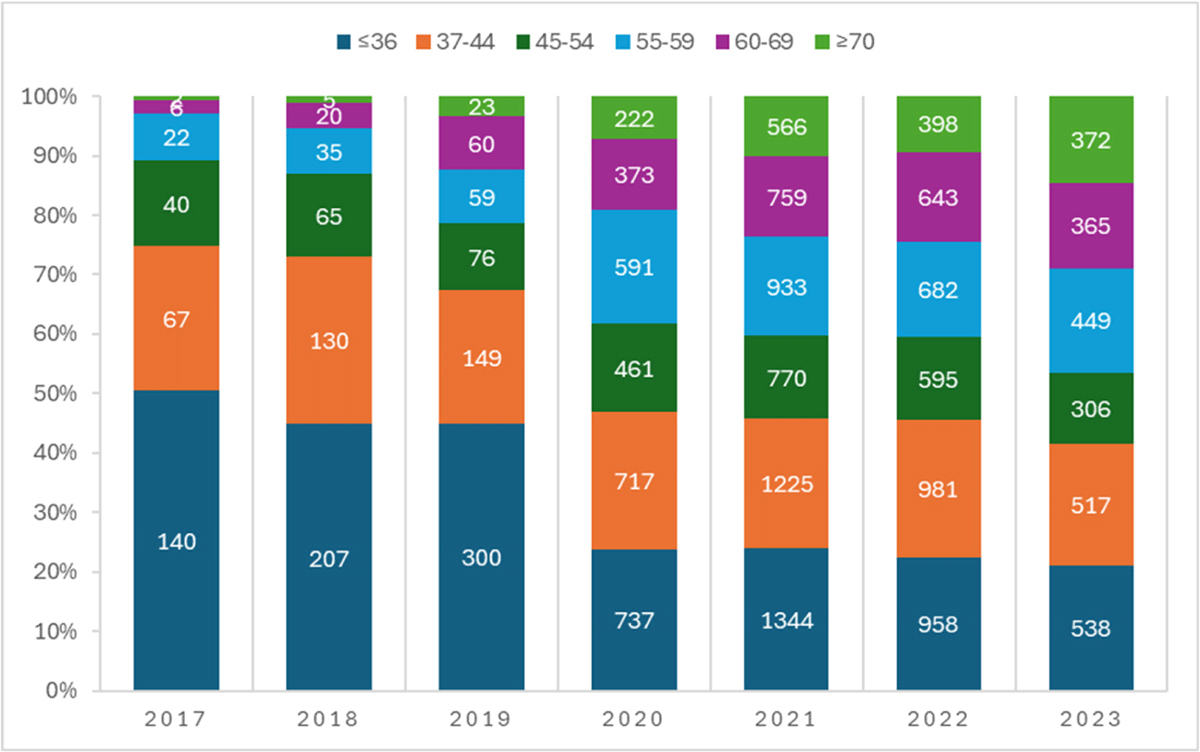
Figure 2
Screen diagonal (inches) of televisions in EPREL (source: Kolbinger et al. 2025, p. 29).
The EU and other jurisdictions have regulated displays through energy labels and minimum efficiency measures, however with unknown success in identifying higher energy efficiency products and increasing their sales. One of the reasons, in the EU at least, is that although differentiation in efficiency between products on the market exists, this differentiation lies to a large extent outside the range covered by the label classes A–F, i.e. it lies mostly in class G (Kolbinger et al. 2025, p. 45). Another reason is that the test method used widely to date, IEC62087-3 (2023), does not directly measure the efficiency of the display in terms of screen luminance. The test method measures the (average) power consumption while displaying a standard video clip. The luminance setting is assessed separately but only to ensure that it achieves the minimum level as required by the regulation; which is either a fixed value or a percentage of the peak white luminance. However, since this is measured at the centre of the display while displaying a white rectangle, it bears little relation with the (average) luminance of the clip that is displayed for the power measurement. Measuring only a static image at the centre offers unintended advantages to non-uniform displays. Non-uniform displays are much darker at the edges than in the center. Non-uniformity is a broadly accepted policy concern when measuring luminance at screen center because non-uniform screens get unintended credit for luminance readings that overrepresent their screen-average luminance. This means a display with a bright center can pass efficiency tests that it would not pass if screen average luminance were measured instead. Additionally, some TV features (e.g., local dimming) optimize energy use dynamically, but current test methods fail to capture these benefits, which can lead to efficiency ratings that are not representative of real-life use. Both the power consumption and the minimum luminance check are performed only in “out-of-the-box” settings, which may not be representative of settings used in real life.
A new test method has been developed that captures the light output and the power consumption of the display at the same time, ANSI/CTA-2037-D (2022). Together with other display characteristics as appropriate, luminance and power are the basic ingredients for an efficiency metric. An essential other part are the settings of the display to be used for the measurements. Modern displays have various parameters that can be changed by the user and that influence both the picture quality and power consumption.
This paper is structured as follows. First, the next section shortly introduces the main display technologies and summarizes the new test method. Then attention is paid to the settings of the display to be used for measurements in a regulatory context and the calculation of an efficiency metric from the results of these measurements. Results from measurements carried out for the preparatory study for the revision of the EU ecodesign and energy labelling regulations (Viegand Maagøe 2025) are used to calculate efficiency metrics for 47 displays. These metrics are analysed with respect to technology independence and interdependencies between display characteristics. Finally, the paper discusses the findings and provides an indication of potential energy savings. Note that this paper does not cover the (network) standby power consumption of displays.
Testing displays – measuring power and luminance
This section introduces the main display technologies and their relation between power and luminance and describes the new test method that measures power and luminance simultaneously while displaying a standard video clip, based upon Harrington and Hardy (2026). Both components, the light generated per unit of power and the fixed power consumption for processing, constitute a dimming line, i.e. the relation between the light output and the power consumption of the display.
Main display technologies
The dominant electronic display technologies on the market today televisions and monitors are LCD (Liquid Cristal Display) and OLED (Organic Light Emitting Diodes). DVLED (Direct View LED) displays are also common for digital signage displays.
LCD displays
LCD displays use a backlight as a light source. This can be an array of white LED lights arranged in a grid behind the display layers, or rows of LED lights around the edge of the panel. In either case, a diffuser spreads the light evenly across the display area. The backlight travels through different layers in the display for each sub-pixel as follows:
Usually through a diffuser to spread the light evenly.
Polarising filter 1 to orient the light onto a single plane.
Thin Film Transistor (TFT) layer that contains a transparent liquid crystal – this lets light pass through with minimal loss but can twist the orientation of the light from 0 ° to 90 °, depending on the electrical charge applied to each part (pixel) of the TFT layer.
A colour filter for each sub-pixel (red, green or blue) – they are pre-printed as a film layer.
Polarising filter 2 – depending on its orientation, this will block light that is twisted (or not twisted) by the TFT liquid crystal layer.
A thin glass cover forms a smooth surface for the viewer at the front of the display.
The key conceptual point is that the LED backlight is generally very efficient (some high end LEDs are now more than 200 lm/W), but most of the light generated is blocked before it is emitted from the screen. Colour filters block a large percentage of light. Where there are darker pixels, more light has to be blocked through the two polarising filters, so the light is partly or fully twisted (or not) through the TFT liquid crystal layer to block the correct amount of light.
Another part of the power is used for controlling the pixels. For a 4k display, there are some 8,294,200 pixels that have to be individually controlled and nearly 25 million subpixels whose charge and orientation has to be updated many times every second for a moving image to be correctly rendered in terms of colour and brightness. This requires significant processing power which is independent from the brightness level. It also indicates that resolution has an impact on efficiency per unit area.
The main variants for controlling the intensity of the backlight array of LEDs are:
LED backlight with no dimming – no change in backlight output or scaling of power with changes in average picture level (lower end products) (edge-lit or direct-lit backlights).
Global dimming of a LED backlight – scaling of backlight output and power with peak picture level across the whole screen (1 zone) (edge-lit or direct-lit backlights).
Local dimming of an LED backlight – scaling of backlight output and power with zone peak picture level within each dimming zone (level of scaling depends on the number of dimming zones could be four to several thousand) (direct-lit backlights and some edge lit displays).
Where there are more than 500 local dimming zones, then this is often referred to as miniLED (which implies <300 µm LED chips in each local dimming zone for a television). Dynamic dimming algorithms determine backlight levels based on the image content to be displayed. Simple approaches use either the maximum pixel value (which prevents clipping but limits power savings) or the average pixel level (which maximizes power savings but may clip highlights). Most practical implementations use a hybrid approach that considers the pixel value distribution — for example, setting backlight based on a high percentile (such as the 95th or 99th percentile) to ignore small specular highlights while preserving most bright content. Temporal smoothing is typically applied to prevent visible flicker between frames. These principles apply whether the backlight is controlled globally (entire screen as one zone) or locally (independent zones), though local dimming adds considerations for light spread between adjacent zones. A very large number of local dimming zones means that the power can scale more as the instantaneous peak luminance changes frame by frame within each dimming zone. But this also requires more processing power as the backlight in each dimming zone has to be scaled to the peak luminance in each dimming zone and amount of light blocked in the LCD array in each dimming zone also has to be scaled to take into account the change in backlight output. The above means that the dimming lines for these implementations will differ considerably.
Emissive displays
In emissive displays each subpixel is its own light source. Every red, green, and blue subpixel is an independently controlled light source that emits light only when needed and only at the intensity required to render the image. As a result, emissive displays do not waste light by blocking it to modulate light output, and their energy use is directly tied to the brightness and colour composition of the content. Because light originates at the subpixel level, emissive displays scale power dynamically and continuously in response to how many subpixels are illuminated, how brightly they are driven, and which colours are present on each frame. Bright scenes with large areas of high luminance require substantially more power, while darker scenes require significantly less. For black parts of the picture, the light output of the pixels can be scaled back to zero. Emissive displays have excellent contrast ratios. This behaviour produces a power versus time profile that more closely follows frame-average luminance. Therefore, it can be expected that emissive displays in general have a steeper slope of their dimming lines than LCD displays. As for LCD displays, resolution can be expected to impact power consumption since a higher resolution means that more subpixels need to be controlled.
There are several variants of emissive displays. Direct View LED (DVLED) – essentially red, green and blue (RBG) LEDs at a sub-pixel level are used to create the image shape and brightness. The main efficiency limitation is that the individual efficiency of red and green LEDs is relatively low (compared to white LEDs). But minimal light is blocked in an emissive display when creating an image. Large displays (stadiums, outdoor signage) can be this type, but many have a coarse pixel count. DVLED does not require colour filters or a light modulating TFT stack. Each RGB subpixel is an independently controlled light emitting diode (LED), which natively emits the desired colour. MicroLED is a type of DVLED display that has microscopic LEDs that are fine enough for use in large displays such as television video walls. Currently these are limited to large and very expensive displays (usually more than 75 inches or 154 dm2). Limited initial data shows that they have a high fixed power budget.
OLED displays are the main type of emissive technology in residential and commercial settings and use four white organic OLEDs within in each pixel. Each OLED is a usually white emitter with RBG colour filters and may have a separate white subpixel. The main variant for OLEDs is to have a blue emitter (closer to the UV spectrum) where quantum dots are used to re-emit the input blue light at different wavelengths to replace colour filters. In both cases there is some loss through filters or quantum dot re-emitters, but this is a fixed proportion of the light generated for each sub-pixel. The individual subpixels can scale their light output (and therefore most of their power requirement) from zero to full output on a continuous basis.
The new test method
In the ANSI/CTA-2037-D (2022) test method power and screen-average dynamic luminance are measured simultaneously while playing standard definition resolution (SDR) and high definition resolution (HDR) IEC test clips; Figure 3 shows the test set-up. The test clips each last 5 minutes. Key element in this test set-up is the camera photometer that dynamically captures the whole screen luminance.
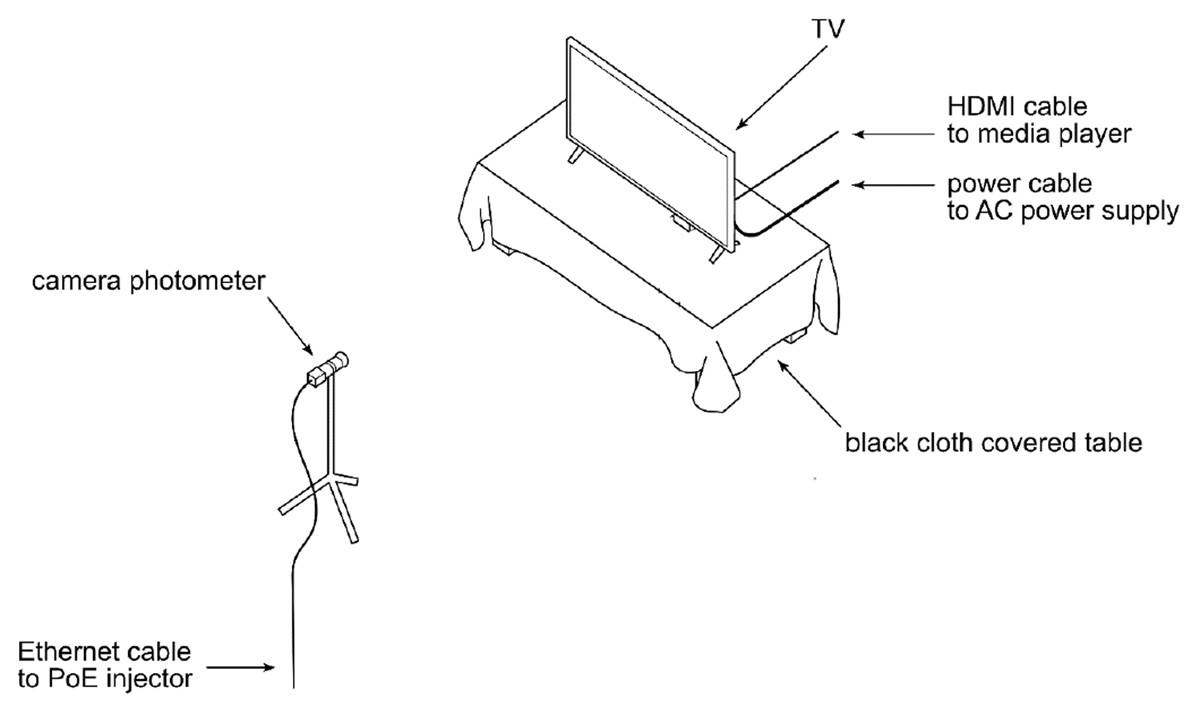
Figure 3
ANSI/CTA-2037-D test set-up (adapted from Hardy (2025; p. 26)).
Display settings and calculation of an efficiency metric
Efficiency metrics for displays
An efficiency metric expresses performance per (unit of) energy input. However, the performance of a display – picture quality – cannot be assessed objectively. Therefore, it is proposed to use the main energy service, the light output, of a display as a proxy for the performance. So, in general, an efficiency metric for displays is:
For the unit of a concrete metric, several options exist. The first is to use the luminance of the display for the light output and the (on mode) power consumption1:
Another option is to use the normalized power consumption2:
Based on Harrington and Hardy (2026), we assume that relevant parameters for the efficiency of the energy service are: power (W), luminance (cd/m2), resolution (pixels) and screen size or area (m2); see Figure 4. We test these assumptions further in the analysis section of this paper. The display settings influence the power consumption and the luminance.
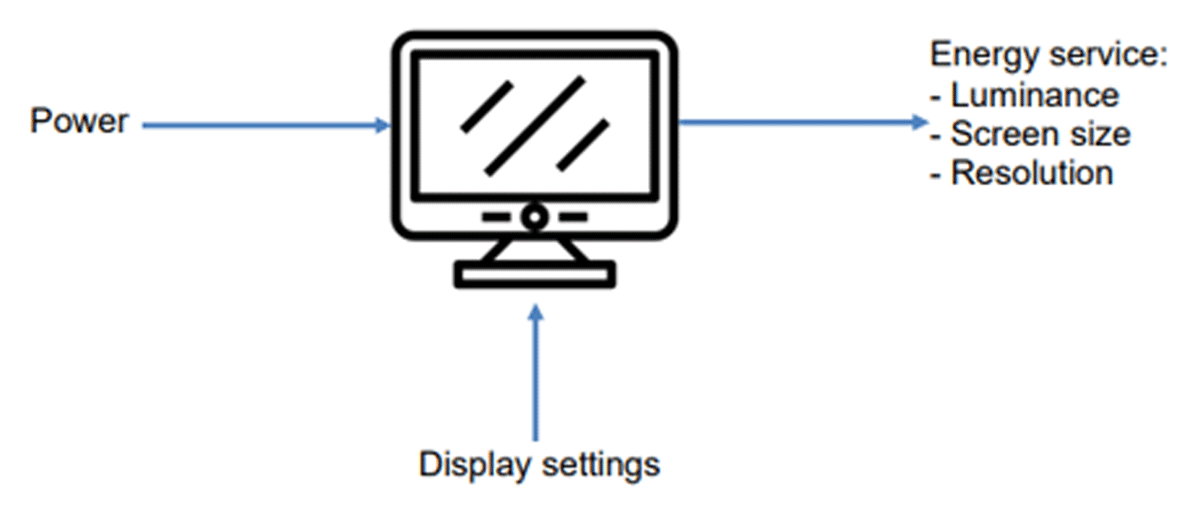
Figure 4
Relevant parameters for display efficiency.
Display settings for measurements
A display setting is combination of values for parameters such as brightness, contrast, colour, sound and sharpness that can be directly or indirectly set up by the user of the display. Choosing the displays setting(s) for measurement of power and luminance in a regulatory context is important for the following:
Ensuring that the settings are representative of the use of the display in practice.
Ensuring that the settings can unequivocally and easily be found on any display, deliver the same result on all units of a certain display model and can be replicated, e.g. by a different laboratory.
Preventing gaming, i.e. manipulating settings so that they provide a good result in the measurements related to the regulation, but do not reflect the efficiency of the display in practice.
The settings of current displays can be set and changed in many ways. To guide consumers in using the “right” settings to accommodate for different types of video contents, typically watched in different ambient light conditions, displays have pre-set picture settings (PPS), e.g. Standard, Neutral, Movie, Sports. A definition of PPS is: a factory-configured profile on displays that instantly adjusts parameters such as brightness, contrast, colour, and sharpness to optimize the display for specific content or environments. Table 1 provides an overview of the options for settings to be used for display testing:
Table 1
Type and number of settings for a display.
| NUMBER OF SETTINGS | TYPE OF SETTINGS | |
|---|---|---|
| PRESET (PPS) | MANUAL | |
| Single | Single PPS | Single parameter |
| Multiple | Multiple PPS | Multiple parameters |
Single or multiple settings
Preset settings or manual/individual settings
and any combination, including which and how to arrive at certain settings.
By using in principle the PPS of the display as settings for the measurement, it is ensured that these settings are representative of the use of the display in practice. This assumes that the manufacturers only introduce PPS that are relevant for (a number of3) consumers, e.g. to accommodate different types of video content. Another advantage of using PPS, is that these can be easily found and deliver the same result on all units of a certain model; therefore, setting a certain PPS on unit A in laboratory X gives the same settings as setting that PPS on unit B in laboratory Y. This leaves preventing gaming as the main goal for choosing settings that are used in the measurements for a regulation.
As indicated above, satisfying the first two bullets (representativeness, easily found) points toward the use of PPS (and not manual settings). The choice for a single PPS would require: a) to define that PPS, e.g. default, first mentioned in the menu, and b) to ensure that this does not lead to gaming. This probably will lead to the same problems as the current 65% criterion related to the brightest on mode configuration (PPS) that is used in the EU regulation.4 Therefore, in principle the display should be measured in all PPS. The settings of a PPS could be changed manually for one or more parameters. However, this could also be problematic regarding the definition of the parameters and the setting of these parameters, and may negatively impact the reproducibility.
Regarding gaming, two situations have to be dealt with:
Too many PPS, e.g. a manufacturer may specify 20 PPS of which a number could be (almost) the same, are too bright etc.
Too few PPS: a manufacturer could specify no PPS or only one PPS (as in some computer monitors and digital signage displays), or several PPS that are too close to each other.
Choosing from these options is guided by the following assumptions:
A PPS is not evaluated on picture quality, because it will be difficult if not impossible to set an objective criterion on what an “acceptable” picture is. Moreover, this will differ for different ambient conditions. One exception is the use of extreme PPS settings, such as a completely white display.
At least two measurements are needed to calculate the metric, i.e. the metric is the average of the efficiency at various display settings. The reason for using (at least) two measurements is to enable evaluation of the power scaling performance of the display.
From 1) it follows that in principle all PPS are treated equally and that a priori no PPS is selected above another PPS. As each PPS requires a separate measurement, a large(r) number of PPS increases the burden for manufacturers, but not necessarily for market surveillance authorities (MSA).
For too many PPS, the rule could be that “sub-PPS”, i.e. a PPS that is in a sub menu of another PPS, can be ignored. Another option is, for displays with 10+ PPS in the main menu that the MSA can choose any combination of 10 PPS for verification. In this case verification would mean checking whether the declared power and luminance values for a PPS is – within a certain tolerance – equal to the values measured by the MSA. In any case, manufacturers should list all PPS in the instruction manual and in the technical documentation (in the latter together with the declared values and measurement results of power and luminance for each PPS).
For too few PPS: if there is only one PPS, the luminance of that PPS should be individually adjusted to the min and the max settings; this will result in 3 measurement results: the PPS as is, the PPS with the minimum luminance, the PPS with the maximum luminance. If there are more PPS but the luminance of all of these is too close, e.g. within 20% of each other, the PPS provides little insight in the “scaling” performance of the display. One option is to select one PPS and adjust the brightness manually (see above). Another option is to require that for displays that have more than one PPS the difference between the PPS with the min and the PPS with the max luminance should be at least a certain factor. Displays that do not comply are not compliant with the regulation.5
A final question on the display settings for measurements is how to deal with ABC (Automatic Brightness Control), a feature that controls the luminance in relation to the ambient lighting conditions. In principle, ABC could save energy because it ensures that the luminance of the display is correctly tuned to the ambient light and is not too bright (but also not too dim). However, testing ABC is difficult since first the ambient light conditions in the field are much more varied than in the lab, meaning that test conditions are not representative for most cases. Second, it is also a hard test to set up and conduct properly: lux meter positioning and lamp positioning and pointing are examples where there is lot of opportunity for error. Therefore, it is proposed to disable ABC during measurements.
Calculation of the efficiency metric
The measurements of power and luminance in each PPS and, if necessary, individual settings as specified in the foregoing section result in a number of measured (power, luminance) pairs. Note that these values do not constitute a dimming line, i.e. they do not indicate how the display behaves when (manually) changing the luminance.
Several options exist to calculate an average efficiency value from these measurements6:
Use the measurements with the lowest and highest luminance to calculate the efficiency at these two points and then calculate the average.
Use all measurement results and calculate an average efficiency by means of a regression line (average is efficiency at midpoint between lowest and highest luminance measured), or calculate individual efficiency values (for each PPS) and calculate the average efficiency as the arithmetic, geometric or harmonic mean.
The reason for using the second option is to avoid gaming and to get a “real” average value; see Figure 5 for illustration with the regression line approach.
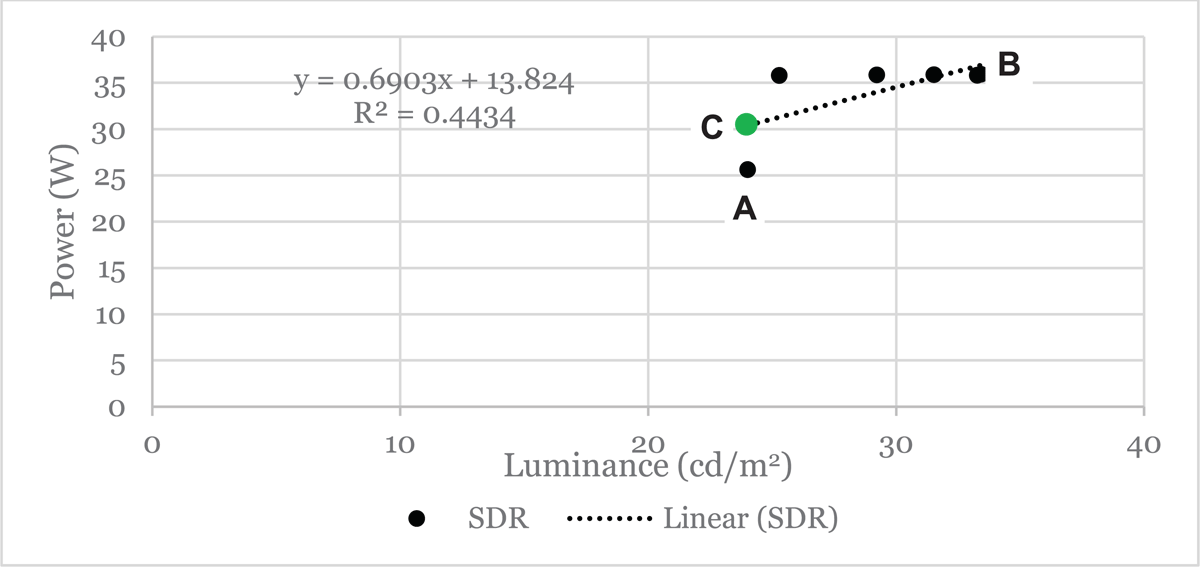
Figure 5
Power versus luminance.
For the first option, points A and B would be used, noting that A affects the efficiency in a (too) favourable way compared to the other measurements. For the second option, a point (almost) equal to B would be used for the maximum luminance, but for the minimum luminance point C (green dot) would be used. By using a regression line or another averaging method using all PPS, changing a single PPS becomes less attractive.
Measurement results and analysis
Dataset
In the preparation of the review of the EU display regulation, 49 displays were measured by Intertek (UK) with the new measurement method. For the analysis, two displays were removed from the data set because they were essentially laptop screens powered by 5 VDC. The characteristics of the remaining 47 displays are shown in the Annex.
For SDR and – where applicable HDR measurements were done in all PPS of the display. Relevant for this analysis is the (difference in) luminance between the PPS. Note that gaming is not an issue here because currently no requirements or energy labels are based on measurements at the various PPS, so manufacturers could not have finetuned the PPS to achieve a more favourable result. As example, Figure 6 shows the measurements of all PPS for two display models. It shows that the models have different characteristics: for the left model power increases linearly with luminance at the various PPS, whereas for the right model the power does not significantly increase with increasing luminance at the various PPS. It also features PPS of a similar luminance but different power use, which is likely due to additional processing power to increase certain image qualities, for example sharpness. This further supports the case for testing of multiple PPS.
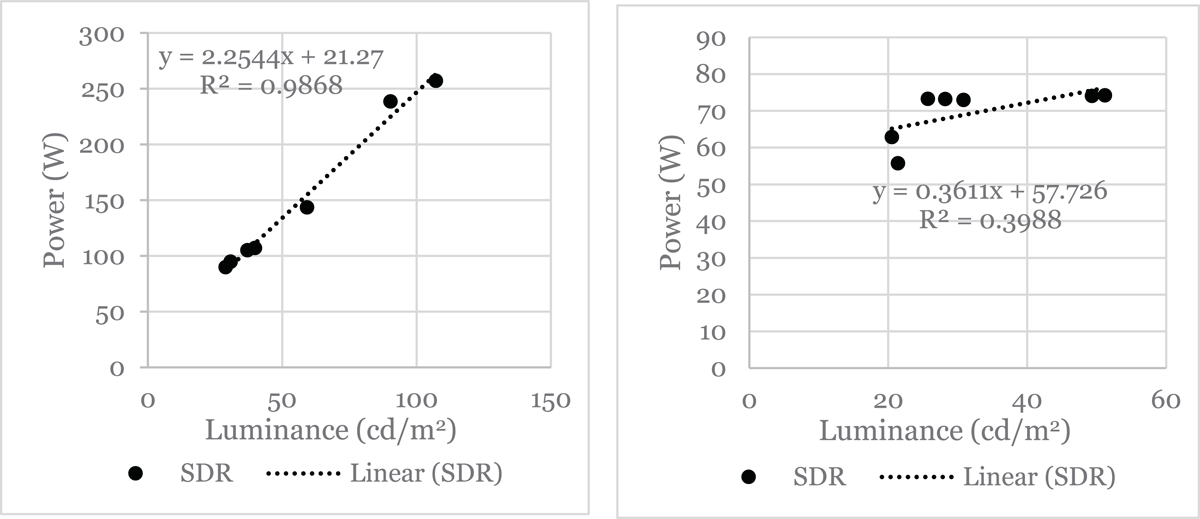
Figure 6
Power versus luminance at different PPS, for two different display models.
Furthermore, the Figure 6 illustrates an important issue for calculating “the” efficiency of a display. For the right model the efficiency (luminance over power) for the brightest mode is 50/74 = 0.69, whereas for the mode with the lowest luminance it is 21/63 = 0.33 – less than half of the efficiency of the brightest mode. For the left model the efficiency varies much less with luminance because the power consumption scales with luminance: 107/257 = 0.42 for the brightest mode and 29/90 = 0.32 for the mode with the lowest luminance.
Analysis
This section shows the results of the analysis on the data set. Because the efficiency metrics ((cd/m2)/W and cd/W) do not have a normal distribution, the natural log (ln) value of the average efficiency calculated with the regression line was used for the analysis; see Annex (Table 3) for details.
Figure 7 shows that the average on-power in SDR increases with average luminance (ln value) in SDR but that the screen area is not related to the average luminance (ln value) in SDR.
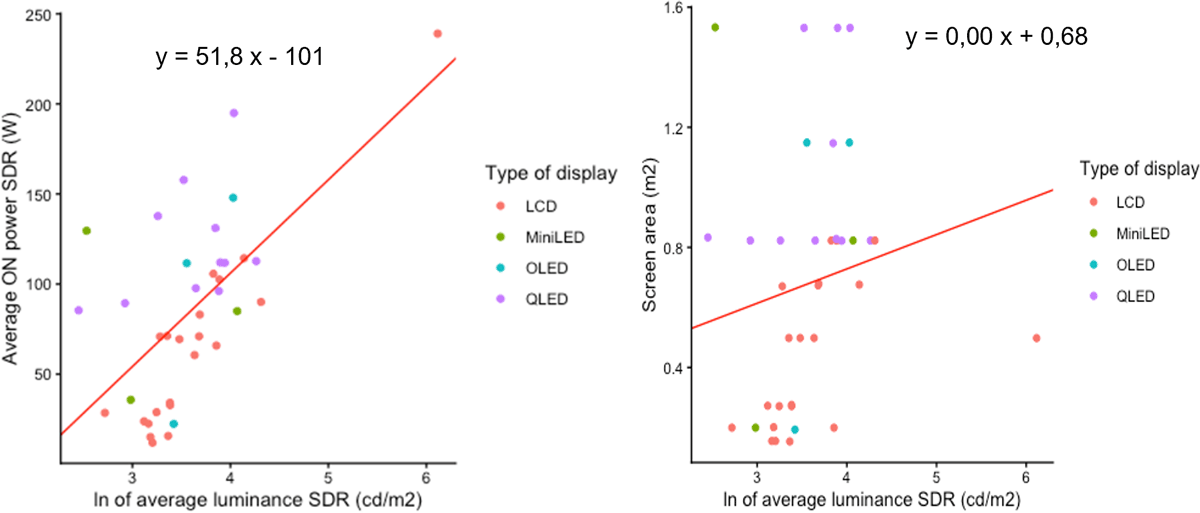
Figure 7
Average luminance versus on power and screen area – by technology type for SDR.
Figure 8 shows that the (cd/m2)/W metric (ln value) correlates negatively with the screen area, i.e. a larger screen area goes with a lower efficiency, whereas the cd/W metric (ln value) has a weak positive correlation.
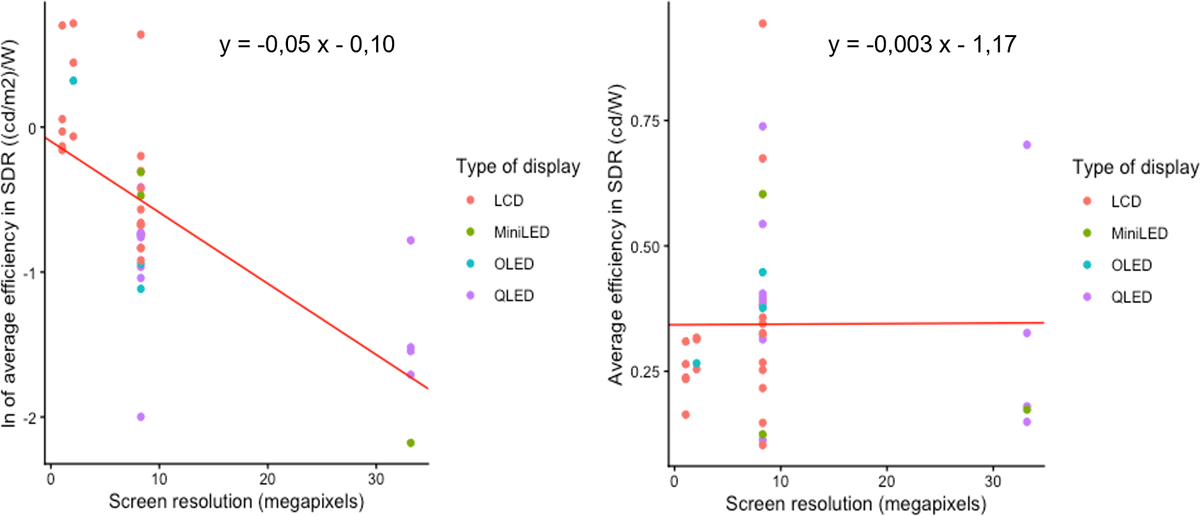
Figure 8
Screen size versus average efficiency by technology type for SDR.
Figure 9 shows the same results for the relation between efficiency and resolution: the (cd/m2)/W metric (ln value) correlates negatively, whereas the cd/W metric (ln value) shows no significant correlation.
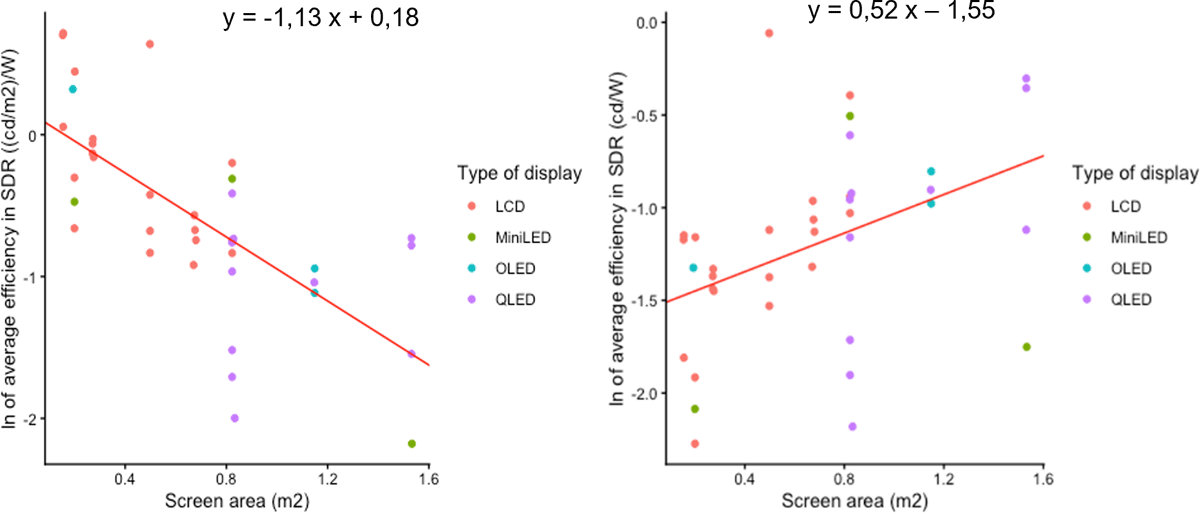
Figure 9
Average efficiency versus screen resolution by technology type for SDR.
Finally, Figure 10 shows the relation between screen resolution and screen area: the relation is positive – larger screens tend to have a higher resolution – but not strong.

Figure 10
Screen area versus screen resolution by technology type for SDR.
Regression analysis was performed to check which display characteristics affect the efficiency metrics. Ideally an efficiency metric would be independent from screen area, type of display etc. Table 2 shows the results for the following regression model7 for the two efficiency metrics:
Table 2
Multiple regression results for efficiency metrics.
| CHARACTERISTIC | STD BETA | BETA | 99% CI | P-VALUE |
|---|---|---|---|---|
| Average efficiency in SDR ((cd/m2)/W) | ||||
| (intercept) | 0.03314 | –0.33551, 0.40180 | 0.8 | |
| Screen area (m2) | –0.44744 | –0.72488 | –1.30547, –0.14430 | 0.002 |
| Average luminance in SDR (in cd/m2) | 0.30417 | 0.003300 | 0.00035, 0.00565 | 0.004 |
| Screen resolution (megapixels) | –0.38169 | –0.02716 | –0.05268, –0.00164 | 0.006 |
| R2adj = 0.6414 | ||||
| Average efficiency in SDR (cd/W) | ||||
| (intercept) | –1.73579 | –2.03934, –1.43225 | <0.001 | |
| Screen area (m2) | 0.78272 | 0.97056 | 0.49252, 1.44861 | <0.001 |
| Average luminance in SDR (in cd/m2) | 0.49155 | 0.00371 | 0.00152, 0.00589 | <0.001 |
| Screen resolution (megapixels) | –0.55730 | –0.03035 | –0.05136, –0.00934 | <0.001 |
| R2adj = 0.5851 | ||||
[i] Abbreviation: CI = Confidence Interval.
Both metrics correlate with screen area, average luminance and screen resolution. For the (cd/m2)/W metric the sign of the regression coefficients is negative for screen area and resolution, meaning that the metric would not favour larger displays or displays with higher resolution. However, this will be partly compensated for if these displays have a higher luminance. For the cd/W metric, both screen area and luminance correlate positively with efficiency, therefore favouring larger displays and displays with a higher luminance. This is partly compensated for by the negative sign of the screen resolution, but screen resolution is less variable.
Estimate of energy savings
Ultimately, minimum efficiency performance standards (MEPS) such as EU ecodesign requirements and energy labels should lead to energy savings, either absolute – less kWh used – or relative – a higher efficiency. Both require a reference: a minimum efficiency level for MEPS or class boundaries for energy labels. The metrics analysed in the foregoing section can be used for this.
The dataset can also provide a first indication for savings. The (average) efficiency (expressed in cd/W, as an example) of displays in the dataset varies between 0.10 and 1.30. Note that this is a large range, caused by the inclusion in the dataset of some signage displays that use very bright and efficient LEDs. Setting a MEPS level of 0.20 would result in 14% of the products to be changed to meet this level, with an average saving per product of 25%, and in savings of 4.5% related to the energy consumption of all displays in the dataset. Setting a MEPS level of 0.30, close to the average, would result in 33% of the products to be changed to meet this level, with an average saving per product of 38%, and in savings of 11% related to the energy consumption of all displays in the dataset. Also, the impact of an energy label can be estimated as follows. If the efficiency of a label would increase with 0.05 for all products, this would result in savings of 13.5%.
Note that these are very simple estimates, based on a limited, not representative dataset. However, the differentiation of efficiency in this dataset that is underlying the savings, was also noted in the EPREL data.
Conclusion, discussion and recommendations
This paper presented some issues with the current ecodesign and energy labelling regulations for displays. Whereas a new test method was developed that simultaneously measures the light output and power consumption of a display, it was not clear how to use the results of the new test method for arriving at a metric that adequately represents the energy efficiency of a display. This requires a choice of one or more of the display settings, acknowledging that modern displays have many options to set parameters, and a way to calculate the efficiency from the measurements at these settings. This paper discussed several options and presented the benefits of using the results of all PPS to calculate the average efficiency.
Although this is a step forward compared to the current metric used in EU ecodesign and energy labelling regulations, the approach has a number of limitations. First, the light output as proxy for the performance of a display does not include picture quality. Methods are being developed to characterize signal-to-light-mapping by means of gamma curve parameters that can be used to represent picture quality. This is a topic for further research.
Second, the approach is dependent on the PPS as set by the manufacturer. Compared to the approach in the current EU television and monitor regulations that is based on the default PPS, the proposed calculation involves all PPS. Still, this may be prone to manipulation by the manufacturer. For the dataset used in this paper, the regression line average, the arithmetic, geometric and harmonic mean all result in about the same average. However, the first two options are easy to manipulate by adding a single PPS with a (much) higher luminance. Using the harmonic mean would mitigate the impact of such manipulation to a large extent, by limiting the influence of extremely efficient low-brightness modes. Furthermore, assessing dimming lines of individual PPS can be an option to assess more in detail the technical characteristics of a display and could be used to further limit manipulation. A number of other possible approaches are not discussed in this paper, such as measuring a limited number of PPS, e.g. the default, the most and least efficient, or requiring that all PPS pass a certain efficiency requirement.
Regarding the two possible metrics analysed, (cd/m2)/W and cd/W, no clear “winner” emerges. The (cd/m2)/W metric does not favour directly larger displays or displays with higher resolution, but results in higher efficiencies for displays with a higher luminance. The cd/W metric favours larger displays and displays with a higher luminance, but not displays with a higher resolution.
The choice for an efficiency metric instead of a power limit only related to the size of the display, has important implications for (absolute) energy savings as is illustrated by Figure 6. At the lowest luminance both products are equally efficient but have a different power consumption: 63 W versus 90 W, almost 50% more. Furthermore, setting efficiency requirements only result in absolute energy savings if all other energy related parameters stay the same. Larger, brighter or higher resolution screens could easily increase power consumption and surpass the savings as result of a higher efficiency. It may be appropriate to set more stringent requirement for larger or brighter displays. Finally, in general, ecodesign does not regulate the number of displays consumers have in their homes or retailers have in their stores.
The analysis focused on SDR, although some results for HDR were available. In general, the efficiency in HDR was lower than in SDR, but these was not sufficient data to investigate whether a relation between these efficiencies exist. Also note that the topic of standby was not treated at all in this paper. Especially network standby of connected displays and standby allowing voice or motion activation can result in considerable energy consumption over the year.
Additional File
The additional file for this article can be found as follows:
PowerPoint Slides
PowerPoint Slides relating to this article. URI: https://eceeeproceedings.org/articles/18/files/6a6329f83d827.pptx
Appendices
Annex
Table 3
Characteristics of displays in the dataset.
| CHARACTERISTICS | N = 47 MEDIAN (Q1, Q3) MEAN SD; n (%); [UNKNOWN] |
|---|---|
| Screen area (m2) | 0.50 (0.20, 0.82) 0.59 0.42 |
| Screen resolution (megapixels) | |
| 1.049088 | 5 (11%) |
| 2.0736 | 6 (13%) |
| 3.6864 | 1 (2.1%) |
| 8.2944 | 28 (60%) |
| 14.7456 | 2 (4.3%) |
| 33.1776 | 5 (11%) |
| HDR capable | 37 (79%) |
| Type of display | |
| LCD | 28 (60%) |
| MiniLED | 4 (8.5%) |
| OLED | 4 (8.5%) |
| QLED | 11 (23%) |
| On mode power and luminance | |
| Average on mode power in SDR (W) | 85 (34, 112) 85 52 [9] |
| Average luminance in SDR (in cd/m2) | 34 (26, 49) 48 69 [9] |
| Average on mode power in HDR (W) | Mean: 119; SD: 52 [38] |
| Average luminance in HDR (in cd/m2) | Mean: 42; SD: 18 [38] |
| Measured on mode power @ max luminance in HDR (W) | 99 (67, 145) 112 72 [10] |
| Efficiency | |
| Efficiency @ max luminance in SDR ((cd/m2)/W) | 0.68 (0.50, 0.98) 0.84 0.59 [9] |
| Efficiency @ max luminance in SDR (cd/W) | 0.39 (0.27, 0.46) 0.43 0.30 [9] |
| Average efficiency in SDR ((cd/m2)/W) | 0.51 (0.40, 0.85) 0.69 0.49 [9] |
| Average efficiency in SDR (cd/W) | 0.32 (0.23, 0.39) 0.34 0.19 [9] |
| Efficiency @ max luminance in HDR ((cd/m2)/W) | 0.41 (0.29, 0.65) 0.51 0.33 [10] |
| Efficiency @ max luminance in HDR (cd/W) | 0.22 (0.18, 0.37) 0.27 0.15 [10] |
| Average efficiency in HDR ((cd/m2)/W) | Mean: 0,42; SD: 0,17 [38] |
| Average efficiency in HDR (cd/W) | Mean: 0,36; SD: 0,21 [38] |
Analysis of skewness and kurtosis of the variables shows that most of them show non-linearities, have a non-normal distribution. Skewness and kurtosis are out of acceptable ranges of [–2, 2] for:
screen resolution: high kurtosis value due to peak at 8.2944 megapixel;
average luminance in SDR: high skewness and very high kurtosis because of one high luminance value (453 cd/m2).
The skewness and kurtosis of the values for average efficiency in SDR can be significantly reduced, down to < |0,24|, by the natural logarithmic of the variable.
Notes
[2] Where: Eff is the efficiency of the display, Lum is the luminance of the display and P is the (average) power consumption in on mode.
[5] Resulting in some manufacturers lowering the brightness in the brightest on mode configuration to comply with the requirements.
eceee paper ID
8-015-26