
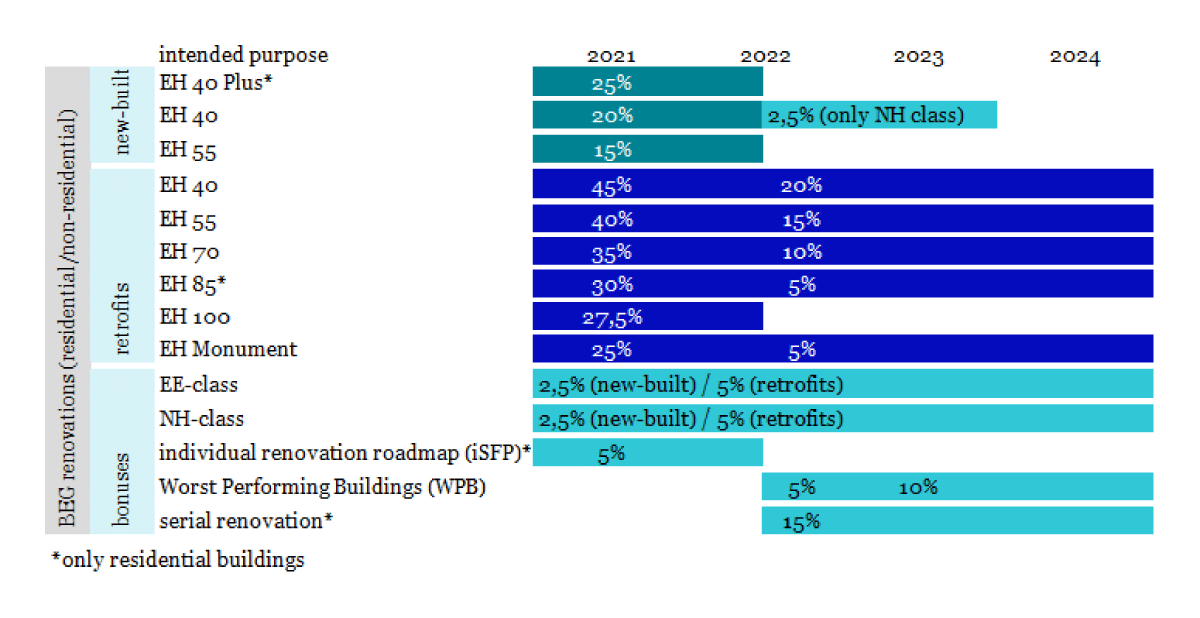
Figure 1
Development of funding conditions for renovations (funding intensities in percentages).
Source: Own representation based on BEG evaluation reports (2021–2024).
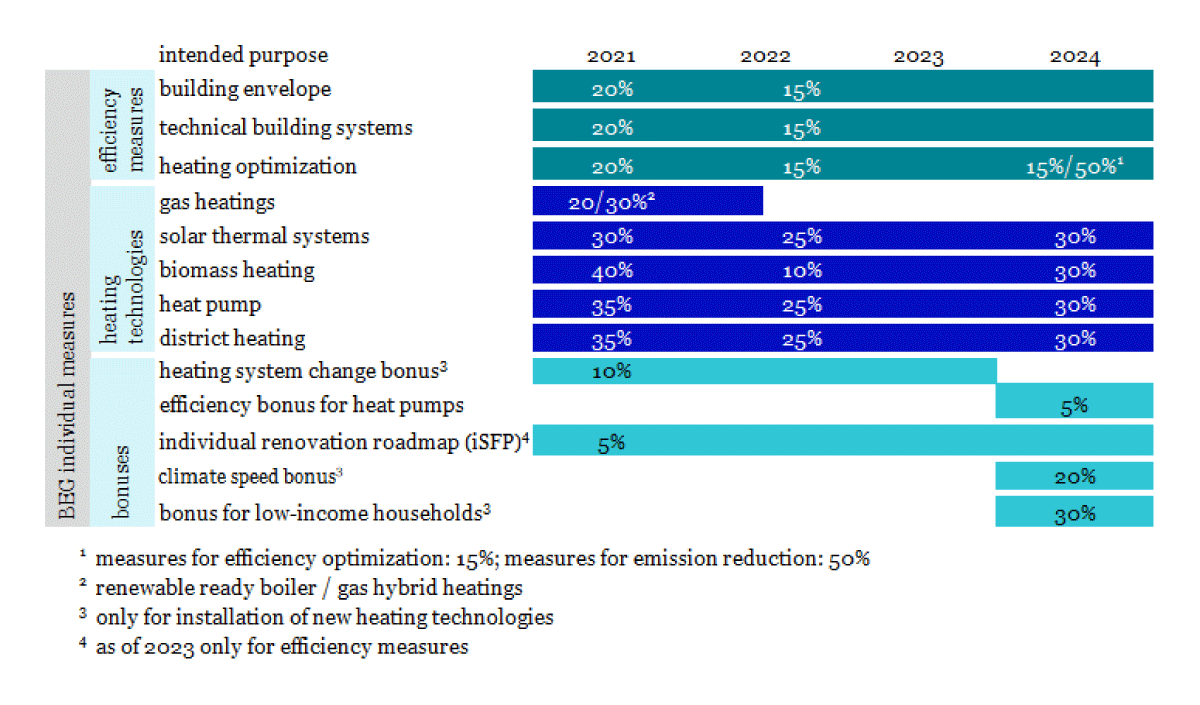
Figure 2
Development of funding conditions for individual measures (funding intensities in percentages).
Source: Own representation based on BEG evaluation reports (2021–2024).
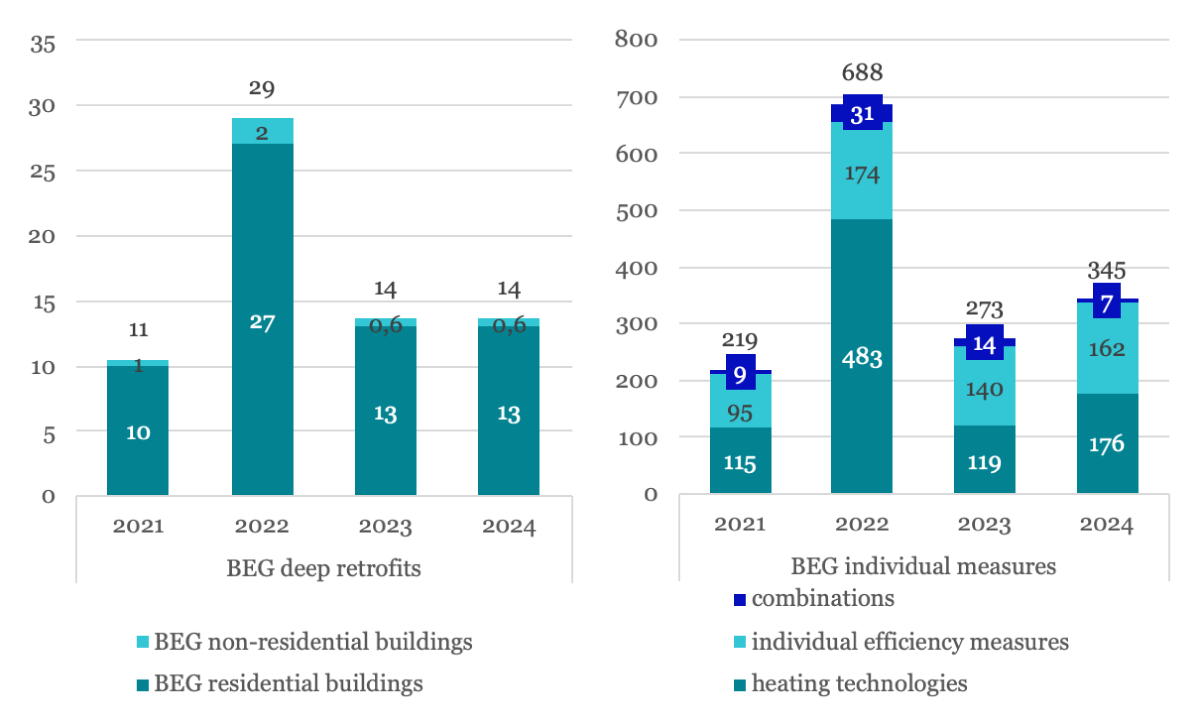
Figure 3
Funding cases BEG (2021–2024) in thousands.
Source: Own representation based on BEG evaluation reports (2021–2024).
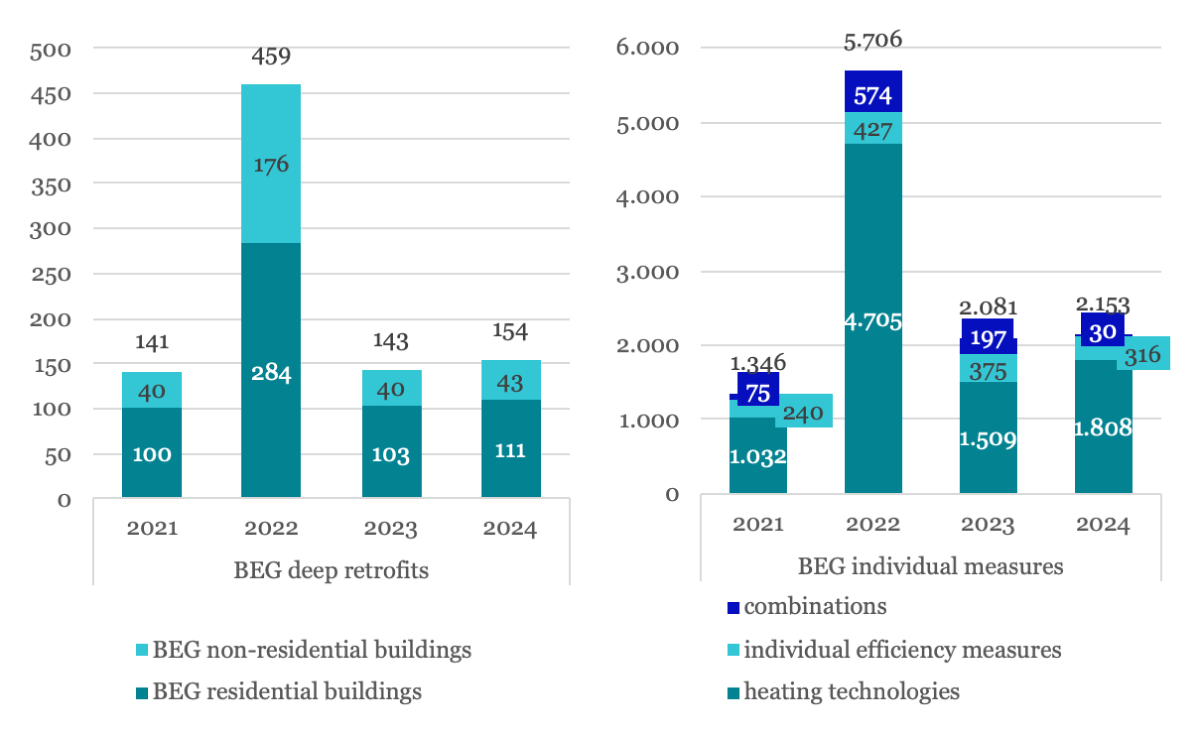
Figure 4
Greenhouse gas emissions savings in thousand tCO2e per year.
Source: Own representation based on BEG evaluation reports (2021–2024).
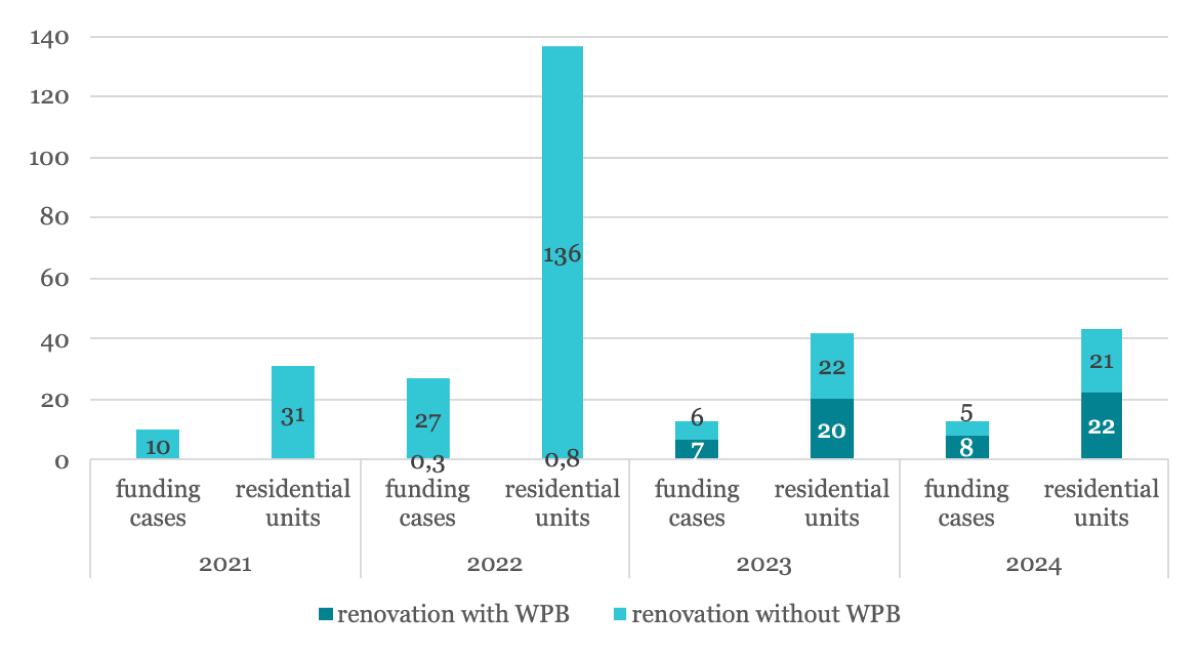
Figure 5
Number of funding cases and residential units for residential buildings with and without WPB in thousands.
Source: Own representation based on BEG evaluation reports (2021–2024).
Table 1
Federal resources in Million Euro and share for cases with and without WPB bonus for residential buildings.
| 2022 | 2023 | 2024 | ||||
|---|---|---|---|---|---|---|
| FEDERAL RESOURCES [€m] | SHARE | FEDERAL RESOURCES [€m] | SHARE | FEDERAL RESOURCES [€m] | SHARE | |
| renovation with WPB | 27 | 0.4% | 807 | 71.2% | 877 | 72.5% |
| renovation without WPB | 6,038 | 99.6% | 326 | 28.8% | 333 | 27.5% |
| total | 6,066 | 100.0% | 1,132 | 100.0% | 1,210 | 100.0% |
[i] Source: Own representation based on BEG evaluation reports (2021–2024).
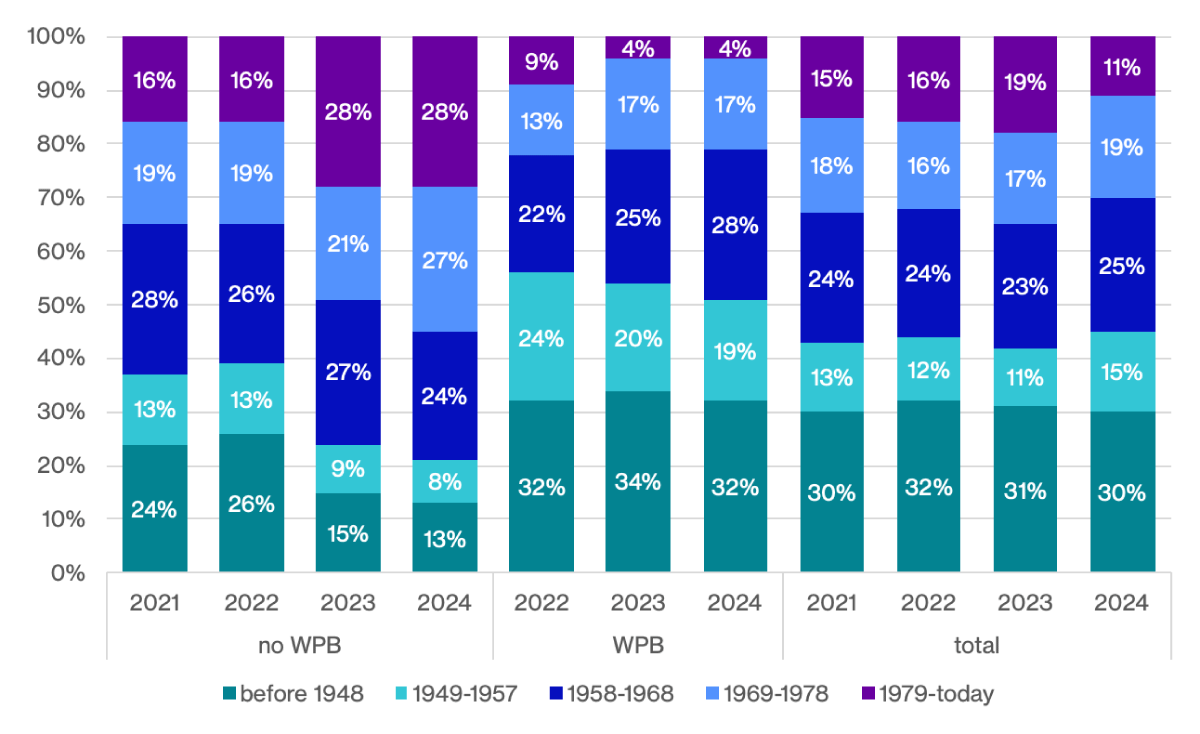
Figure 6
Distribution of construction years for EH40, EH55 and EH70 with and without WPB-bonus for residential buildings (2021–2024).
Source: Own representation10 based on BEG evaluation reports (2021–2024).
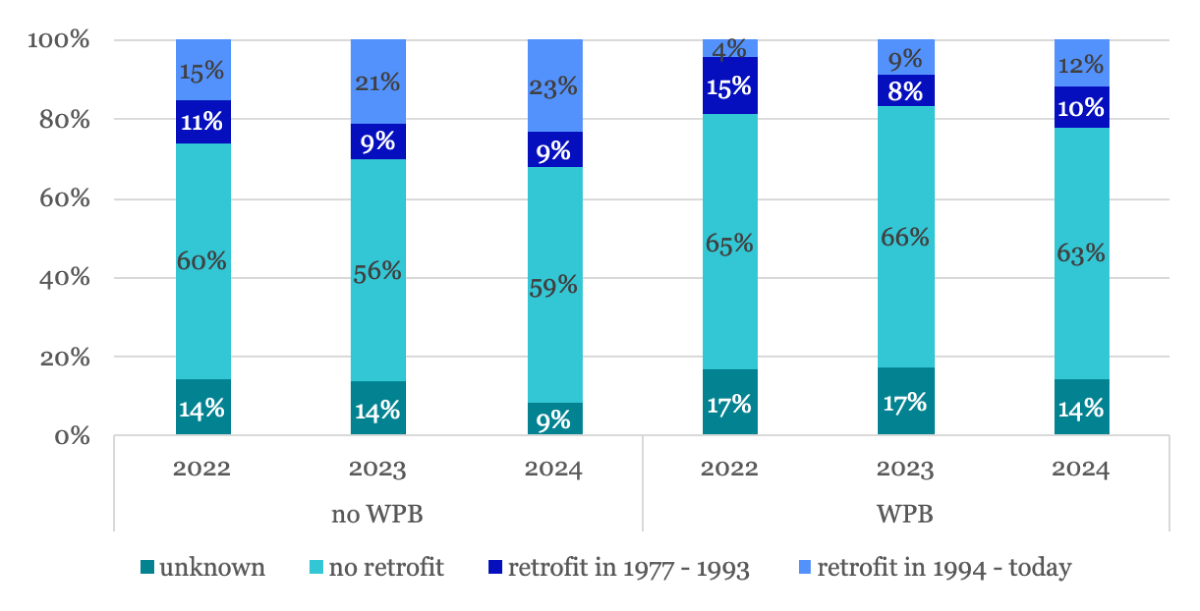
Figure 7
Renovation status of funded residential buildings, divided into buildings with WPB and without WPB.
Source: Own representation11 based on BEG evaluation reports (2021–2024).
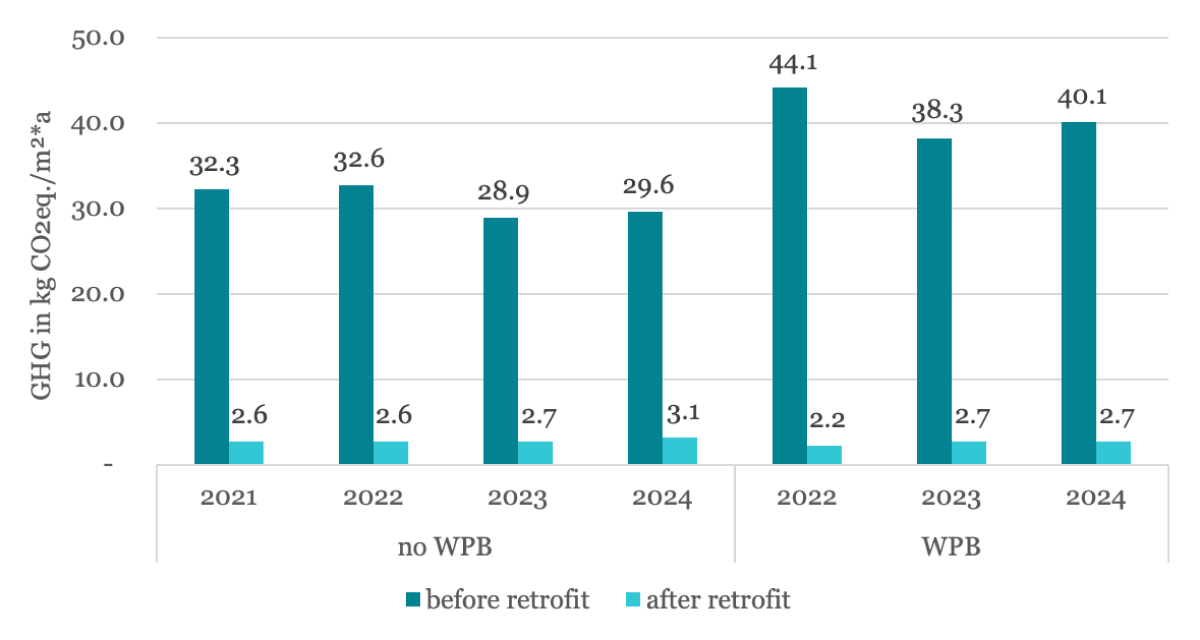
Figure 8
Average value of the greenhouse gas emissions caused by the energy consumption before and after the retrofit of residential buildings.
Source: Own representation12 based on BEG evaluation reports (2021–2024).
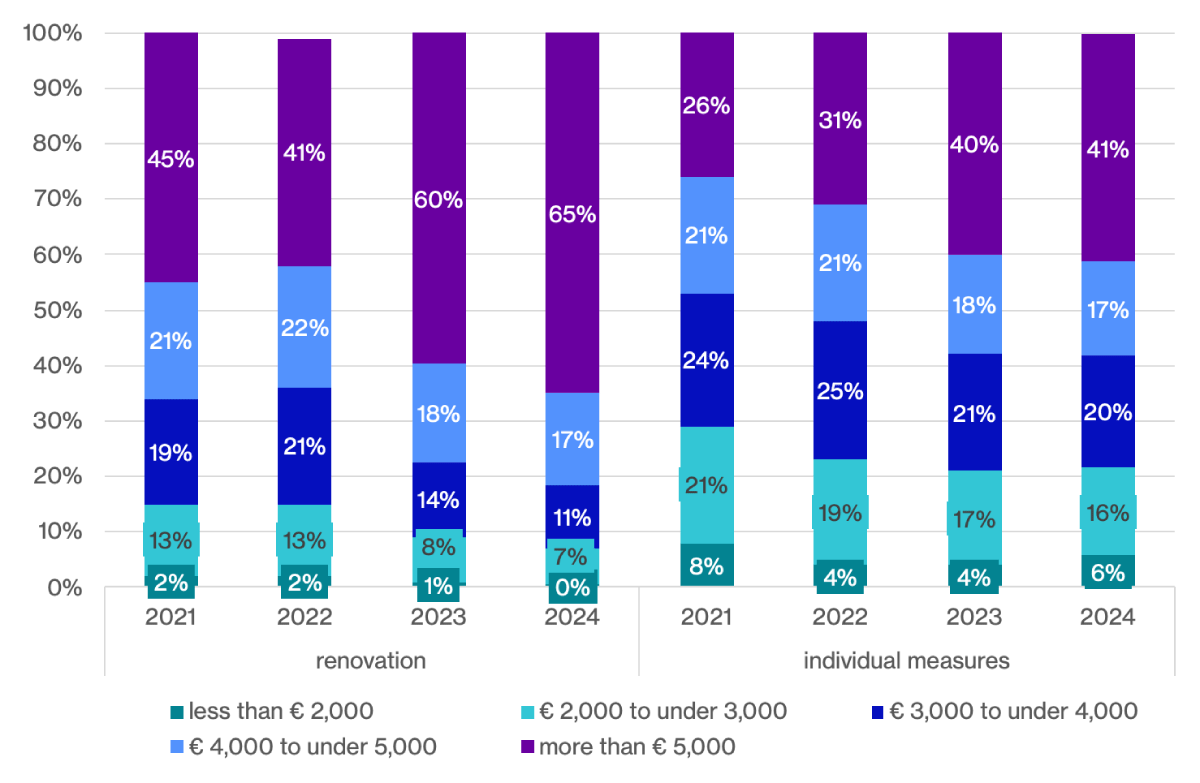
Figure 9
Net monthly household income.
Source: Own representation based on BEG evaluation reports (202113–202414).
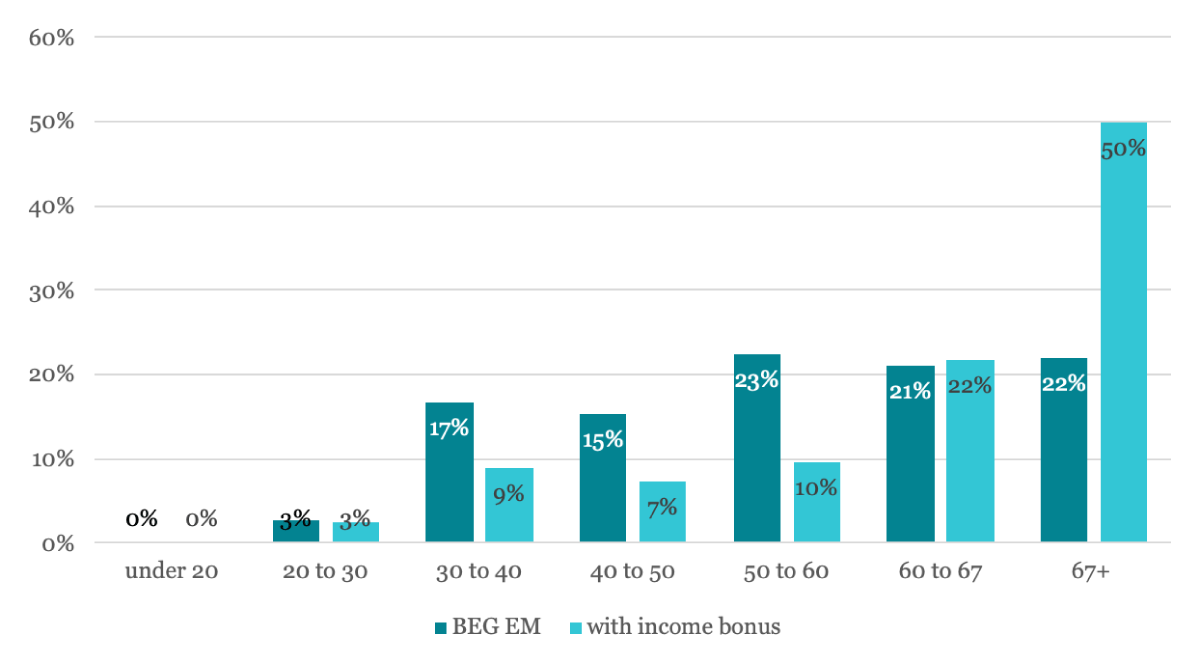
Figure 10
Share of age groups of the whole BEG EM and of the people that gained the income bonus.
Source: Own representation based on BEG evaluation reports (2021–2024)17,18.
| PRIMARY ENERGY FACTORS (ELECTRICITY AND DISTRICT HEATING: AVERAGE VALUES FOR THE YEARS 2025 TO 2045) | GHG FACTORS WITHOUT UPSTREAM CHAINS (ELECTRICITY AND DISTRICT HEATING: AVERAGE VALUES FOR THE YEARS 2025 TO 2045) [G/KWH] | |
|---|---|---|
| natural gas | 1.1 | 202 |
| biomethane | 1.1 | 70 |
| fuel oil | 1.1 | 266 |
| district heating | 1.1 | 70 |
| electricity | 1.6 | 125 |
| wood | 1.1 | 29 |
[i] Source: Own representation based on BEG evaluation reports (2021–2024).
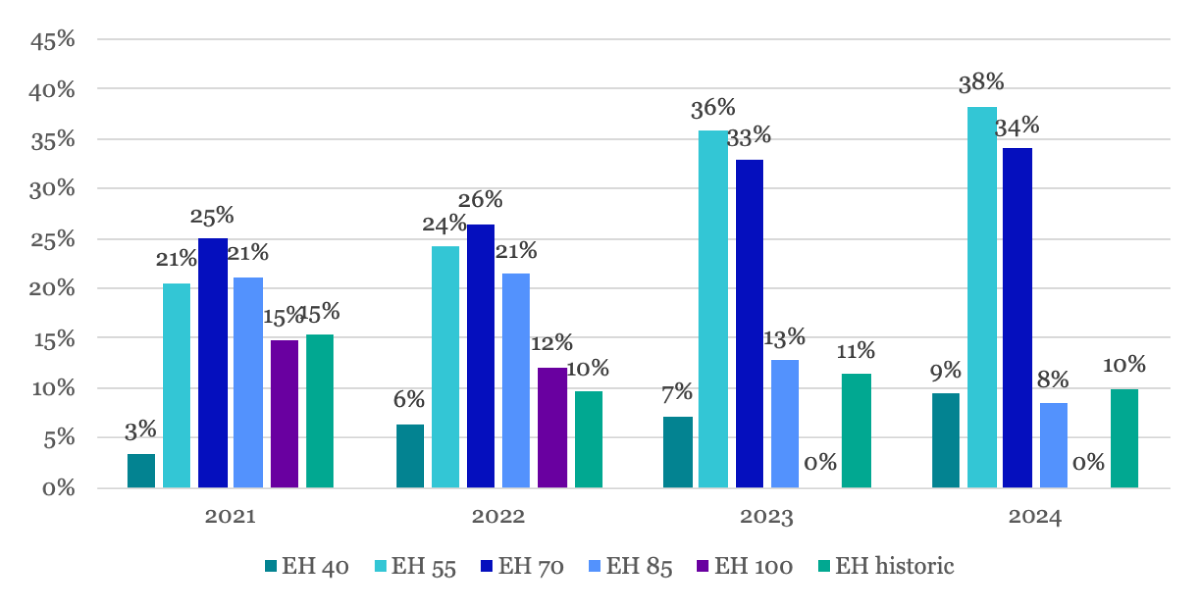
Figure 11
Share of the reached EH-standard in BEG residential buildings.
Source: Own representation based on BEG evaluation reports (2021–2024).20 © Prognos/ifeu/FIW/ITG 2026.