
Introduction
Germany’s building sector accounts for around 35% of national greenhouse gas emissions (GHG). The Federal Funding for Efficient Buildings (BEG) – Germany’s largest federal support programme in this sector – funded approximately 1.6 million energy retrofits with €43 billion between 2021 and 2024, promoting energy-efficiency measures and the installation of renewable heating systems in residential and non-residential buildings.
This paper presents key findings from four years of BEG evaluation (2021–2024), focusing on three aspects:
How changes in the funding regime influenced demand, including anticipation effects and technology-specific dynamics for heat pumps and biomass heating.
The Worst Performing Building (WPB) bonus, introduced in mid-2022, which by 2023 applied to around half of all funded complete renovations. The paper assesses its contribution to energy savings.
The social distribution of BEG uptake, which skews towards higher-income households. The low-income bonus introduced in 2024 is examined, including its reach and barriers.
Methods and data
In 2021, the Federal Ministry for Economic Affairs and Energy (BMWE) commissioned the evaluation of the BEG for funding years 2021–2025. As legally required under § 7 BHO, it covers target control, effectiveness evaluation, and cost-benefit analysis, and addresses key questions and recommended actions by the BMWE. Results follow the accounting conventions of the national energy balance and the BMWE methodology guideline (Fraunhofer ISI et al., 2020).
The BEG, introduced in 2021 and managed by Credit Institute for Reconstruction (KfW)1 and Federal Office for Economic Affairs and Export Control (BAFA) comprises three renovation sub-programmes2,3: BEG residential buildings (systemic renovations of existing residential buildings to efficiency house standards4, via credits, repayment deductions, or grants), BEG non-residential buildings (same scope and instruments for non-residential buildings), and BEG individual measures (single-measure renovations of residential and non-residential buildings, via grants).
The analysis draws on annual funding data provided exclusively to the project consortium by KfW and BAFA. For BEG residential, non-residential buildings and heating technologies, funding cases are allocated by approval year. For BAFA-managed individual measures, submitted-but-unprocessed applications are used from 2022 onwards due to processing backlogs. A cancellation rate is applied to avoid overestimating funding effects. Additional data stem from an online survey. Unless stated otherwise, all quantitative results are based on the annual BEG evaluation reports 2021–2024 (Prognos, ifeu, FIW, ITG 2022a–2025c).
Energy and GHG savings are calculated using building models by FIW and ITG (dena 2021, pp. 231–240), combining online survey data with energy demand calculation methodology on a case-by-case basis, then projected to programme-level totals (Fraunhofer ISI et al., 2020). For electricity and district heating, the primary energy and GHG factors are average values for the years 2025 to 2045 and thus account for a future scenario for the decarbonisation of energy carriers (see Appendix). A demand-versus-consumption comparison for residential buildings follows IWU (2019).
Results and discussion
Changes to the funding regime and funding balance
This paragraph addresses how changes to the funding regime affected the funding balance and whether the programme develops a steering effect for market participants. Results show that funding regime changes significantly influenced project numbers, while external crises had a less pronounced impact.
Figure 1 shows BEG funding conditions for retrofits from 2021 to 2024 (funding intensities in %). For complete retrofits, different efficiency house standards (EH classes) are funded, with lower EH numbers indicating stricter requirements (EH 40 being the most demanding). Beyond the basic EH-class funding, bonuses are available for renewable energy use (EE class), sustainable renovation (NH class), Worst Performing Buildings, serial renovation, and Individual Renovation Roadmaps (iSFP). New-built was part of the programme until 2022 and is shown for reference only.
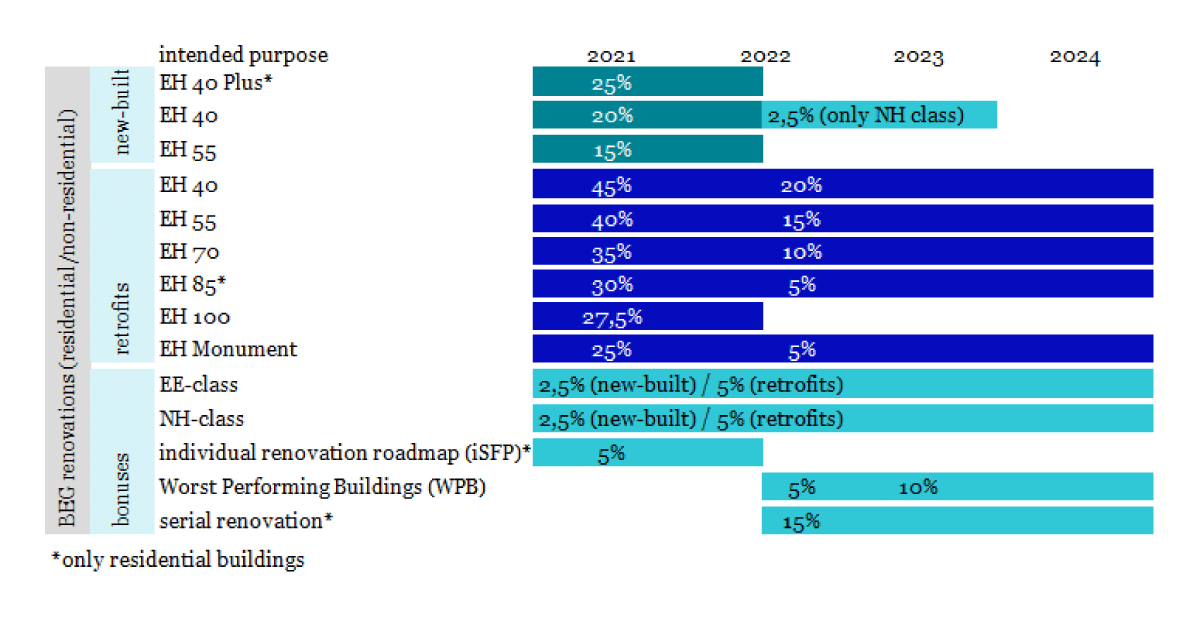
Figure 1
Development of funding conditions for renovations (funding intensities in percentages).
Source: Own representation based on BEG evaluation reports (2021–2024).
Figure 2 shows the funding conditions for individual measures. Efficiency measures concerning the building envelope, technical building systems as well as heating optimizations are being funded. Additionally, the installation of new heating technologies forms part of the funded individual measures. As of mid-2022, only heating technologies using renewable energies are eligible. In addition, bonuses for the exchange of fossil heating systems and the iSFP are granted. The Individual Renovation Roadmap is intended to encourage several individual measures to lead to a complete retrofit over the years. In 2024, funding conditions for new heating technologies were improved. The funding intensities were increased and new bonuses introduced to hasten the exchange of fossil heating systems (climate speed bonus) and to fund self-occupying applicants with low income. The bonuses are cumulative, up to a maximum total funding intensity of 70%.
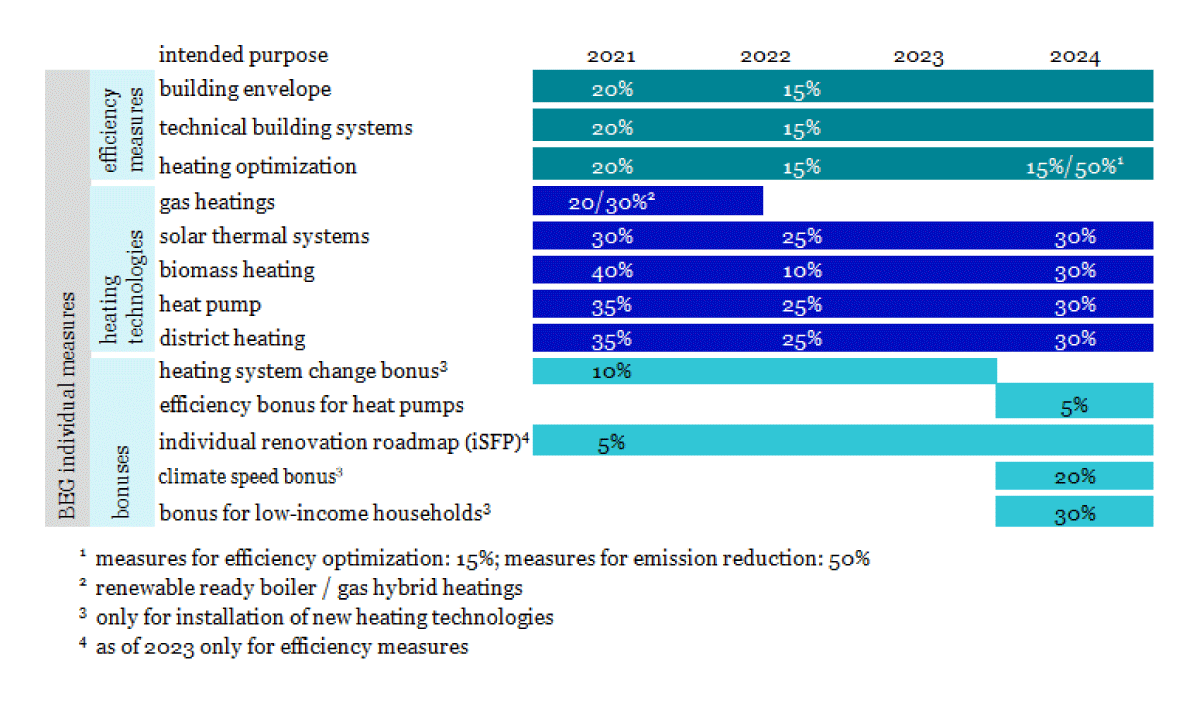
Figure 2
Development of funding conditions for individual measures (funding intensities in percentages).
Source: Own representation based on BEG evaluation reports (2021–2024).
The most important changes to the funding regime and their demand effects:
New-build funding was transferred to the Federal Ministry of Housing, Urban Development and Building¹ in 2022 and is not part of this evaluation.
Funding intensities for complete renovations were reduced in 2022, triggering a strong anticipatory effect before the cut and a subsequent decline. Cases stabilised in 2023 and 2024 at 2021 levels, partly attributable to the WPB bonus (introduced 2022, applied to 50–60% of cases in 2023–2024, + 10% intensity).
Individual measures saw the same intensity reduction in 2022, with a more pronounced anticipatory effect – 240,000 applications in a single month – likely because individual measures are faster to plan and implement than complete renovations.
In 2024, heating technology funding intensities were raised considerably and two cumulative bonuses introduced (low-income and climate speed), enabling up to 70% total intensity. Heating technology cases grew ~20% vs. 2023, though the full effect was dampened by delayed implementation within 2024 and a 50% reduction in eligible costs.
Technical minimum requirements for heat pumps and biomass systems were tightened, reducing biomass uptake.
The following paragraph illustrates the described changes to the funding regime based on the funding balance. Figure 3 shows the funding projects from 2021 to 2024. On the left, complete retrofits5 are shown for residential and non-residential buildings while on the right, individual measures6 are displayed. Both the financial volume as well as the required period for the retrofit are higher than for individual measures.
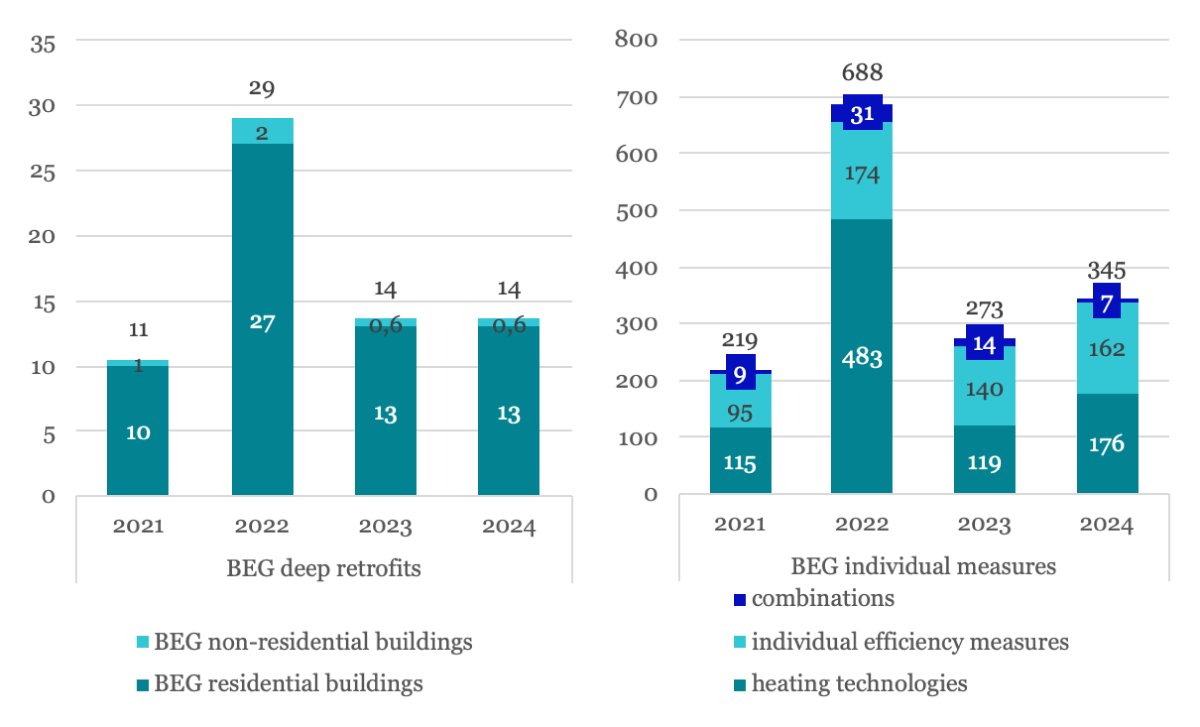
Figure 3
Funding cases BEG (2021–2024) in thousands.
Source: Own representation based on BEG evaluation reports (2021–2024).
Over the years 2021 to 2024, 1.6 million retrofits were funded with BEG. The majority can be allotted to individual measures (96% of all cases). In 2022, over 0.7 million cases were funded. In comparison, in 2024 approximately 0.4 million cases were funded, as shown in Figure 3. 2022 represented an exception for all subprogrammes as described above.
In particular, the installation of new heating technologies plays a crucial role in the funding dynamic. These cases represent 45–70% of individual measures. Most of the other individual efficiency measures are renovations concerning the building envelope. Combinations of heating technologies and other individual efficiency measures occur as well. Most complete renovations occur in residential buildings. In 2024, a total of 14,000 complete retrofits were funded.
Over the years, 2022 shows the most funding projects for BEG individual measures with a decline in 2023 and an increase of around 20% compared to 2023 in 2024. BEG residential buildings show rather high case rates in 2022, while cases in 2021, 2023 and 2024 are on a similar level with around 10,000 to 13,000.
The federal resources spent on the BEG programme show a similar dynamic as the funding projects. Overall, €43 billion were spent on retrofits from 2021 to 2024. Individual measures account for the majority (66% of federal resources). In 2024, €7 billion of federal resources are allotted. Over the years, the federal resources exhibit a similar dynamic as the funding projects with the majority of federal resources being spent in 2022 (€23 billion). In contrast to the funding projects in 2023 and 2024, BEG individual measures show a slight decline in federal resources from 2023 to 2024, whereas federal resources for BEG residential and non-residential buildings increase slightly in the same period.
Overall, the greenhouse gas emissions savings add up to around 12 million tCO2e for the years 2021 to 2024. In 2022, approximately 6 million tCO2e were reached. The majority of greenhouse gas emissions savings can be attributed to individual measures (93%). Over the years, the greenhouse gas emissions savings as shown in Figure 4 follow a similar trend as the funding cases and the federal resources. For all three sub-programmes, the savings are highest in 2022, while being rather stable in the other years for residential and non-residential buildings. The savings of individual measures remain on a significantly higher level in 2023 and 2024 than in 2021.
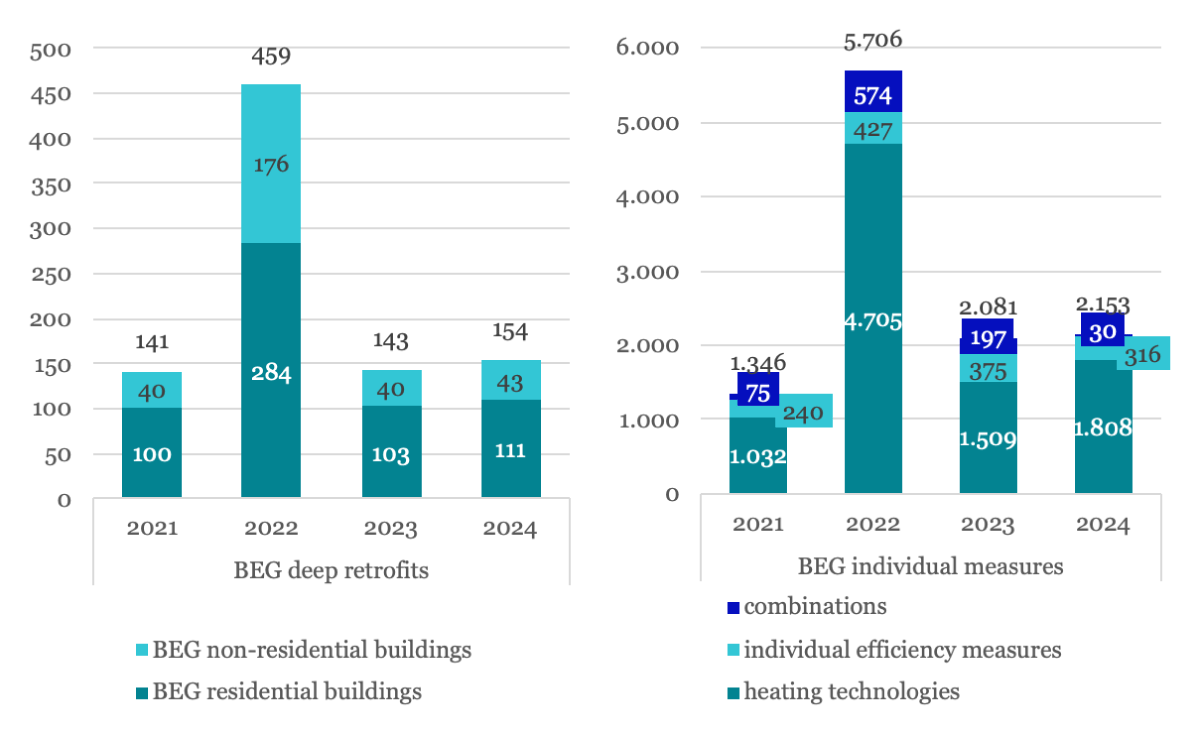
Figure 4
Greenhouse gas emissions savings in thousand tCO2e per year.
Source: Own representation based on BEG evaluation reports (2021–2024).
To illustrate trends in heating technologies, key aspects of funding projects and technical requirements are described below, showing how funding changes correspond with technology uptake.
Heat pumps grew steadily in popularity, from 37% of heating technology funding cases in 2021 to 78% in 2024. In 2024, they accounted for 51% of GHG savings in BEG individual measures for heating technologies (~138,000 cases), compared to 24% for biomass systems (~25,000 cases). More stringent performance requirements for air-to-water heat pumps were introduced in 2024 (ηs at 35 °C: 145% vs. previously 135%; ηs at 55 °C: 125% vs. 120%), with no noticeable effect on uptake as most installations already met the new thresholds.
Funded biomass boilers varied strongly between years: 49,000 cases (33%) in 2021, rising to 132,000 (17%) in 2022, dropping sharply to 4,900 (3%) in 2023, and recovering to 25,000 (13%) in 2024. CO2-equivalents followed the same pattern, from 610,000 tCO2e (38%) in 2021 to 240 tCO2e (11%) in 2023 and 511 tCO2e (22%) in 2024. The high final energy consumption of ≈10,200 GWh in 2022 – approximately 10% of total national biomass boiler consumption (UBA 2022) – raised concerns about biomass availability, prompting a tightening of particulate matter emission requirements in 2023 (maximum permissible value lowered by 84%). This caused final energy consumption to drop by 98% to 236 GWh. Requirements were eased again in 2024, increasing consumption by 700% to ≈1,700 GWh. The 2023 drop was likely compounded by a simultaneous reduction in the funding rate for replacing fossil heating systems.
Overall, changes to the funding regime show a measurable, systematic influence on retrofit decisions, technology choices, and the socio-economic profile of beneficiaries. Changes to funding intensities and eligibility rules produced clear short-term behavioural responses, while technical requirement adjustments also had perceptible effects. The BEG thus develops a steering effect, though it operates within a broader energy-policy environment shaped by legal requirements, rising construction costs, and the energy price crisis triggered by the war in Ukraine.
Despite lower funding intensities from 2023 onwards, demand stabilised rather than collapsed. The online survey indicates that recipients are primarily motivated by energy cost reduction, climate protection, and building value preservation – intrinsic and economic motivations that persist across changing funding conditions. Strong anticipation effects in 2022 were followed by temporary declines but no sustained reduction in activity, suggesting that market actors can adapt once a minimum funding level is maintained. This underlines both the sensitivity of recipients to abrupt programme changes and the importance of stable, predictable funding conditions for investment decisions.
Worst performing building bonus in BEG residential buildings
This section examines the development and impact of the Worst Performing Building (WPB) bonus. The results shown here, constitute a deeper analysis than shown in the evaluation reports. The analysis draws on funding data, survey responses and calculations based on the building model. This model follows the described method (chapter Methods) for GHG savings (shown in kgCO2e/(m²*a)). It is shown that older and lower-quality buildings take advantage of the bonus, these buildings achieve greater greenhouse gas emissions reductions, and that the bonus worsens slightly the efficiency of the subsidy program.
The WPB bonus (see Figure 1) was introduced in autumn 2022 for buildings with high initial energy consumption achieving efficiency house standard (EH) 40, 55 and 70. This rules out the higher efficiency house standard, allowing the bonus to provide higher retrofit depth. A building qualifies as a worst performing building if it meets one or two of the following criteria. First, it may hold an energy efficiency class H according to the German Building Energy Act, corresponding to final energy consumption exceeding 250 kWh/(m²*a). Second, a building is classified a WPB if it was constructed before 1957 and with at least 75% of its façade lacking energy-related renovation. These criteria ensure that the building falls within the worst 25% of the German building stock in terms of energy performance.
The following figure (Figure 5) shows the development of the WPB bonus over the years since its introduction in 2022 for residential buildings. In 2022, the number of funding cases as well as residential units with WPB bonus is low with only around 250 cases.7 This is because the bonus was introduced relatively late in 2022 and not well known overall. The rate of funding cases and residential units with WPB bonus increased drastically in 2023, reaching a share of 53% of all BEG residential fundings in the same year. In 2024, the share rose up to 63% of funding cases with WPB bonus thus reaching more cases than the funding without WPB bonus.
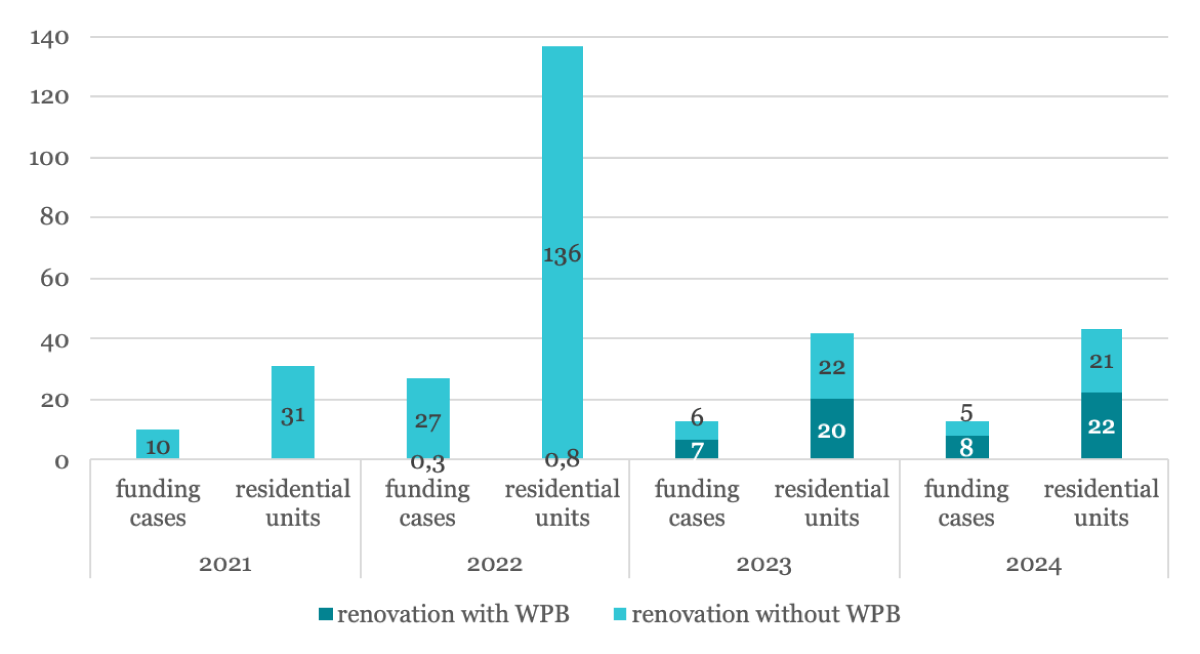
Figure 5
Number of funding cases and residential units for residential buildings with and without WPB in thousands.
Source: Own representation based on BEG evaluation reports (2021–2024).
The share of residential units with WPB bonus is 48% in 2023 and 52% in 2024. In both years the buildings with WPB bonus have a lower number of residential units (2023: 2.9, 2024: 2.8) than the share of all applications. The buildings in 2022 have more residential units compared to the other years with 5.1 residential units per funding case on average (2021: 3.1; 2023: 3.3; 2024: 3.4). Reasons for this may be that there were more commercial applicants in 2022, which usually account for more residential units per building. This illustrates the tendency that buildings with WPB have a lower number of residential units and are thereby smaller.
Table 1 shows the federal resources for funding cases with and without WPB. Over the years, the share increases, from under 1% in 2022, the year the bonus was introduced to 73% in 2024. Compared to the share of funding cases the share of federal resources is higher since the applicants with WPB bonus receive 10% more funding.
Table 1
Federal resources in Million Euro and share for cases with and without WPB bonus for residential buildings.
| 2022 | 2023 | 2024 | ||||
|---|---|---|---|---|---|---|
| FEDERAL RESOURCES [€m] | SHARE | FEDERAL RESOURCES [€m] | SHARE | FEDERAL RESOURCES [€m] | SHARE | |
| renovation with WPB | 27 | 0.4% | 807 | 71.2% | 877 | 72.5% |
| renovation without WPB | 6,038 | 99.6% | 326 | 28.8% | 333 | 27.5% |
| total | 6,066 | 100.0% | 1,132 | 100.0% | 1,210 | 100.0% |
[i] Source: Own representation based on BEG evaluation reports (2021–2024).
To assess the impact and the characteristics of buildings receiving the WPB bonus in detail, the year of construction is analysed in depth. Figure 6 shows the distribution of construction years for funding cases with and without WPB bonus.8 In general, buildings with WPB bonus are significantly older than other buildings. The figure shows that a large share with over 50% of buildings with WPB are constructed before 1957. In the group without WPB this share is only 20% to 37%. The youngest buildings (1979–today) appear as smaller segments but with a significant difference between buildings with and without WPB bonus.
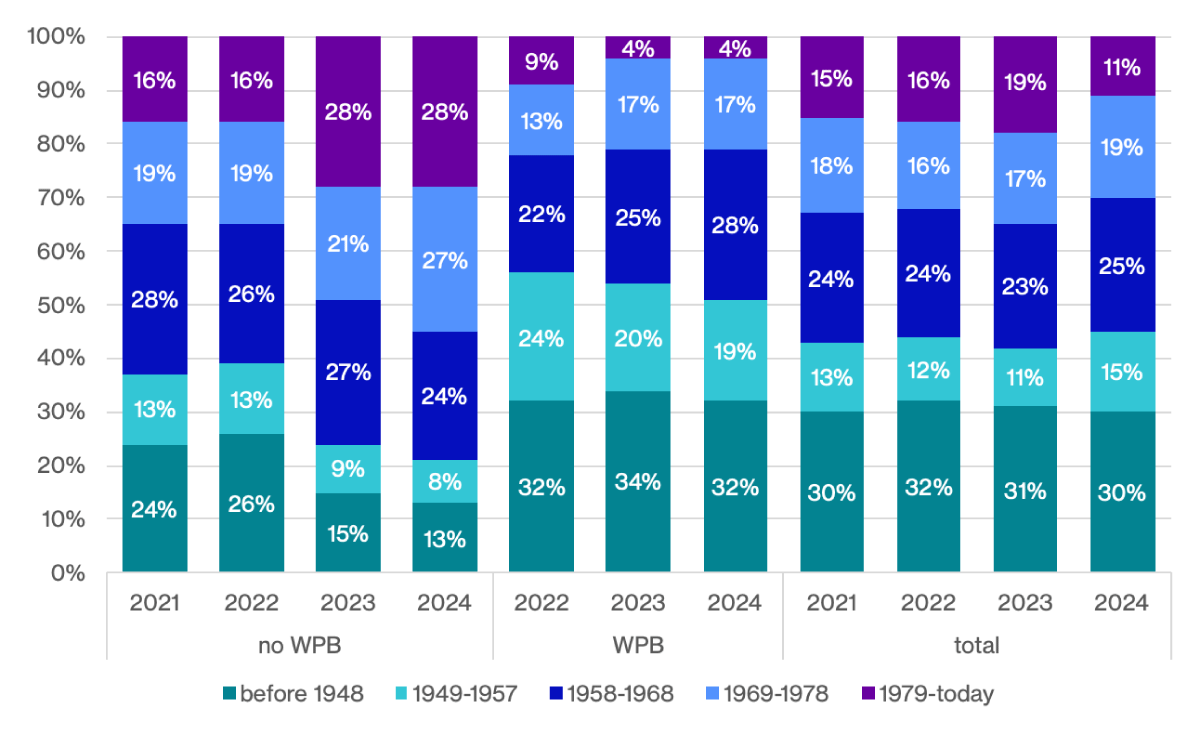
Figure 6
Distribution of construction years for EH40, EH55 and EH70 with and without WPB-bonus for residential buildings (2021–2024).
Source: Own representation10 based on BEG evaluation reports (2021–2024).
The age of the residential buildings in the whole funding programme (Figure 6) shows a stable distribution of construction years. Interestingly, the buildings funded in 2024 are slightly older. This can be seen in the share of buildings built after 1979, which decreases from 19% in 2023 to 11% in 2024. There is no significant change of building age in the year 2023, where the WPB bonus is already in use.
In addition to the construction year, the year of the last renovation before the funding is an indicator for the energetic quality of a building. Unrenovated buildings constitute most of the buildings in BEG.
Figure 7 shows the percentage of renovation years from 20229 to 2024 for buildings with and without WPB bonus. If the buildings get a WPB bonus, it is more likely that the building is not renovated or the person who applies for the funding doesn’t know about the renovation status (overall: 68% to 83%).
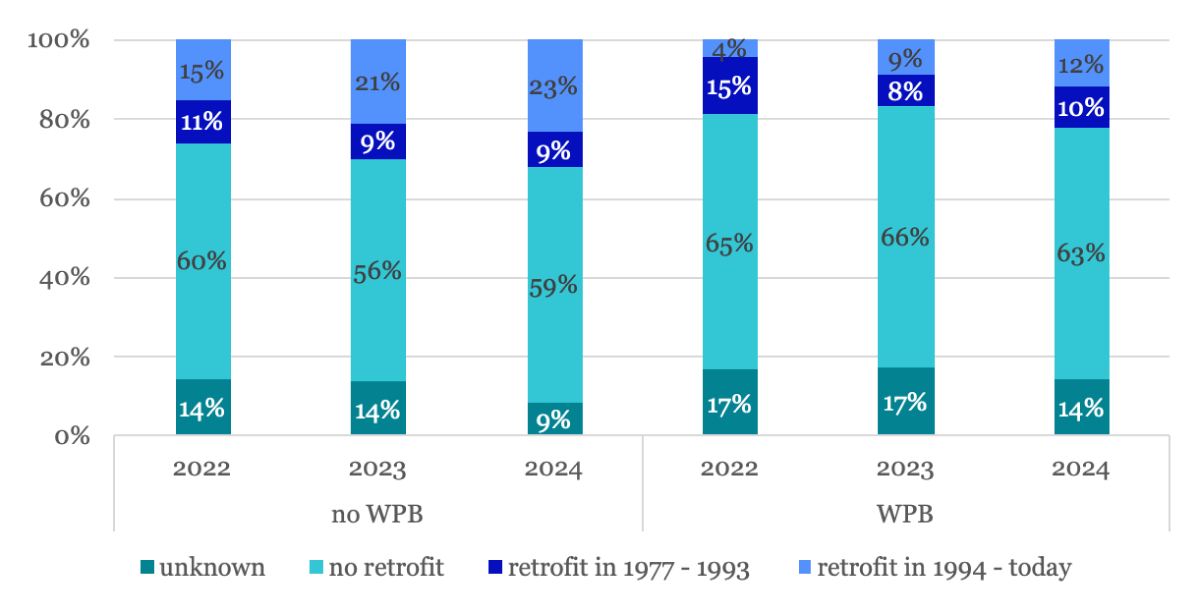
Figure 7
Renovation status of funded residential buildings, divided into buildings with WPB and without WPB.
Source: Own representation11 based on BEG evaluation reports (2021–2024).
The analysis of building age and renovation status indicates that the WPB bonus successfully reaches the buildings for which it is designed. In the years 2023 and 2024, the share of buildings with a WPB bonus constructed before 1957 is over 50%, whereas this share is around 20% for buildings without the bonus. In addition, 66% (2023) and 63% (2024) of these buildings have not been retrofitted before the funding.
The effectiveness is assessed by looking at energy consumption before and after the retrofit. As shown in Figure 8 buildings with WPB have systematically higher greenhouse gas emission levels before the retrofit and reach around the same GHG level after retrofit. Because of the higher initial emissions in WPB buildings, the achieved savings are higher as well. WPB have a significantly higher environmental impact and the retrofit achieves larger absolute greenhouse gas emissions reductions.
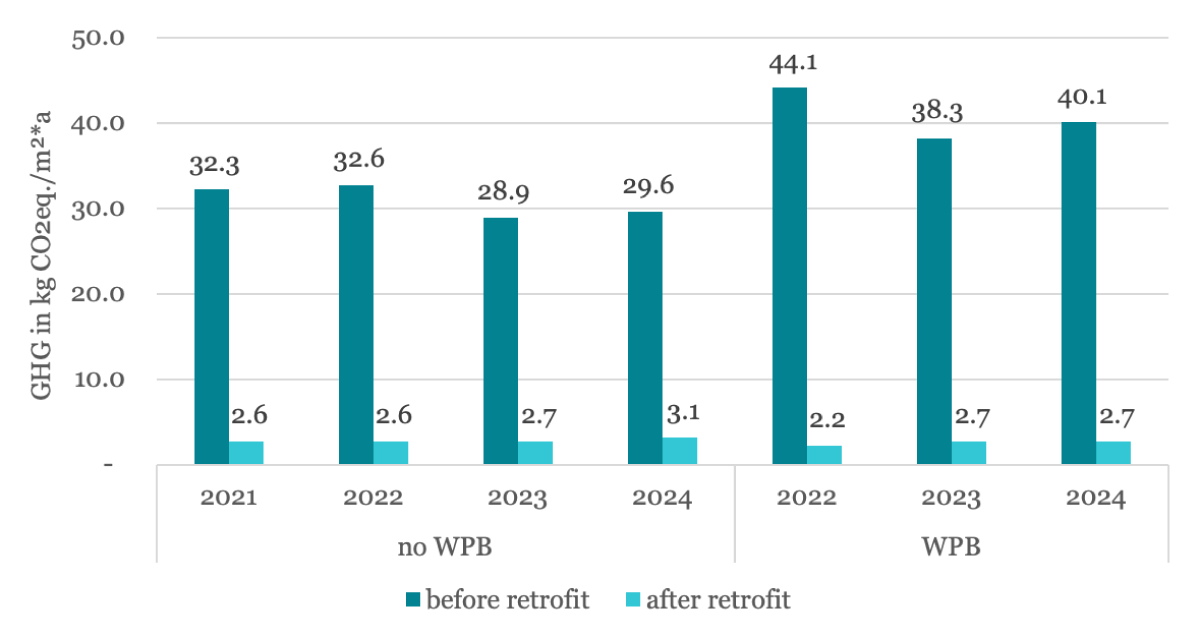
Figure 8
Average value of the greenhouse gas emissions caused by the energy consumption before and after the retrofit of residential buildings.
Source: Own representation12 based on BEG evaluation reports (2021–2024).
The funding efficiency measures how effectively the funding instrument delivers on its objective, in this case greenhouse gas emission reductions. It is calculated dividing federal resources by greenhouse gas emissions savings over the effective period of 20 years. In 2023, funding efficiency amounts to €1,013/tCO2e for cases without the WPB bonus €1,116/tCO2e for cases with the WPB bonus. In 2024, the funding efficiency converges to roughly €885/tCO2e in both groups. For the years under review, the costs for emission savings are a little higher (2023) or the same (2024) with WPB bonus compared to cases without. Further analysis of the funding efficiency with more data from upcoming years could show the distribution within the energy efficiency class.
The WPB bonus is an effective instrument for targeting highly inefficient buildings. It targets older and predominantly unrenovated stock, resulting in higher greenhouse gas savings per case. Its design enhances renovation quality. At the same time, the bonus achieves these additional savings without significantly increasing total funding efficiency. A detailed analysis using more data could show the funding efficiency distinct into efficiency house standard. The WPB bonus does not significantly shift the overall age distribution of funded buildings. Given these findings, the WPB bonus appears justified as a structural element within the BEG, though its potential could be further enhanced by refined targeting criteria, improved communication, and extension to BEG individual measures.
Social aspects of BEG
The main questions addressed in this paragraph concern motivations, impediments, and effects regarding specific target groups, as well as the implementation and first results of the bonus for low-income households. Focus of this chapter are the effects of the bonus, i.e. its influence on
socioeconomic aspects of the BEG
the installation of new heating systems.
The following analyses are mostly based on the conducted online survey among the recipients of the subsidy. Since the survey was incrementally changed accompanying the changes to the funding regime, the use of aggregations or weighted means was necessary for better comparisons over the years. The analysis shows that the income bonus influences the distribution of income and age and its introduction occurs parallelly to the installation of more heating systems compared to recent years.
First, the distribution of income over the evaluated years was considered (Figure 9). For both, complete renovations and individual measures, the share of high-income households increases over the years while the share of low- and middle-income households decreases remarkably. This effect occurs dominantly from 2022 to 2023. From 2023 to 2024 shares remain stable, especially for individual measures. A slight decrease of 1% each can be seen in the groups €2,000 to €5,000 while the lowest income group gained 2% of the total share. This might be an effect of the income bonus. The income bonus is only granted for the change of heating systems, accordingly an influence on the income distribution in the BEG WG programme (renovations in Figure 11) is unlikely.
Furthermore, the development of the income distribution is underlined by the fact that financing problems have been named a relevant impediment before and despite the funding for around 50 to 57% of the respondents in these years. It is supported by the claiming process within the BEG, which requires households to pay for the measure/renovation in advance, the grant is received after they present a statement of use issued by the conducting craft business. The share of households identifying financing issues as relevant decreases significantly for high-income respondents. As complete renovations require a significantly higher single invest compared to a series of individual measures the financial impediments of one-stop renovations for low-income households are significantly higher than for higher income households. Regarding complete renovations the income distribution has shown a distinct shift towards higher incomes from the first year of evaluation on. This shift grew clearly from 2022 to 2023, which can be explained by the exclusion of new buildings from the BEG.
Regarding the age groups of the applicants, an increase in retirees from 16% in 2021 to 22% in 2024 can be observed over the years for individual measures. Again, the most distinct increase occurred from 2022 to 2023, when the funding for new buildings was excluded from the BEG programme. For complete renovations the share of retired people decreased by 2%-points from 2022 to 2023, after the decrease in funding for complete renovations from 2021 to 2022 took its full effect. Most applicants were and are of working age. In residential buildings, retirees conduct individual measures more often compared to complete renovations. In 2024, 22% of the renovations were conducted by retirees, whereas 2% of the complete renovations were conducted by this age group. This reflects the life situation of retirees who often renovate only what seems strictly necessary, which may be due to financial or strategic reasons. In contrast, funding recipients of working age are more likely to conduct a complete renovation for reasons such as buying an existing building or planning to have a baby.
Another important social aspect is education. Over the years, about 50 to 60% of recipients hold a university degree. This share has risen for both complete renovations and individual measures. The second largest share is represented by recipients with completed vocational training (20 to 30%). Across both funding programmes and along the evaluated timespan education and income of the recipients mostly correlate.
Factors driving the distribution of age and income groups among the recipients are tied to changes in the funding regime. The most remarkable change in income and age distribution occurred from 2022 to 2023 (Figure 9). In 2022, a funding stop was announced which caused a high degree of uncertainty among applicants. The survey shows that after the programme’s restart, especially lower-income households were hesitant to invest in a renovation measure. The uncertainty and increasing construction costs (by approximately 14% between 2022 and 2023 (Destatis 2026b)) are the main impediments for low-income groups according to the survey in 2023 and 2024. As younger recipients are more likely to build new buildings (family phase, starting early to settle a loan) and new buildings are no longer a part of the present evaluation since 2023, the change of the age distribution within the BEG might be explained.
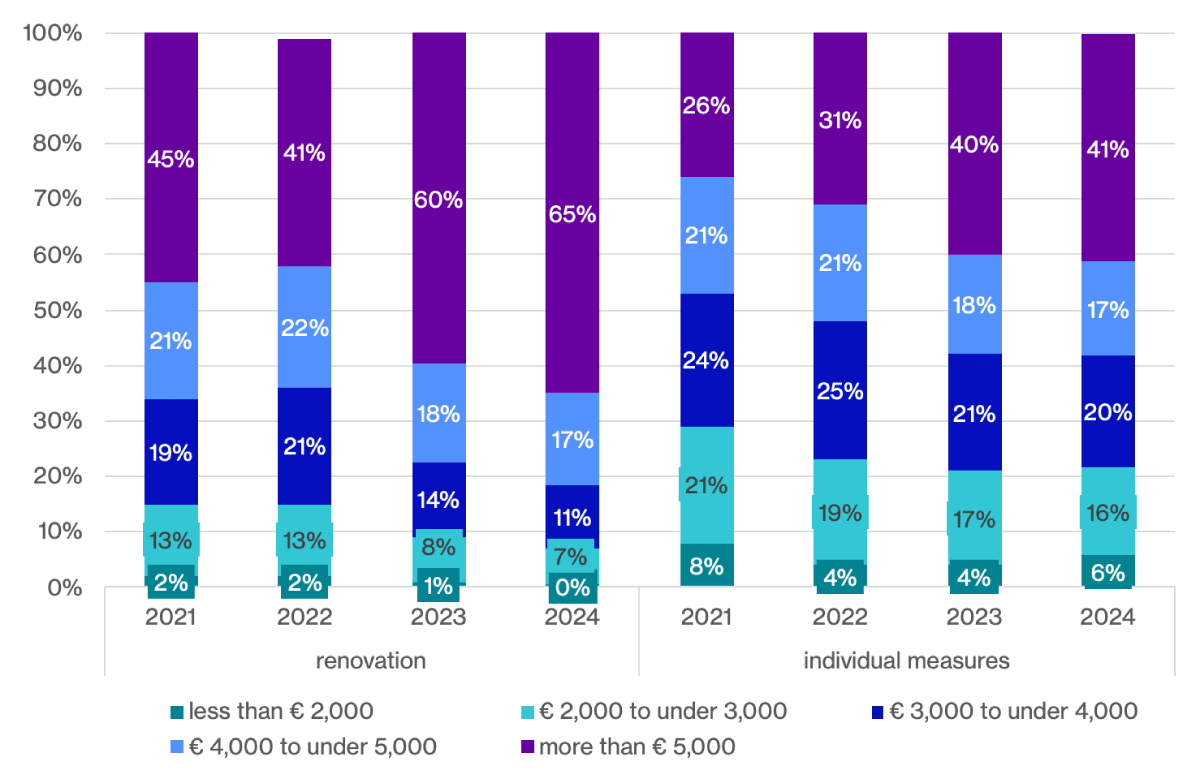
Figure 9
Net monthly household income.
Source: Own representation based on BEG evaluation reports (202113–202414).
Furthermore, the increase in high-income households occurs parallel to an increase in retirees as recipients. This may seem contradictory at first glance, but retirement is not correlated with higher income in Germany (Destatis 2026a), while wealth is. In the age group of 65–74, where Germans have usually just retired, show a significantly higher wealth than younger age groups (Niehues & Stockhausen 2025). Wealthier people and people with high incomes will have less problems financing a renovation measure; therefore, they don’t need an additional bonus. The evaluation shows that the BEG absolutely and relatively reaches less people with lower incomes every year. This development does not continue regarding individual measures from 2023 to 2024, when the income bonus was introduced.
To support homeowners with the replacement of their heating system, a bonus for low-income households15 was introduced in 2024. The bonus is granted in owner-occupied buildings or dwellings for the installation of new heating systems if the recipient can prove a yearly taxable household income lower than €40,000.16 There is no official statement on why landlords are excluded from this bonus by now. It seems probable that the bonus was intended to reach as many people as possible whilst not increasing the complexity of the funding programme too much. As private homeowners are the largest group within the BEG and can verify their yearly taxable income easily through their tax bill, both targets are met by, for now, only granting the income bonus for private homeowners.
A large share of households (approx. 80%) receiving the bonus show a monthly net household income lower than the average in Germany (€3,822 in 2024). In 2024, the bonus was granted in approximately 41,000 cases which represents a share of 29% of all cases involving the installation of new heating technologies in the sub-programme BEG individual measures for residential buildings by self-occupying owners. Analyses of the income bonus regarding target groups show that it is mostly granted to retirees (approx. 50%, Figure 10) as well as recipients of working age with a lower educational degree or vocational training. Only 27% of the bonus’s recipients hold a university degree which is considerably less than their overall share (50%).
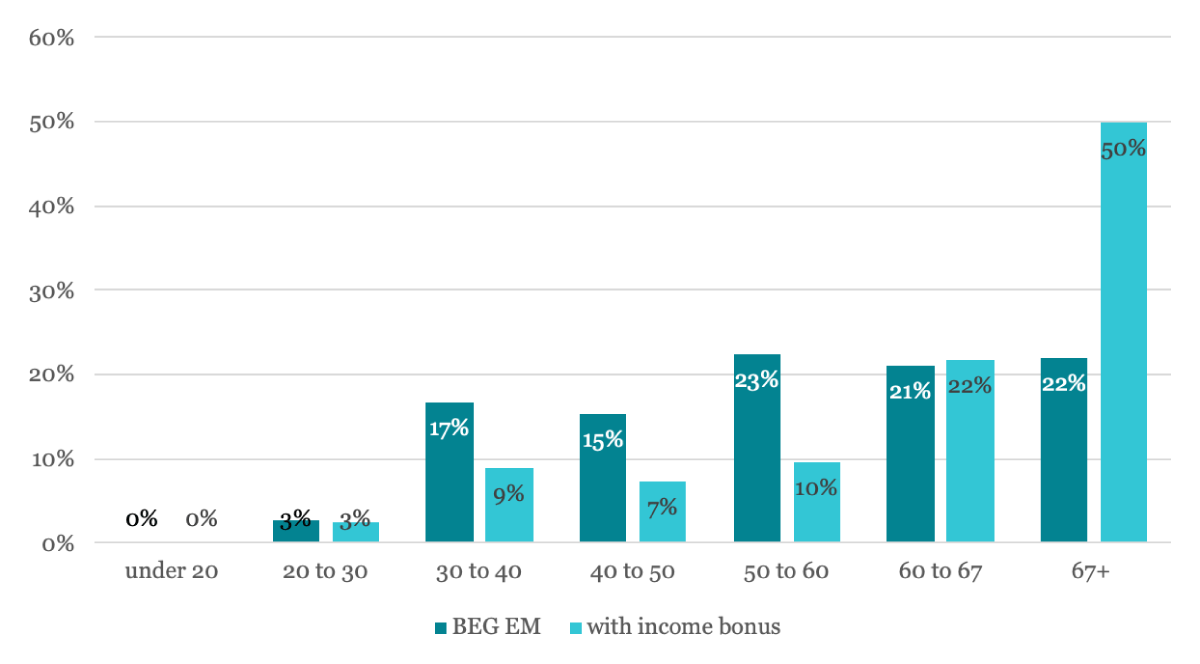
Figure 10
Share of age groups of the whole BEG EM and of the people that gained the income bonus.
Source: Own representation based on BEG evaluation reports (2021–2024)17,18.
An increase in the number of funded installations of new heating technologies occurred parallel to the introduction of the income bonus. Around 30% of recipients installing a new heating technology received the income bonus. In total numbers, this is slightly more than the growth of the total funding cases. It seems likely that the income bonus triggered investments in new heating technologies. However, another new bonus (climate speed bonus; max. 20%) was introduced in 2024. It can be combined with the income bonus. Furthermore, the base subsidy for heating systems was increased from 25% to 30%, making it possible to receive up to 70% subsidy for the installation of new heating technologies, compared to a maximum of 40% in 2023. Parallelly, the maximum eligible cost was cut by 50% to €30,000 per residential unit. However, the maximum eligible cost can still amount to €60,000 per residential unit if there is an individual renovation roadmap for the building.
An impediment analysis for low-income bonus recipient shows that 89% of them would not have conducted the renovation measure at all or at least not to the same scope without the bonus. Furthermore, 87% stated that the volume of the grant was a relevant reason to apply for it. 26% said that the financing impediment was lowered through the funding, however, financing the measure remains a relevant impediment to them.
To holistically regard the income bonus, usually occurring effects need to be taken into consideration. The following effects are determined by a set of questions in the online-survey and calculated according to a specified methodology (Fraunhofer ISI et al. 2020):
deadweight effect: Recipients would have conducted the total renovation also without the funding or at least partially.
anticipatory effect: The funding allows recipients to conduct the measure earlier than without it.
expansion effect: The funding allows recipients to expand their renovation activities to more measures.
spill-over effect: The funding leads to a higher awareness for energy efficiency matters and this awareness is taken even further than the conducted measures.
An analysis of these effects shows slightly higher deadweight effects in high-income groups (over €10,000 net monthly household income). There, a deadweight effect of around 51% is calculated in comparison to the average deadweight effect of 47% for the whole BEG programme and 44% for heating systems funded with the income bonus. A deadweight effect of this height is typical for such funding programmes (Prognos et al. 2022a; Prognos et al. 2022b; Prognos et al. 2022c; Prognos et al. 2023a; Prognos et al. 2023b; Prognos et al. 2023c; Prognos et al. 2024a; Prognos et al. 2024b; Prognos et al. 2024c; Prognos et al. 2025a; Prognos et al. 2025b; Prognos et al. 2025c). The expansion effects increased remarkably for low-income groups (89% for €1,000 to €2,000; 46% for €2,000 to €3,000), while the higher income groups show a lower expansion effect (25% for €4,000 to €5,000 and 15% for >€5,000). Due to the higher anticipatory (+8%), expansion (+16%), and spill-over (+13%) effects of the income bonus, it achieves a clearly higher net effect (93%) compared to the whole BEG programme (83%) and heating systems funded without the income bonus (84%).
Even tough, the income bonus is mainly claimed by retirees, it is likely that the bonus is attractive to people with lower incomes. However, the limit for the income bonus is €40,000 annual taxable income, which might be too low to reach younger people living in owner-occupied property. For comparison, less than 30% of households in single family houses have an income that allows for the income bonus (Zimmermann, Späte & Baharona 2025).19 The income has supported heating system changes mainly in retired households. They more often have an income that’s low enough to be eligible for the bonus. However, the wealth of these households is not controlled, which is a clear weakness if the bonus is meant to support poorer households in general. However, the intention to support private homeowners with the change of their heating system and therefore taking action against climate change is addressed by the bonus, also in its current configuration.
The social profile of BEG recipients reveals persistent imbalances. The programme predominantly supports middle-aged, higher-income, and highly educated households, with these groups increasing their share notably from 2022 to 2023. Financing constraints remain the most significant barrier for low- and middle-income groups, particularly for complete renovations. While the introduction of the low-income bonus in 2024 partly offsets these trends, its reach remains limited, as uptake among middleaged households is low and the instrument targets only owner-occupiers, thereby excluding tenants. Empirical evidence suggests that the bonus is effective for those who receive it: it reduces deadweight effects, increases expansion effects among low-income groups and induces investments that would not have occurred otherwise. Yet, most income bonus beneficiaries were retirees rather than younger households.
Conclusion
Overall, the evaluation shows that the BEG remains an effective but highly sensitive policy instrument. Complementary regulatory signals, such as minimum energy performance standards, heat planning requirements, and energy price developments, interact strongly with the BEG and shape uptake alongside financial incentives. A coherent policy framework that combines predictable funding, regulatory clarity, and targeted social instruments is therefore crucial to realise the renovation potential of the building sector.
From a policy perspective, three implications emerge: First, the attractiveness of funding conditions is the key driver of uptake within the BEG, while stability in these conditions is important for maintaining participation over time. Second, targeted bonuses, such as WPB, can substantially improve the quality and climate effectiveness of renovations. Third, social targeting requires further refinement, particularly to reach younger households with limited access to capital and to ensure that increasing co-financing requirements do not exacerbate social disparities. Future research should examine distributional effects in greater depth, explore longitudinal responses of households to policy changes, and assess how funding design interacts with broader structural conditions in the housing and energy markets.
Use of generative AI tools
Generative AI tools were used to support the structuring, formulation, and translation of text sections. All AI-generated suggestions were reviewed, adjusted, and integrated into the final report by the authors prior to publication. Unpublished texts were processed exclusively in applications for which contractual agreements have been established with the respective providers. These agreements ensure compliance with customary data-security standards, including encrypted data transmission, preferential processing on servers located within the scope of the GDPR (such as within the EU), and the exclusion of data use for training purposes.
Additional File
The additional file for this article can be found as follows:
PowerPoint Slides
PowerPoint Slides relating to this article. DOI: https://doi.org/10.66506/essp.7-201-26.s1
Appendices
Appendix
Factors
| PRIMARY ENERGY FACTORS (ELECTRICITY AND DISTRICT HEATING: AVERAGE VALUES FOR THE YEARS 2025 TO 2045) | GHG FACTORS WITHOUT UPSTREAM CHAINS (ELECTRICITY AND DISTRICT HEATING: AVERAGE VALUES FOR THE YEARS 2025 TO 2045) [G/KWH] | |
|---|---|---|
| natural gas | 1.1 | 202 |
| biomethane | 1.1 | 70 |
| fuel oil | 1.1 | 266 |
| district heating | 1.1 | 70 |
| electricity | 1.6 | 125 |
| wood | 1.1 | 29 |
[i] Source: Own representation based on BEG evaluation reports (2021–2024).
Analysis of the efficiency house standard in the BEG residential buildings
The Data from KfW allows the analysis of the EH-standard applied for by the individual cases. Each case has an information about the EH-standard. Figure 11 shows that there is a trend towards better EH-standards.
In the year 2022 the spread is similar to 2021. EH 40, EH 55 and EH 70 make 49% and 56% of all cases, whereas EH 85 and EH 100 sums up to 36% and 33%.
In the two years of 2023 and 2024 this rises to 76% and 81%.
The share of EH historic and EH 85 decreases over the four years of evaluation from 21% in 2021 to 8% in 2024 (EH 85) 15% in 2021 to 10% in 2024 (EH historic).
There is no funding for EH 100 in 2023 and 2024 anymore.
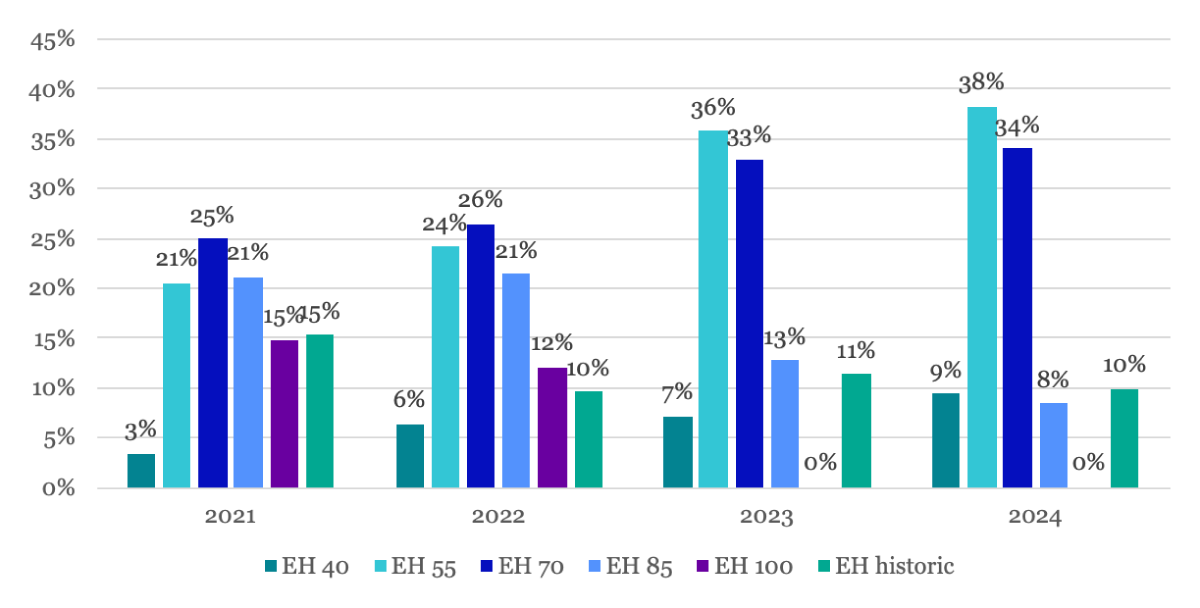
Figure 11
Share of the reached EH-standard in BEG residential buildings.
Source: Own representation based on BEG evaluation reports (2021–2024).20 © Prognos/ifeu/FIW/ITG 2026.
This trend towards more efficient standards may be triggered by the WPB bonus. However, other factors likely contributed as well. In particular, the COVID-19 pandemic and the war against Ukraine may have influenced renovation decisions and the choice of efficiency standards. Responsible persons and institution may change their decisions for example, through changes in energy price expectations, supply chain disruptions, or broader investment uncertainty.
Notes
[3] The KfW is an investment and development bank owned by the German state. It was introduced in 1948 as part of the Marshall Plan after World War II to help reconstruct the country.
[4] Until 2022, the funding for new-built formed part of the BEG evaluation. However, it is not part of the paper.
[6] The efficiency house standard (German: Effizienzhaus-Standard), introduced by KfW, defines the energy performance of residential houses relative to a reference building. For example, a building meeting the efficiency house standard 40 (EH 40) has a non-renewable primary energy demand of 40% and heat transmission losses of 55% of those of the reference building specified in the German Building Energy Act.
[7] Complete retrofits constitute of various construction measures, mostly a retrofit of the building envelope as well as the installation of new heating technologies.
[8] For renovations by individual measures usually only one efficiency measure (retrofit of the building envelope, replacement of windows, new heating technology, etc.) at the same time is funded.
[10] The figure only shows the percentages of efficiency house standards eligible to the WPB bonus. Thus, EH100, EH85 and monument buildings are not considered.
[12] Absolute numbers: NnoWPB,2021 = 1,589, NnoWPB,2022 = 2,364, NnoWPB,2023 = 683, NnoWPB,2024 = 446; nnoWPB,2021 = 1,496, nnoWPB,2022 = 2,235, nnoWPB,2023 = 594, nnoWPB,2024 = 379; NWPB,2022 = 49, NWPB,2023 = 323, NWPB,2024 = 1,360; nWPB,2022 = 46, nWPB,2023 = 269, nWPB,2024 = 1,154.
[13] Absolute numbers: NnoWPB,2022 = 2,364, NnoWPB,2023 = 683, NnoWPB,2024 = 446; nnoWPB,2022 = 2,215, nnoWPB,2023 = 584, nnoWPB,2024 = 373; NWPB,2022 = 49, NWPB,2023 = 323, NWPB,2023 = 1,360; nWPB,2022 = 48, nWPB,2023 = 263, nWPB,2023 = 224.
[14] Determined in the evaluation FIW model with this number of cases examined: NnoWPB,2021 = 1,589, NnoWPB,2022 = 2,364, NnoWPB,2023 = 683, NnoWPB,2024 = 446, NWPB,2022 = 49, NWPB,2023 = 323, NWPB,2023 = 1,360.
[15] Values for 2021 not distinguished between new buildings and renovations. Numbers for all other years concern only renovation projects.
[16] Absolute numbers: N,ren,2021 = 4.454, N,ren,2022 = 6.922, N,ren,2023 = 1.621, N,ren,2024 = 2.486; n,ren,2021 = 3.175, n,ren,2022 = 4.436, n,ren,2023 = 939, n,ren,2024 = 1.253; N,individ,2021 = 6.556, N,individ,2022 = 4.803, N,individ,2023 = 9.729, N,individ,2024 = 5.447; n,individ,2021 = 3.591, n,individ,2022 = 3.259, n,individ,2023 = 5.913, n,individ,2024 = 2.863.
[17] An additional credit for households with a yearly taxable income lower than €90,000 exists but is not further discussed in the paper on hand.
[18] In Germany, the taxable income is the sum of all earnings subjected to income tax. The taxable income is derived from the gross income deducted by work-related expenses, social security contributions and further specific expenditure such as donations. Assuming a three-person-household with one child and both parents working equally, this converts to approximately €3,200 net monthly household income.
[19] Absolute numbers: N,ren,2021 = 4.454, N,ren,2022 = 6.922, N,ren,2023 = 1.621, N,ren,2024 = 2.486; n,ren,2021 = 3.175, n,ren,2022 = 4.436, n,ren,2023 = 939, n,ren,2024 = 1.253; N,individ,2021 = 6.556, N,individ,2022 = 4.803, N,individ,2023 = 9.729, N,individ,2024 = 5.447; n,individ,2021 = 3.591, n,individ,2022 = 3.259, n,individ,2023 = 5.913, n,individ,2024 = 2.863.
[20] Values for 2021 not distinguished between new buildings and renovations. Numbers for all other years concern only renovation projects.
[21] The compared samples do not completely match. In the paper from Zimmermann, Späte & Baharona (2025), 15% of the people live in a rented single-family house and only 85% of the single-family houses were ownwe-occupied whereas 100% of the single-family houses within the BEG EM sample are owner occupied.
Acknowledgements
The authors would like to thank the commissioning authority, the Federal Ministry for Economic Affairs and Energy (BMWE), as well as the project agencies BAFA and KfW for their support. We also gratefully acknowledge the contributions of the project team from Prognos, FIW, ITG, and ifeu. The authors acknowledge that the evaluation component of this work was supported by funding from the BMWE. The preparation of this paper itself was conducted independently and did not receive any external financial support. The analyses, interpretations, and recommendations presented herein are solely those of the authors and do not necessarily reflect the views or positions of the BMWE or any other institution.
eceee paper ID
7-201-26