
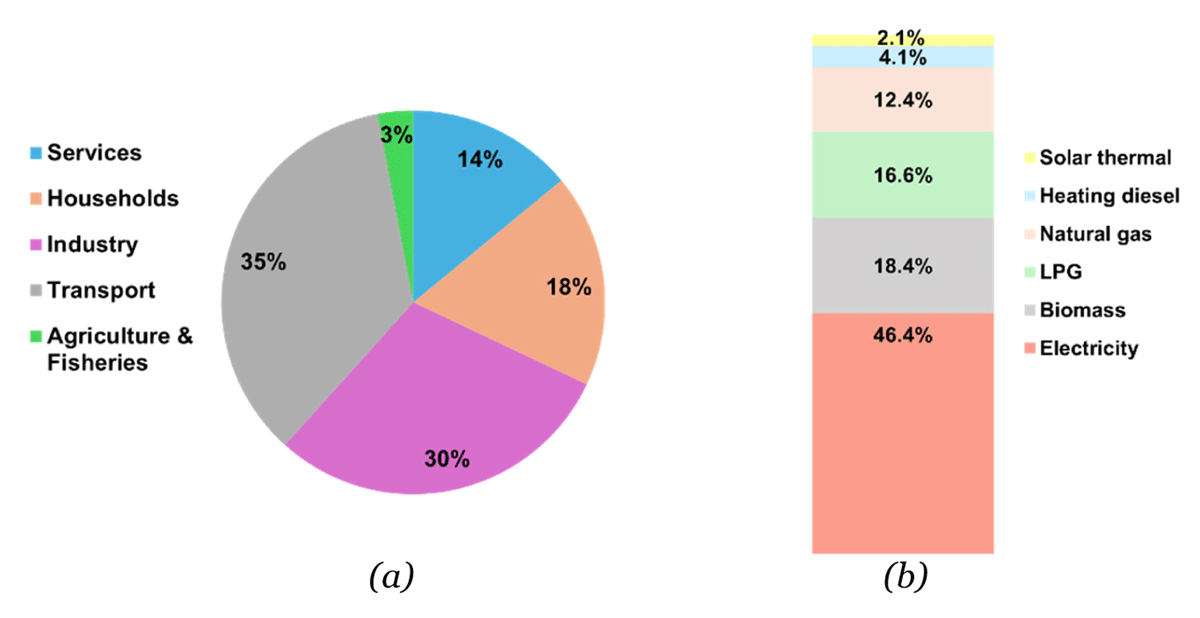
Figure 1
Final energy consumption shares in Portugal (DGEG 2024): (a) sectoral distribution; (b) energy carrier breakdown within the residential sector.
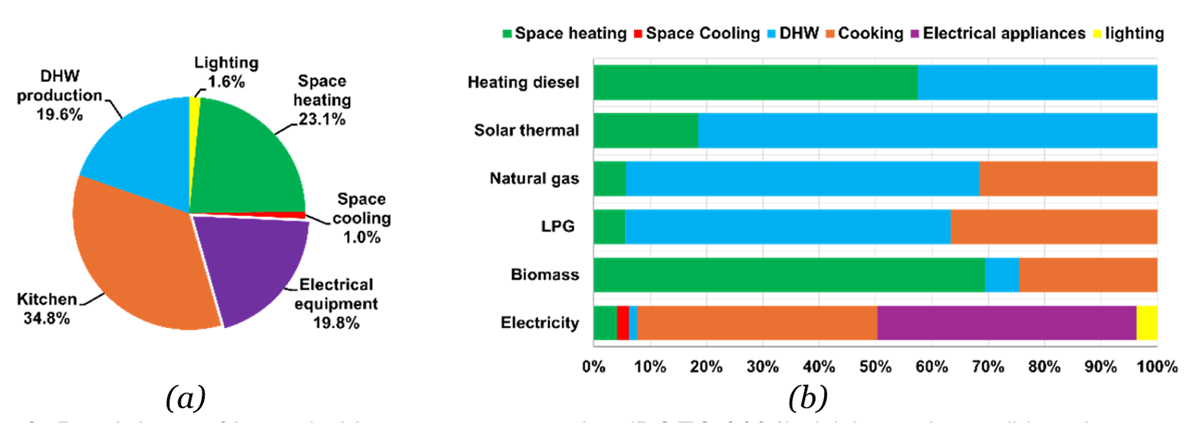
Figure 2
Breakdown of household energy consumption (DGEG 2021): (a) by end use; (b) end-use distribution by energy carrier.
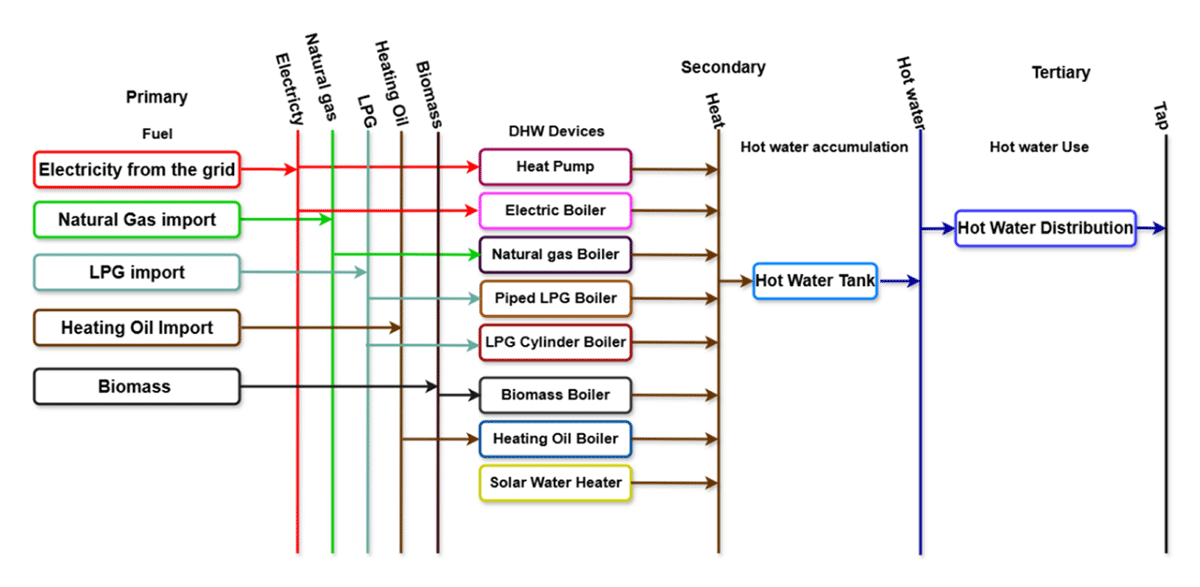
Figure 3
Portugal DHW Reference Energy System.
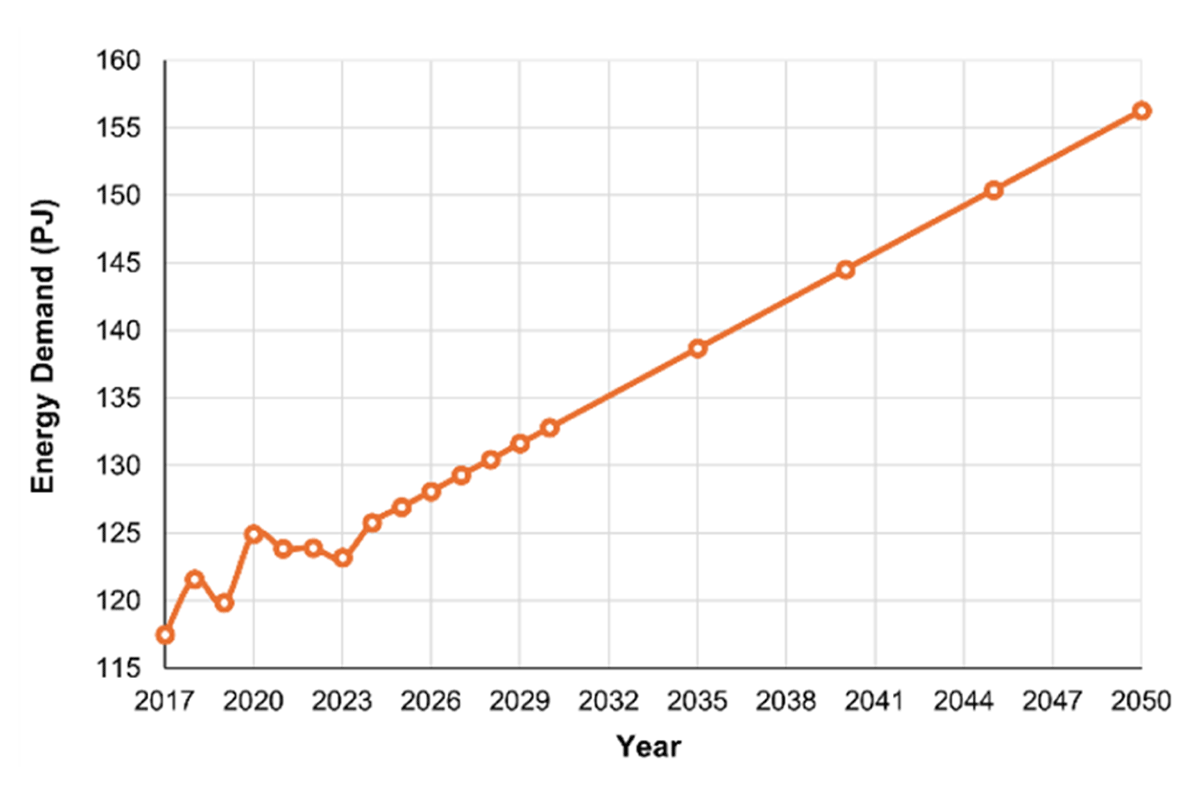
Figure 4
Observed (2017–2023) and extrapolated (2024–2050) long-term DHW energy demand trajectory.
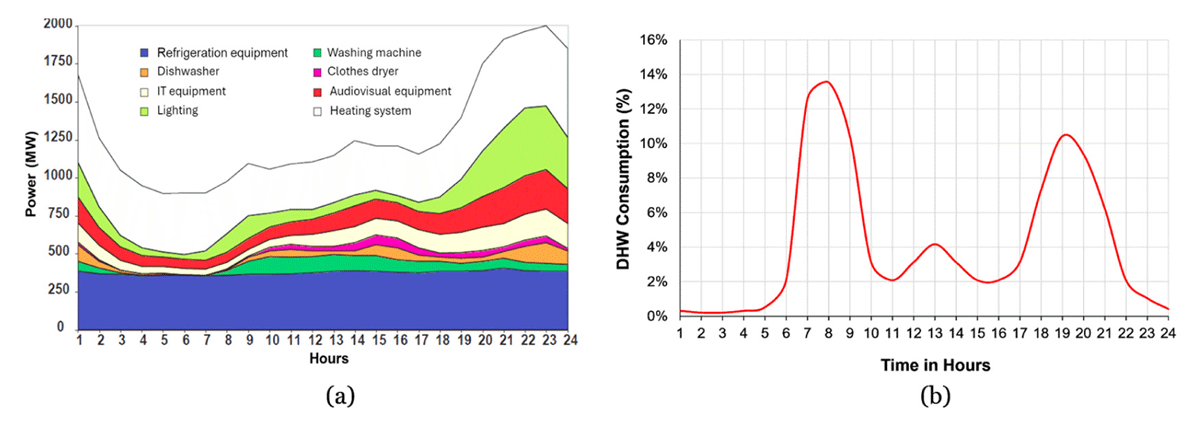
Figure 5
Representative daily demand profiles: (a) daily electricity consumption of appliances and electrical systems in the Portuguese residential sector (DGGE 2004); (b) average daily fraction of DHW consumption in Southern European climates (Fuentes et al. 2018).
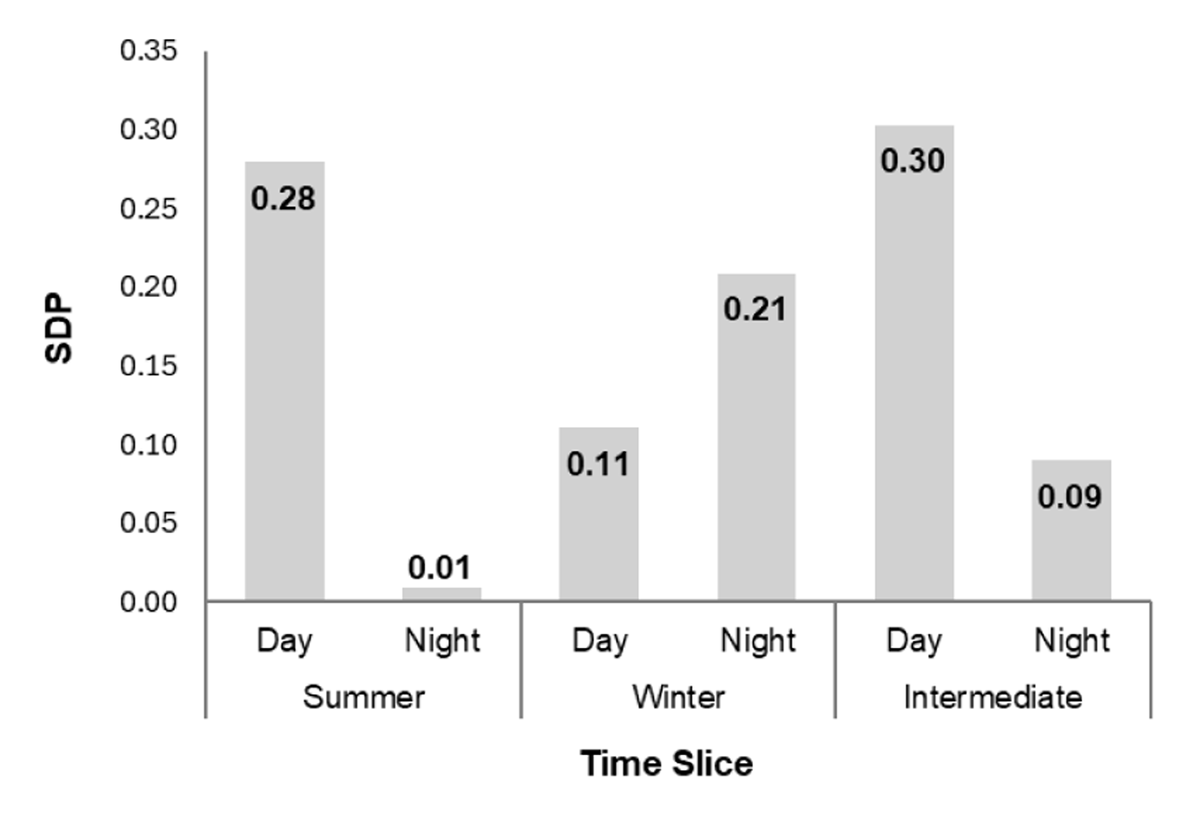
Figure 6
Specified demand profile for each seasonal day-/nighttime slice.
Table 1
Estimated seasonal heat pump performance parameters for DHW production by model time slice.
| TIME SLICE | REFERENCE CASE | UPPER TEMP BOUND | LOWER TEMP BOUND | ||||||
|---|---|---|---|---|---|---|---|---|---|
| T (°C) | COP | IAR | T (°C) | COP | IAR | T (°C) | COP | IAR | |
| Winter day | 15 | 3.13 | 0.32 | 19 | 3.57 | 0.28 | 6 | 2.39 | 0.42 |
| Winter night | 9 | 2.61 | 0.38 | 13 | 2.94 | 0.34 | 2 | 2.14 | 0.47 |
| Intermediate day | 21 | 3.79 | 0.26 | 28 | 4.48 | 0.22 | 13 | 2.94 | 0.34 |
| Intermediate night | 13 | 2.94 | 0.34 | 17 | 3.38 | 0.30 | 7 | 2.46 | 0.41 |
| Summer day | 28 | 4.48 | 0.22 | 38 | 6.26 | 0.16 | 21 | 3.79 | 0.26 |
| Summer night | 18 | 3.47 | 0.29 | 23 | 4.17 | 0.24 | 15 | 3.13 | 0.32 |
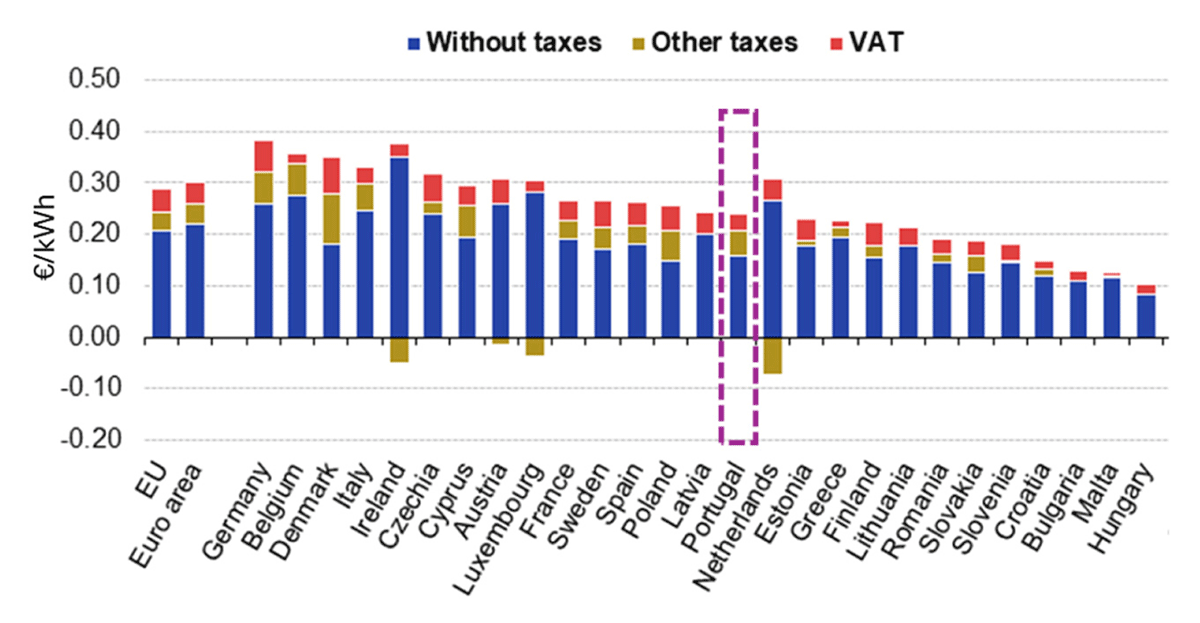
Figure 7
Household electricity prices in 2025 across EU countries (Eurostat 2026).
Table 2
Data gaps and modelling assumptions used to represent DHW heat pumps within the OSeMOSYS framework.
| PARAMETER | DATA GAP | AVAILABLE DATA | ASSUMPTION USED IN THE MODEL | OSEMOSYS IMPLEMENTATION |
|---|---|---|---|---|
| Annual DHW energy demand | No metered household-level DHW consumption data with long-term observations | Aggregated residential thermal energy consumption reported in national energy balances | DHW demand estimated using literature-based shares of residential heat demand | End-use disaggregation of national statistics and extrapolation to represent long-term demand evolution |
| Temporal DHW demand profile | Lack of harmonised national datasets describing hourly DHW consumption patterns | Limited behavioural studies on typical residential hot water use | Stylised daily demand profile with morning and evening peaks | Seasonal time-slice demand structure consistent with OSeMOSYS temporal resolution |
| Temperature-dependent COP | Limited long-term monitored performance data for DHW heat pumps under Portuguese climatic conditions | Fragmented performance indicators reported in international studies | Seasonal COP values estimated from literature ranges and adjusted to Portuguese climate conditions | COP approximated for each seasonal time slice to represent temperature-dependent performance |
| Input activity ratios | No directly reported electricity-to-heat conversion ratios for DHW heat pumps | COP values reported in technical literature | Electricity input ratios derived from assumed seasonal COP values | Conversion of COP values into OSeMOSYS input and output activity ratios |
| Capital cost | Lack of national datasets including equipment and installation costs | European technology cost databases and limited market observations | €1,600–2,500/kW based on European installation cost ranges | Literature benchmarks calibrated using Portuguese market price ranges |
| Fixed operation and maintenance (O&M) cost | No dedicated national statistics on maintenance expenditure | European cost estimates from heat pump studies | €100–200/kW/year used as representative maintenance cost | Literature-based cost parameter used to represent annual O&M expenditure |
| Variable cost (electricity) | Detailed household tariff structures not consistently reported in modelling datasets | Average residential electricity prices from national statistics | €0.22/kWh representing average Portuguese household electricity tariff | Electricity price applied as input energy cost in the model |
| Useful lifetime | Lack of empirical survival curves for residential DHW heat pumps | Lifetime estimates reported in international technology databases | 15–20 years assumed based on typical residential heat pump lifetimes | Standard lifetime parameter applied in technology representation |
Table 3
Cost parameter assumptions used in Scenarios 1 and 2.
| PARAMETER | SCENARIO 1 | SCENARIO 2 |
|---|---|---|
| Capital cost (€/kW) | 1,600 | 2,500 |
| Fixed O&M cost (€/kW.yr) | 100 | 200 |
| Electricity price (€/kWh) | 0.22 | 0.22 |
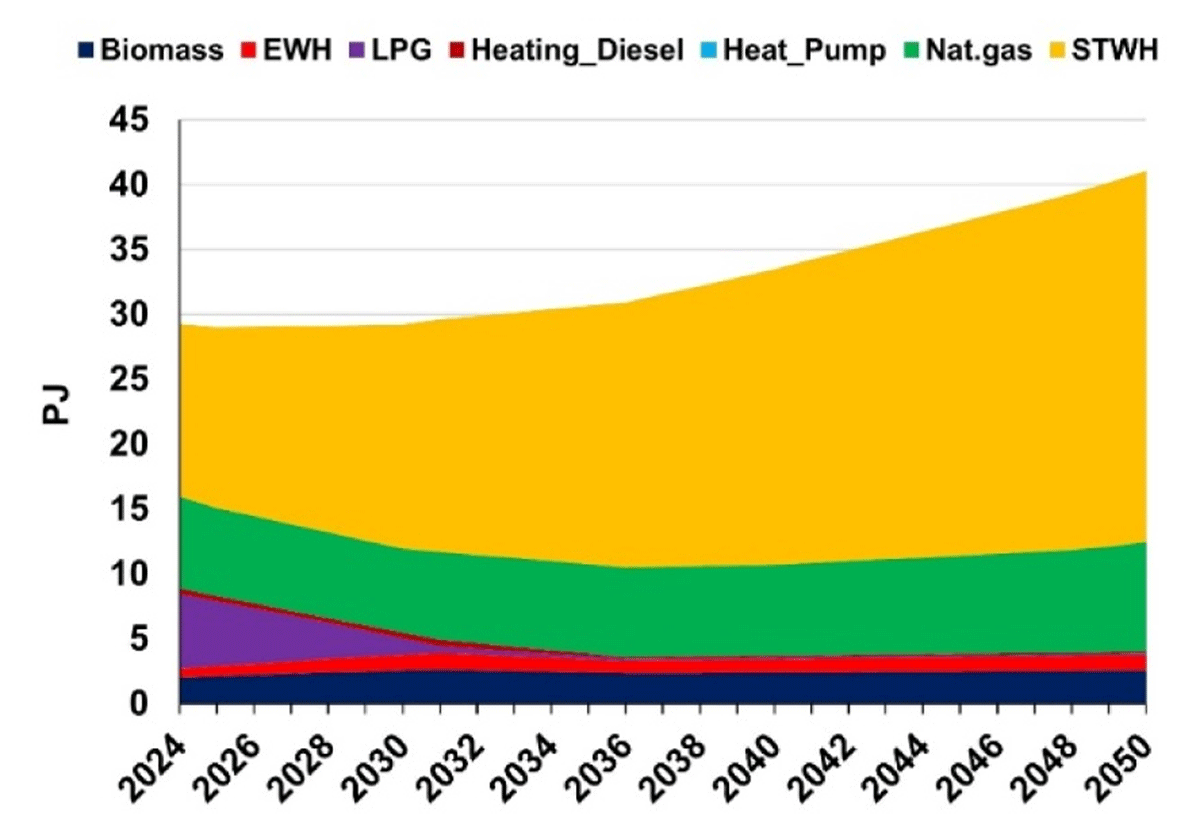
Figure 8
Annual DHW energy production by technology under the BAU scenario.
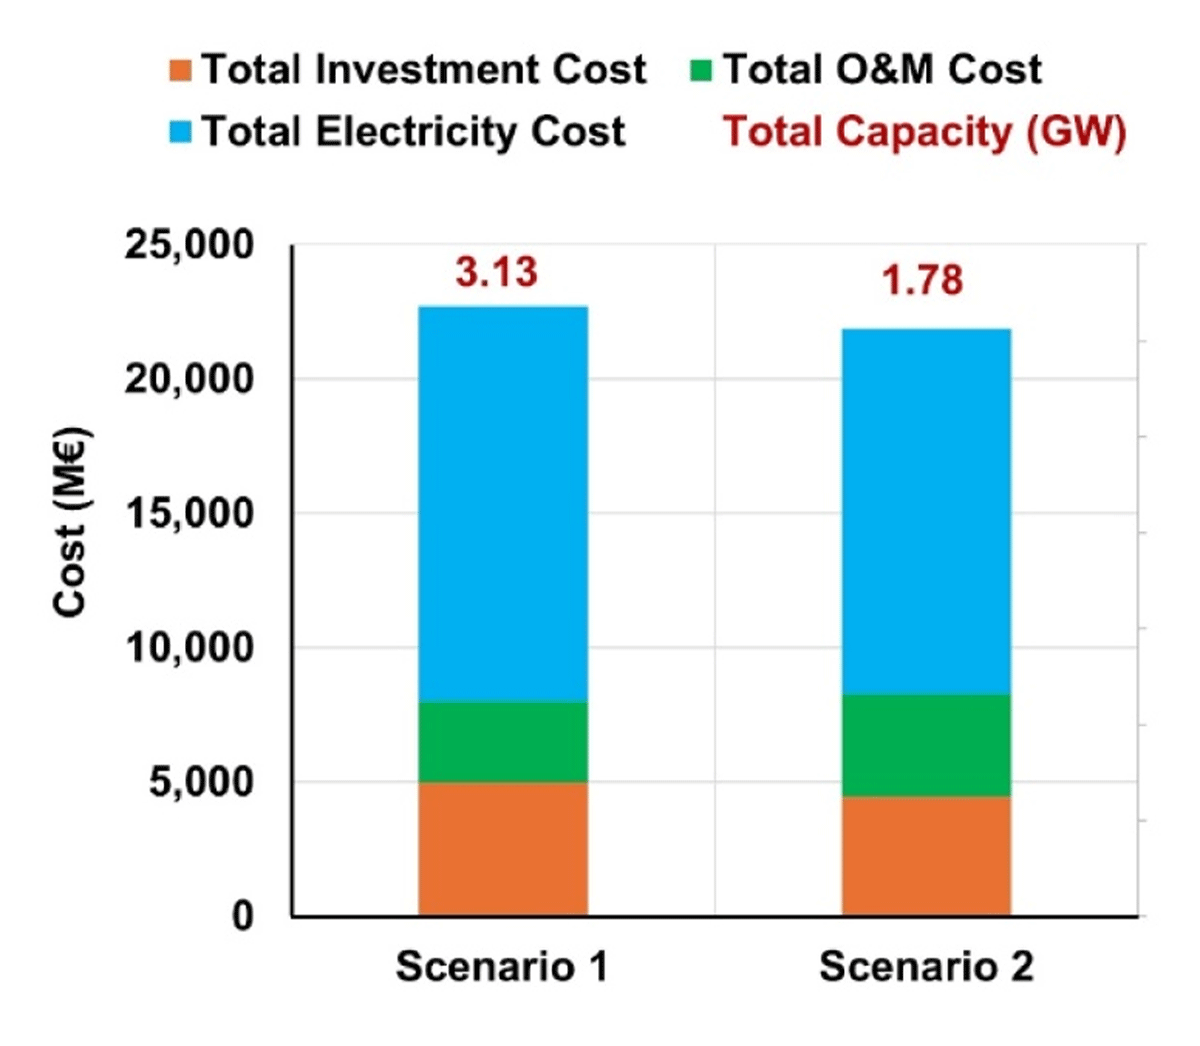
Figure 9
Comparative heat pump capacity and cost outcomes under Scenarios 1 and 2.
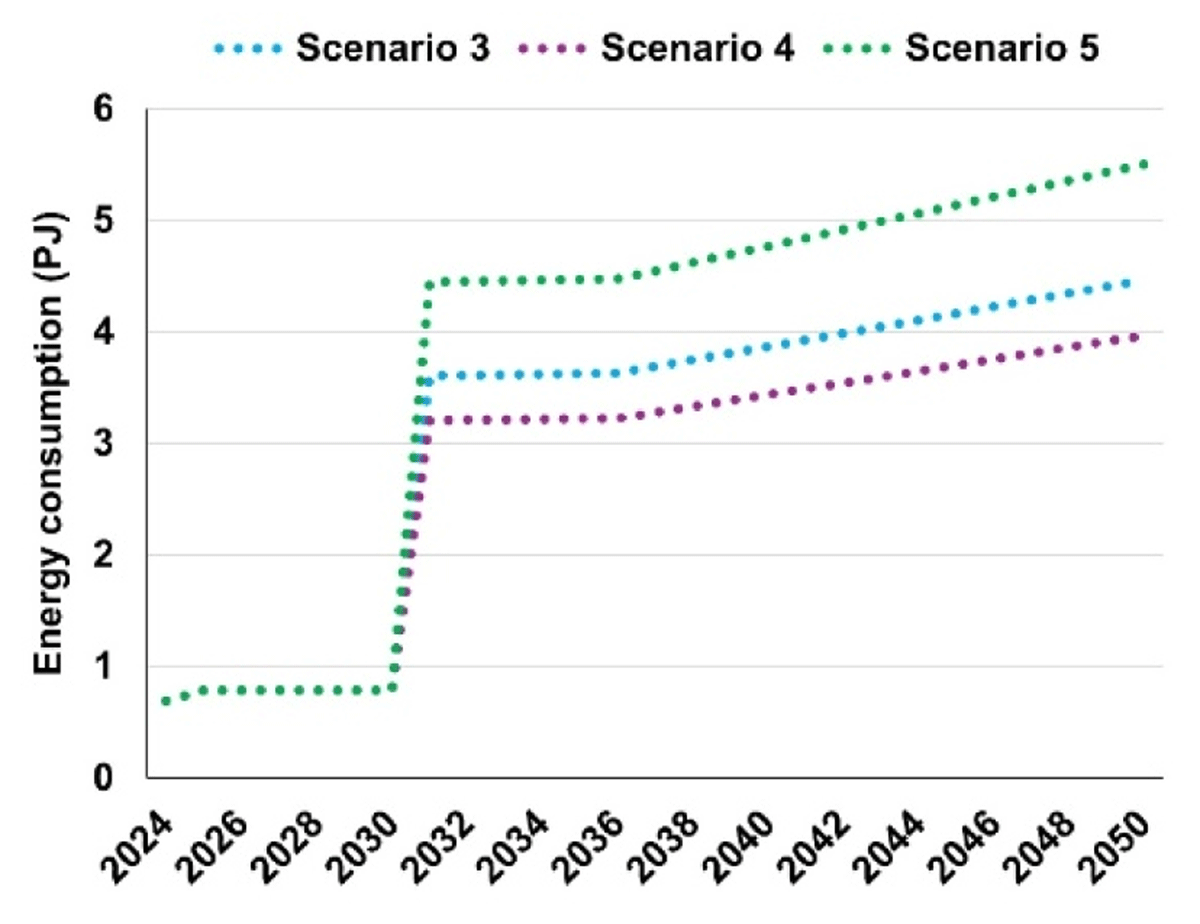
Figure 10
Annual grid electricity consumption under Scenarios 3, 4 and 5.