
Introduction
Residential building sector decarbonisation is a central pillar of the global energy transition, as buildings account for a substantial share of final energy consumption and energy-related greenhouse gas (GHG) emissions (Jørgensen & Ma 2025). In the European Union (EU), buildings account for approximately 40% of final energy consumption and around 35% of energy-related GHG emissions (European Commission 2020), making them a critical sector for achieving climate-neutrality targets.
Residential energy demand is typically divided into space heating, space cooling, appliances, lighting, and domestic hot water (DHW) (Swan & Ugursal 2009). While space heating has historically dominated household energy consumption, improvements in building insulation and tightening efficiency standards are progressively reducing heating demand. As a result, DHW accounts for a significant share of residential energy demand and is expected to grow in importance as space-heating demand declines (Marszal-Pomianowska et al. 2021).
Unlike space heating, which is largely climate-driven, DHW demand is influenced by household behaviour and daily routines. It exhibits pronounced intraday peaks, particularly in morning and evening periods, with comparatively limited seasonal variation (Chmielewska 2025; Marszal-Pomianowska et al. 2019). These temporal characteristics can create concentrated electricity demand peaks when water heating systems are electrified.
DHW production remains heavily dependent on fossil-fuel technologies, particularly natural gas boilers (IEA 2025), and its decarbonisation is therefore crucial for the building sector energy transition. Electrification through heat pump deployment has emerged as a key decarbonisation strategy (Famiglietti et al. 2023). System-level implications of large-scale DHW heat pump deployment depend critically on how demand patterns and operational dynamics are represented in long-term energy system models.
DHW energy demand is frequently aggregated with space heating or unrepresented, obscuring its distinct temporal structure. Such simplifications may be acceptable for high-level energy balance assessments but introduce structural limitations when evaluating electrification modelling pathways dependent on short-term load dynamics. Simplified demand representation may obscure peak electricity requirements, flexibility needs, and potential infrastructure implications associated with the electrification of residential water heating.
These modelling considerations are particularly relevant within the European policy context. The Energy Performance of Buildings Directive (EPBD) requires EU member states to progressively decarbonise their building stocks and implement zero-emission standards for new buildings by 2050 (Rémi et al. 2024). Achieving these objectives requires modelling tools capable of evaluating long-term technology deployment pathways under different policy scenarios. In this context, transparent and reproducible modelling assumptions are essential for informing national energy planning.
Long-term optimisation models such as the Open-Source Energy Modelling System (OSeMOSYS) are widely used to analyse energy system transitions and identify cost-optimal technology pathways (Howells et al. 2011). Although these models typically provide detailed representations of supply-side technologies, residential thermal demand is often aggregated due to the limited availability of end-use data. In practice, modellers must rely on proxy indicators, stylised demand profiles, and simplified performance assumptions to represent the DHW system.
Despite the growing policy emphasis on heat pumps, relatively few studies have examined the practical challenges of integrating DHW heat pumps into national long-term optimisation models. Existing literature, including (Nosrati-Ghods et al. 2025; Oliveira Panão & Figueira 2025; Sborz et al. 2022), focuses on technical performance or aggregate electrification outcomes, while less attention has been given to the methodological compromises required when representing DHW heat pump systems within national long-term energy system models.
This paper addresses this gap by examining the integration of DHW heat pumps into a national long-term optimisation model based on OSeMOSYS, using Portugal as a case study. It contributes to building decarbonisation planning by systematically documenting the data gaps and modelling limitations encountered when integrating domestic hot-water heat pumps into national long-term energy system models, and by illustrating how these assumptions influence electricity demand projections and infrastructure planning outcomes.
Particular attention is given to challenges related to demand estimation, temporal demand profiles, representation of technology costs, and temperature-dependent heat pump performance. Rather than proposing an idealised modelling framework, the paper illustrates how pragmatic assumptions can be used to address data constraints and enable internally consistent scenario analysis.
Rather than providing a comprehensive exploration of alternative scenarios, this study quantifies the impact of key modelling assumptions, focusing on cost parameters and COP assumptions. It evaluates their influence on technology deployment, system costs, and electricity demand, highlighting the importance of transparency when using long-term energy system models to inform building decarbonisation strategies.
The remainder of the paper is structured as follows. Section 2 introduces the modelling framework and the Portuguese case study. Section 3 examines data gaps and representation choices for DHW heat pumps. Section 4 discusses policy implications and final considerations.
Model and case study
This section outlines the OSeMOSYS modelling framework adopted in this study and describes the representation of the Portuguese energy system, with particular emphasis on DHW technologies. The model is implemented using OSeMOSYS, a long-term energy system optimisation framework suitable for national-level planning under data constraints.
OSeMOSYS energy modelling framework
OSeMOSYS is a long-term energy system optimisation model, designed for strategic energy planning (Howells et al. 2011). The model identifies cost-optimal technology deployment pathways over a defined planning horizon by minimising total system costs while meeting energy demand and policy constraints. These total costs include investment costs, fixed maintenance costs, fuel expenditures, and, where applicable, emissions-related costs (Howells et al. 2011).
OSeMOSYS represents the energy system through a Reference Energy System (RES), which maps energy flows from primary resources to final consumption sectors and allows different technology deployment pathways to compete within the optimisation process (Amirnekooei et al. 2012). Its transparency and flexibility make it particularly suitable for evaluating long-term decarbonisation pathways (Gardumi et al. 2018).
Case study: Portuguese energy system model
Portugal represents a relevant case study for analysing building sector electrification strategies, given its ambitious decarbonisation targets and growing integration of renewable energy. National energy planning is primarily guided by the National Energy and Climate Plan 2030 (NECP2030) and the Roadmap for Carbon Neutrality 2050 (RNC2050), which prioritise large-scale renewable deployment, electrification of end-use sectors, and reductions in fossil fuel consumption.
The building sector accounts for approximately 30% of final energy consumption in Portugal (Capelo et al., 2023), with the residential sector representing a substantial share of this demand. According to the Portuguese energy balance, the residential sector is the third-largest final energy consumer, after transport and industry (Observatorio da Energia et al. 2025). This distribution is illustrated in 1(a), which shows the sectoral breakdown of total energy consumption in Portugal and highlights the importance of buildings in national decarbonisation efforts. Figure 1(b) shows the breakdown of energy carriers in the residential sector, where electricity accounts for a significant share, while fossil fuels remain widely used. This continued dependence on fossil fuels underscores the need to accelerate residential sector decarbonisation.
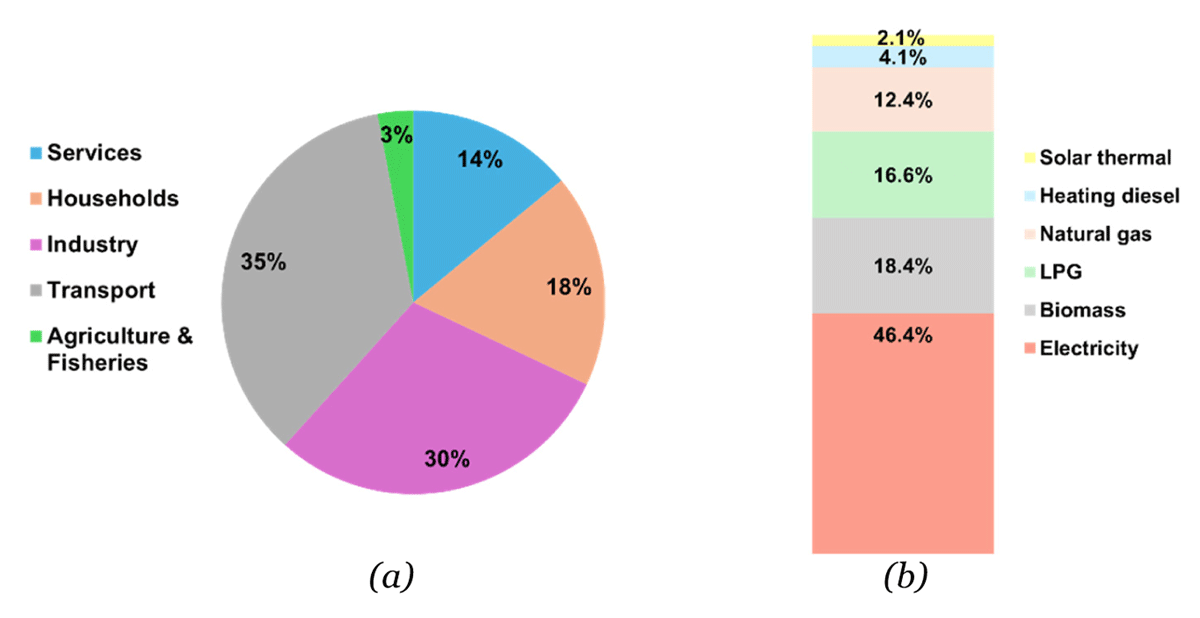
Figure 1
Final energy consumption shares in Portugal (DGEG 2024): (a) sectoral distribution; (b) energy carrier breakdown within the residential sector.
DHW is a key end use within the residential sector, accounting for a substantial share of household energy demand, as shown in Figure 2(a). The figure presents the breakdown of household energy consumption by end use and highlights the relative importance of DHW compared with other residential energy uses, underscoring the need to explicitly consider it in residential decarbonisation strategies.
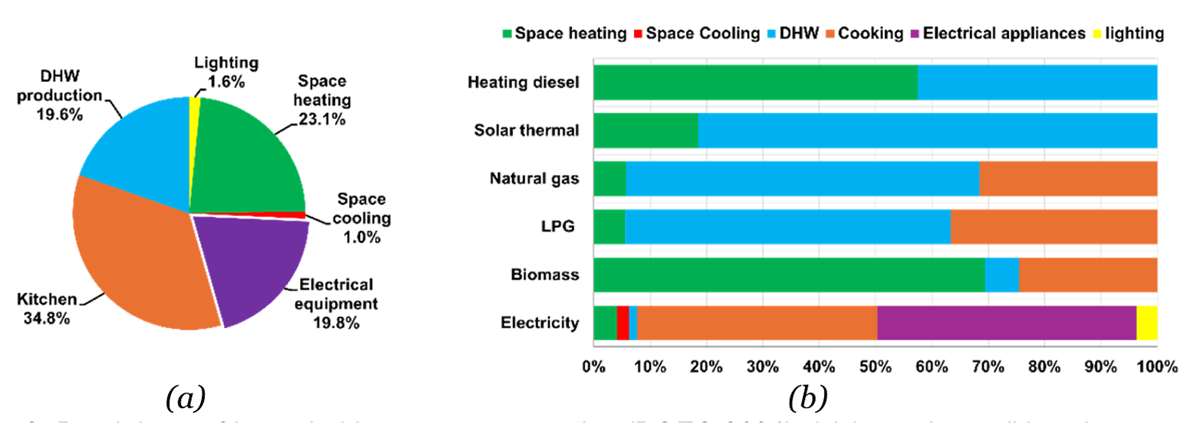
Figure 2
Breakdown of household energy consumption (DGEG 2021): (a) by end use; (b) end-use distribution by energy carrier.
Despite national decarbonisation objectives, DHW demand remains predominantly supplied by fossil-based systems, as illustrated in Figure 2(b), which shows the distribution of energy carriers used for DHW production. Liquefied petroleum gas (LPG) and natural gas are the dominant energy carriers, while biomass and solar thermal account for smaller shares. Electricity plays only a minor role in this end use, and the uptake of heat pumps remains marginal at the national level (DGEG 2021).
Taken together, Figure 2(a) and Figure 2(b) reveal a structural gap between policy objectives promoting electrification and the current fossil-fuel-dominated DHW supply mix. This mismatch underscores the importance of explicitly representing DHW technologies in long-term energy system models when evaluating electrification pathways.
Figure 3 presents a simplified RES representation of the Portuguese DHW system within the OSeMOSYS model. DHW technologies are modelled as conversion technologies that transform energy carriers, such as electricity, natural gas, or LPG, into hot water for households. This structure captures the coexistence of conventional and electrified supply options within the optimisation framework, allowing endogenous competition under techno-economic assumptions and system constraints. It provides the basis for analysing technology substitution pathways and assessing how heat pump costs and performance influence deployment outcomes and electricity demand.
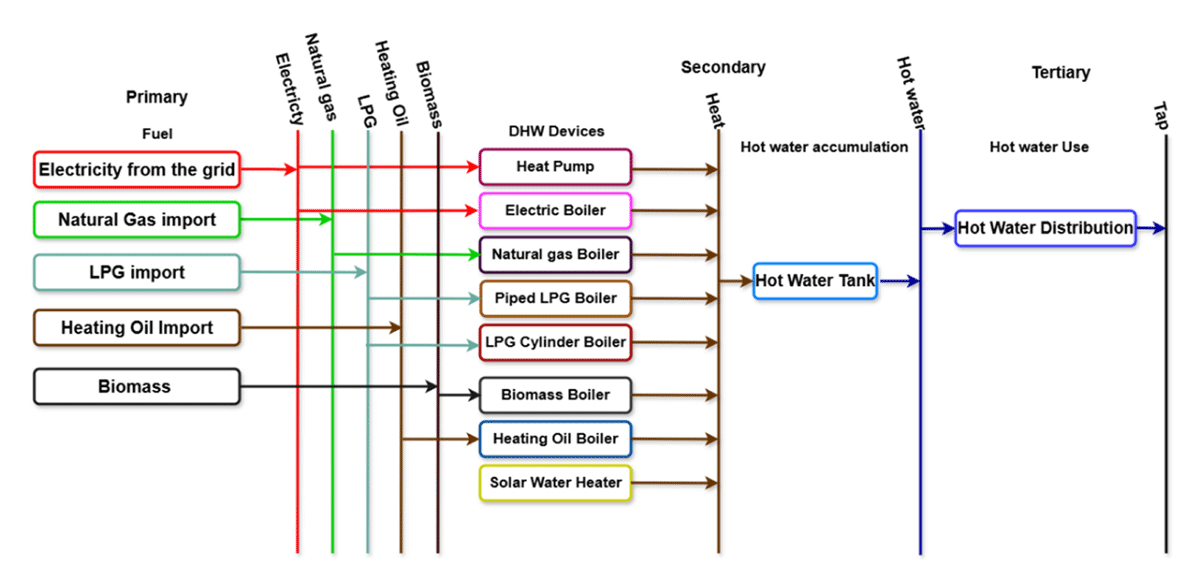
Figure 3
Portugal DHW Reference Energy System.
Data and parameterisation choices
Representing DHW heat pumps in the OSeMOSYS framework requires a structured set of input data and modelling assumptions, which can be grouped into three categories: (i) demand-side specifications, (ii) technology performance parameters, and (iii) economic parameters. These inputs are informed by empirical national statistics, complemented by literature-based estimates for heat pump performance and costs, and supplemented by simplifying assumptions where data gaps persist. Making this classification explicit improves transparency in the modelling approach. This section describes how these inputs are constructed for the Portuguese case and discusses the implications of the associated assumptions.
Demand-side data gaps and modelling assumptions
Demand-side modelling requires two primary input parameters: the annual energy demand (AED) and the specified demand profile (SDP). The AED defines the total energy demand for a given end use, while the SDP determines how this demand is distributed across the model’s time slices, capturing seasonal and daily variation.
Annual DHW energy demand
Estimating annual DHW energy demand requires assumptions, as official long-term projections are not available in Portuguese national statistics. Residential energy consumption data is therefore used as the basis for estimating DHW demand.
Data from the Portuguese energy balance (Observatorio da Energia et al. 2025) show that residential final energy consumption increased from 118.31 PJ in 2017 to 123.20 PJ in 2023, indicating a relatively stable trend over the observed period. DHW demand is estimated as a fixed share of total residential final energy consumption, based on the end-use breakdown shown in Figure 2(a). This approach does not explicitly capture future efficiency improvements, behavioural changes, or technology substitution effects in the baseline demand trajectory.
A linear extrapolation is applied to project annual DHW demand to 2050 using the 2017–2023 historical series. Figure 4 presents the resulting trajectory, showing both observed and projected values over the modelling horizon. The projection indicates a gradual increase in DHW demand over time, reflecting historical trends rather than a forecast based on explicit structural drivers.
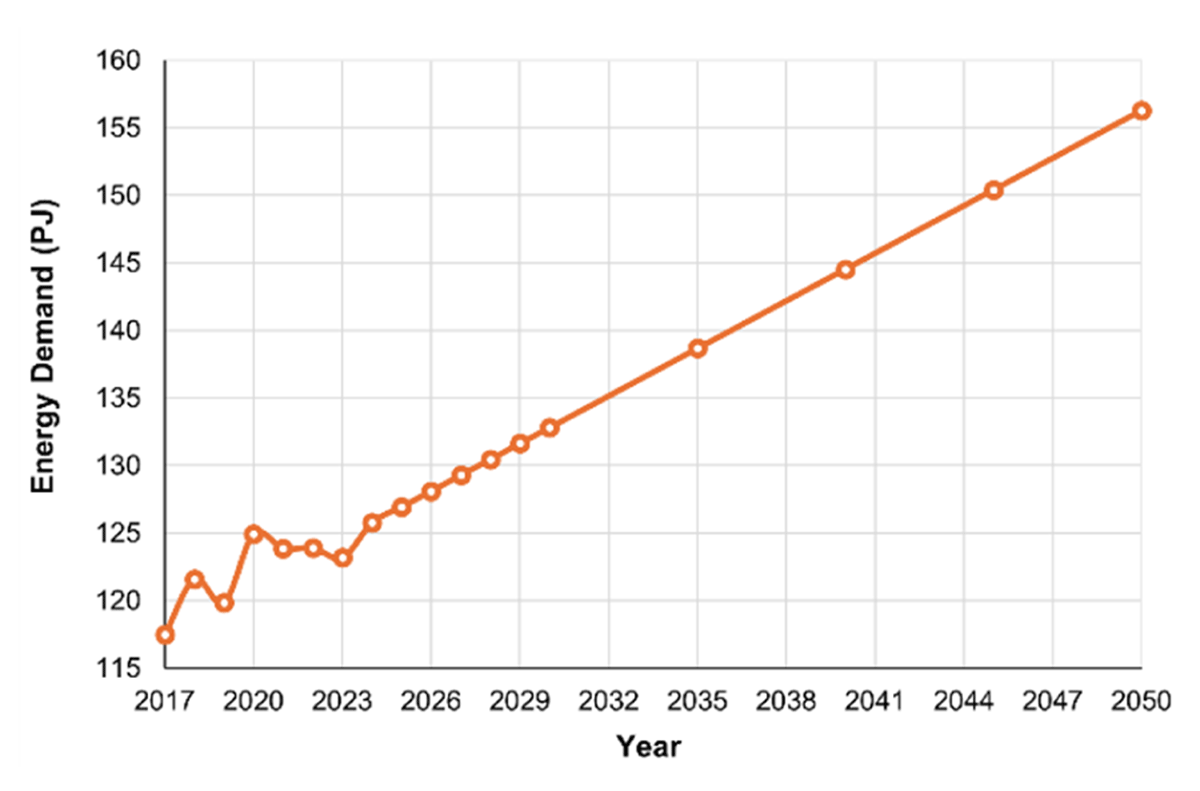
Figure 4
Observed (2017–2023) and extrapolated (2024–2050) long-term DHW energy demand trajectory.
This modelling choice avoids introducing additional exogenous drivers, such as demographic or macroeconomic forecasts, for which consistent long-term datasets are not available. Under this approach, demand increases at an average rate of approximately 1.17 PJ/year over the projection period. However, future policy measures, electrification trends, and improvements in building energy efficiency could affect actual demand levels.
DHW specified demand profile
The temporal distribution of DHW demand is represented through the SDP, which allocates annual demand across six time slices. The temporal structure consists of three seasonal regimes (summer, winter, and an intermediate season combining spring and autumn), each divided into day and night periods.
This six-time-slice structure reflects a modelling compromise between temporal resolution and computational tractability in long-term energy system optimisation models. Although hourly dynamics are not explicitly captured, the structure preserves the main seasonal and daily variations relevant for strategic planning, including DHW demand peaks.
The construction of the demand profile draws on evidence from the literature regarding the temporal characteristics of DHW use. Previous studies report two dominant daily demand peaks, typically occurring in the morning and evening (Ahmed et al. 2016; Bagge & Johansson 2011). Figure 5 presents the empirical and literature-based evidence used to parameterise this demand profile.
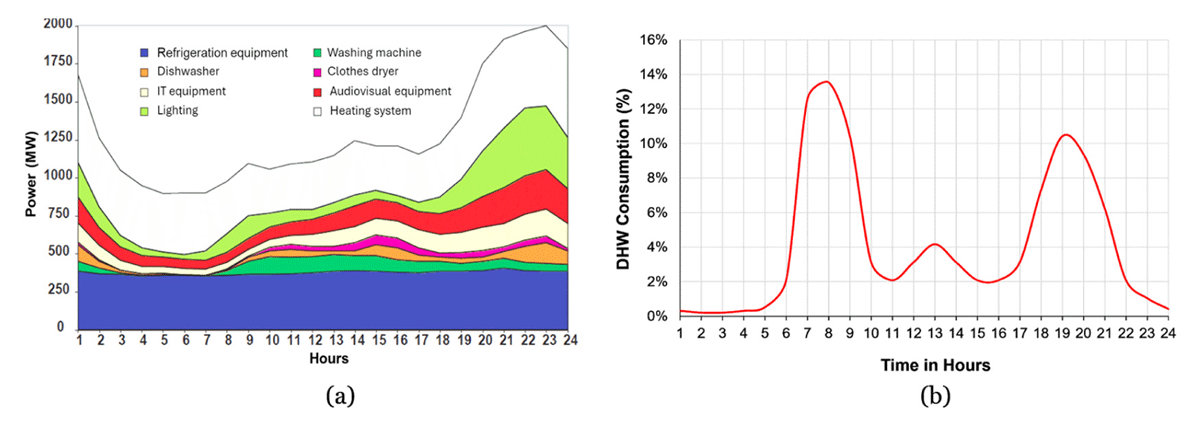
Figure 5
Representative daily demand profiles: (a) daily electricity consumption of appliances and electrical systems in the Portuguese residential sector (DGGE 2004); (b) average daily fraction of DHW consumption in Southern European climates (Fuentes et al. 2018).
In Portugal, the latest official report providing daily residential demand profiles dates to 2004 (DGGE 2004). The report provides an estimate of the hourly load structure disaggregated across major end uses, as illustrated in Figure 5(a), which shows daily electricity consumption for appliances and electrical systems in the Portuguese residential sector. Lighting, refrigeration, audiovisual equipment, and other end uses are explicitly represented; however, DHW is not directly distinguishable, as it is embedded within broader heating system categories. This lack of direct national DHW-specific load profile data represents a key data gap in the Portuguese context.
To address this limitation, broader European evidence is used to define the proxy for DHW demand. Fuentes et al. (2018) synthesised DHW consumption profiles across multiple countries, including southern European climates comparable to Portugal. The representative daily fraction profile shown in Figure 5(b) is adopted to represent Portuguese residential DHW demand patterns. This approach is supported by climatic similarity and the absence of sufficiently disaggregated national DHW data.
Seasonal demand fractions were derived from the representative profile and adjusted to reflect expected seasonal variations in DHW usage. These fractions were used to distribute annual demand across the six model time slices, resulting in the final demand profile shown in Figure 6.
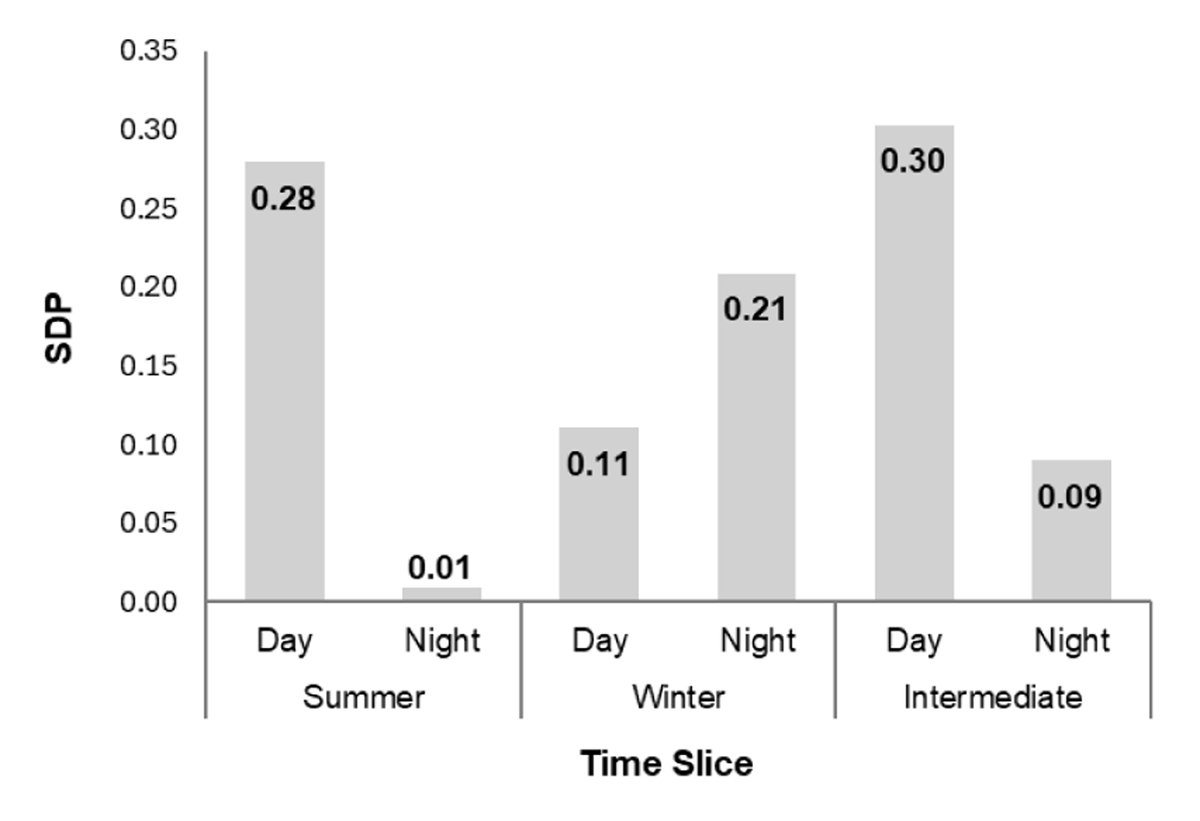
Figure 6
Specified demand profile for each seasonal day-/nighttime slice.
The adopted profile represents an aggregated activity-based approximation rather than direct high-resolution measurements. DHW demand profiles are influenced by household composition, user behaviour and socio-economic conditions, which cannot be fully represented at this level of aggregation. Consequently, the temporal distribution of demand remains a structurally sensitive modelling assumption.
Alternative assumptions regarding time-slice definitions or seasonal demand allocation could influence electricity demand, heat pump usage patterns, and resulting system investment decisions within the optimisation model. This profile should therefore be interpreted as a representative approximation of Portuguese residential DHW demand patterns under current data constraints rather than a measured load profile.
Heat pump performance representation
The representation of heat pump performance in long-term energy modelling is a key aspect when analysing the electrification of DHW production. Within OSeMOSYS, technology performance is represented by efficiency parameters that relate energy inputs to useful outputs. For DHW heat pumps, electricity serves as the input energy carrier, while the thermal energy delivered to the water storage tank represents the useful output.
Heat pump performance is described through the coefficient of performance (COP), defined as the ratio of useful thermal output to electricity input. Within OSeMOSYS, this relationship is represented through the InputActivityRatio parameter, which links electricity requirements to useful heat production.
Unlike conventional electric resistance water heaters, the COP of heat pumps varies with operating conditions, particularly outdoor temperature and water setpoint temperature. Higher ambient temperatures generally improve system performance, whereas lower ambient temperatures reduce system efficiency (Çengel et al. 2019). The hot water setpoint temperature (Thot), typically ranging between 30–50 °C, is a key model parameter. In this study, a representative setpoint temperature of 40 °C is assumed.
Based on these assumptions, heat pump performance was estimated for each model time slice and converted into InputActivityRatio parameters for use in OSeMOSYS. Since OSeMOSYS does not endogenously represent temperature-dependent efficiency changes within a single technology, heat pump performance is modelled through time-slice-specific sub-technologies, each assigned a distinct efficiency value and constrained to operate only in its corresponding time slice. This approach approximates temporal variability in heat pump efficiency while preserving the linear optimisation structure of OSeMOSYS.
A climatic reference for mainland Portugal was developed using Lisbon (NASA 2026) as a representative location. To reflect uncertainty in the temperature assumptions underlying heat pump performance estimation, three COP parameterisation cases are considered: (i) a Reference Temperature Case, based on the mean temperature for each model time slice; (ii) an Upper Temperature Bound Case, using the highest representative temperatures; and (iii) a Lower Temperature Bound Case, using the lowest representative temperatures. These cases form the basis of the performance sensitivity analysis presented later in the Results section.
Table 1 summarises, for each temperature parameterisation case, the assumed time-slice temperatures and their corresponding COP and InputActivityRatio values used in the model. Higher temperature assumptions lead to higher COP values and lower electricity input requirements, whereas lower temperatures reduce heat pump performance and increase electricity requirements. These sensitivity cases broaden the representation to account for climatic uncertainty and assess how alternative performance assumptions affect electricity demand and heat pump deployment pathways.
Table 1
Estimated seasonal heat pump performance parameters for DHW production by model time slice.
| TIME SLICE | REFERENCE CASE | UPPER TEMP BOUND | LOWER TEMP BOUND | ||||||
|---|---|---|---|---|---|---|---|---|---|
| T (°C) | COP | IAR | T (°C) | COP | IAR | T (°C) | COP | IAR | |
| Winter day | 15 | 3.13 | 0.32 | 19 | 3.57 | 0.28 | 6 | 2.39 | 0.42 |
| Winter night | 9 | 2.61 | 0.38 | 13 | 2.94 | 0.34 | 2 | 2.14 | 0.47 |
| Intermediate day | 21 | 3.79 | 0.26 | 28 | 4.48 | 0.22 | 13 | 2.94 | 0.34 |
| Intermediate night | 13 | 2.94 | 0.34 | 17 | 3.38 | 0.30 | 7 | 2.46 | 0.41 |
| Summer day | 28 | 4.48 | 0.22 | 38 | 6.26 | 0.16 | 21 | 3.79 | 0.26 |
| Summer night | 18 | 3.47 | 0.29 | 23 | 4.17 | 0.24 | 15 | 3.13 | 0.32 |
Even with this parameterisation, limitations remain. Detailed national datasets on installed heat pump technologies are scarce, limiting the representation of differences across system designs, refrigerants, and operating characteristics. In addition, much of the empirical performance evidence originates from studies conducted outside Portugal, introducing further uncertainty when applying these assumptions to the national context.
Finally, the COP values should be interpreted as representative seasonal estimates suitable for long-term energy system analysis rather than precise operational performance values. Their purpose is not to reproduce detailed equipment behaviour, but to provide a transparent and internally consistent basis for assessing how performance assumptions influence model outcomes.
Parameterisation of heat pump costs
Following the OSeMOSYS modelling framework, the cost representation of DHW heat pumps includes three components: investment costs, operation and maintenance costs, and fuel costs. These are represented by the technology-specific CapitalCost, FixedCost, and VariableCost parameters, which contribute to minimising total system cost. All monetary values are expressed in euros at 2025 prices.
Estimating representative cost values for residential heat pump systems presents several challenges. Unlike conventional generation technologies, heat pump costs vary considerably depending on system design, storage capacity, manufacturer specifications, system capacity, installation conditions, and national taxation schemes. Consequently, the parameterisation adopted here relies on aggregated market data and literature-based estimates to derive representative cost assumptions for long-term energy system modelling.
Available market data indicate that the purchase price of residential heat pump water heaters with storage capacities between 120 L and 260 L typically ranges from €1,200 to €3,200 (GroupSumi 2026; Sunshop 2026), excluding value-added tax (VAT), which varies by country. While these equipment prices are relatively transparent in market listings, installation costs introduce greater variability, as they depend on building conditions, system integration requirements, and labour costs.
European references suggest that installation costs for heat pump systems range from 1.5 to 2.5 times the device cost (Staffell et al. 2012), resulting in typical total investment costs of €4,800–€7,600. Given that DHW heat pump systems generally operate within a thermal capacity range of 1.5–3 kW, the corresponding CapitalCost can be estimated at approximately €1,600–€2,500 per kW of installed thermal capacity. This range is adopted as a representative investment assumption in the modelling framework.
Given the uncertainty associated with these estimates, this investment range also forms the basis of the cost sensitivity analysis presented later in the paper, where lower- and upper-bound investment assumptions are tested explicitly
In addition to investment costs, heat pump systems incur annual operation and maintenance expenditures. Generic European estimates suggest that annual maintenance costs typically range from €150 to €300 per system per year (Intuis 2026). Given typical system capacities, this corresponds to approximately €100–€200 per kW per year, represented in the model as FixedCost. As with capital costs, lower and upper values of this range are retained as sensitivity assumptions in the scenario analysis.
The fuel cost of heat pump operation corresponds to the electricity required to operate the system. Electricity prices, therefore, represent the effective fuel cost of the technology. In Portugal, residential electricity tariff structures vary according to contract conditions, consumption levels and taxation structures. Figure 7 presents a comparison of household electricity prices across EU countries based on Eurostat statistics, showing the contribution of energy costs, taxes and VAT to final consumer prices (Eurostat 2026).
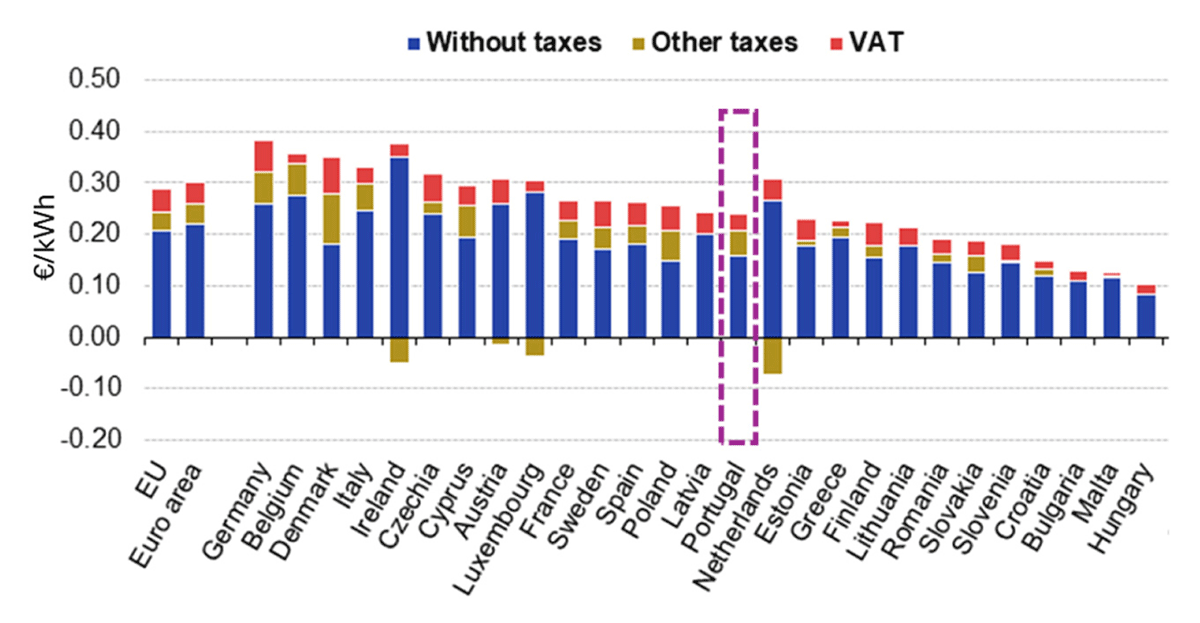
Figure 7
Household electricity prices in 2025 across EU countries (Eurostat 2026).
According to these data, the EU average electricity price in 2025 is approximately €0.29/kWh, while the corresponding value for Portugal is about €0.22/kWh. This value is adopted as the representative electricity cost for heat pump operation in the reference parameterisation. Within OSeMOSYS, it is represented as the VariableCost associated with heat pump technology activity.
Uncertainty nevertheless remains in the representation of heat pump costs. Investment costs depend on technology heterogeneity, storage capacity, and installation characteristics, which cannot be fully captured by aggregated parameters. Similarly, future electricity prices may evolve due to market, regulatory, and tax changes that are not captured by a constant-price assumption. These uncertainties motivate the explicit cost-sensitivity scenarios introduced later in the analysis, which use lower- and upper-bound cost assumptions to evaluate how parameter selection influences technology deployment and system costs.
The cost parameterisation presented here provides a consistent and transparent approximation of heat pump investment and operational costs for long-term national energy system modelling, although limitations remain. Rather than treating these assumptions as fixed inputs, the revised analysis explicitly tests their implications through comparative scenarios to assess the effects of parameter uncertainty under data-constrained conditions.
Summary of key data gaps and modelling assumptions
Table 2 summarises the main data gaps identified when modelling DHW heat pumps and the assumptions adopted within the OSeMOSYS framework to approximate system behaviour in the absence of detailed empirical data.
Table 2
Data gaps and modelling assumptions used to represent DHW heat pumps within the OSeMOSYS framework.
| PARAMETER | DATA GAP | AVAILABLE DATA | ASSUMPTION USED IN THE MODEL | OSEMOSYS IMPLEMENTATION |
|---|---|---|---|---|
| Annual DHW energy demand | No metered household-level DHW consumption data with long-term observations | Aggregated residential thermal energy consumption reported in national energy balances | DHW demand estimated using literature-based shares of residential heat demand | End-use disaggregation of national statistics and extrapolation to represent long-term demand evolution |
| Temporal DHW demand profile | Lack of harmonised national datasets describing hourly DHW consumption patterns | Limited behavioural studies on typical residential hot water use | Stylised daily demand profile with morning and evening peaks | Seasonal time-slice demand structure consistent with OSeMOSYS temporal resolution |
| Temperature-dependent COP | Limited long-term monitored performance data for DHW heat pumps under Portuguese climatic conditions | Fragmented performance indicators reported in international studies | Seasonal COP values estimated from literature ranges and adjusted to Portuguese climate conditions | COP approximated for each seasonal time slice to represent temperature-dependent performance |
| Input activity ratios | No directly reported electricity-to-heat conversion ratios for DHW heat pumps | COP values reported in technical literature | Electricity input ratios derived from assumed seasonal COP values | Conversion of COP values into OSeMOSYS input and output activity ratios |
| Capital cost | Lack of national datasets including equipment and installation costs | European technology cost databases and limited market observations | €1,600–2,500/kW based on European installation cost ranges | Literature benchmarks calibrated using Portuguese market price ranges |
| Fixed operation and maintenance (O&M) cost | No dedicated national statistics on maintenance expenditure | European cost estimates from heat pump studies | €100–200/kW/year used as representative maintenance cost | Literature-based cost parameter used to represent annual O&M expenditure |
| Variable cost (electricity) | Detailed household tariff structures not consistently reported in modelling datasets | Average residential electricity prices from national statistics | €0.22/kWh representing average Portuguese household electricity tariff | Electricity price applied as input energy cost in the model |
| Useful lifetime | Lack of empirical survival curves for residential DHW heat pumps | Lifetime estimates reported in international technology databases | 15–20 years assumed based on typical residential heat pump lifetimes | Standard lifetime parameter applied in technology representation |
Scenario design
A Business-as-Usual (BAU) scenario is defined based on the central assumptions adopted in this study. This scenario represents the default model configuration under current data availability and serves as the reference case for presenting model outcomes.
In line with the NECP2030 and the RNC2050, the model assumes that the transition to DHW decarbonisation begins in 2030. This timing is applied consistently across the alternative cost and performance scenarios, in which heat pump deployment is assessed under the same policy-driven assumptions.
To demonstrate how modelling assumptions influence outcomes, additional sensitivity scenarios are defined across two uncertainty dimensions identified in the previous sections: economic parameters and heat pump performance. For the economic dimension, two alternative cases are considered:
Scenario 1 (Lower-Cost): based on lower-bound values for capital and fixed O&M costs.
Scenario 2 (Higher-Cost): based on upper-bound values for capital and fixed O&M costs.
These two scenarios illustrate how alternative cost assumptions influence model outcomes. Table 3 summarises the input cost parameters for Scenarios 1 and 2.
Table 3
Cost parameter assumptions used in Scenarios 1 and 2.
| PARAMETER | SCENARIO 1 | SCENARIO 2 |
|---|---|---|
| Capital cost (€/kW) | 1,600 | 2,500 |
| Fixed O&M cost (€/kW.yr) | 100 | 200 |
| Electricity price (€/kWh) | 0.22 | 0.22 |
Performance uncertainty is examined through three additional scenarios derived from alternative temperature assumptions for each time slice:
Scenario 3 (Reference COP): based on mean temperature conditions.
Scenario 4 (High COP): based on upper-bound temperature conditions leading to higher efficiencies.
Scenario 5 (Low COP): based on lower-bound temperature conditions leading to reduced efficiencies.
These scenarios examine how alternative performance assumptions affect electricity demand and heat pump deployment.
To isolate individual parameter effects, scenarios 1 and 2 are optimised using the Reference COP assumptions of scenario 3, while scenarios 3, 4 and 5 are optimised using the lower-cost heat pump parameter set defined in scenario 1. The analysis focuses specifically on the effects of these assumptions rather than on developing a broader scenario ensemble, aiming to assess how uncertainty in key modelling parameters propagates into model outcomes under data-constrained conditions.
Results
Modelling outcomes are reported for the BAU case and the sensitivity scenarios. Results are organised around technology deployment, system costs, and grid electricity consumption.
Business-as-Usual scenario
The BAU scenario outcome is presented in Figure 8, which illustrates annual energy production by technology over the modelling horizon. Results show that DHW demand continues to be supplied by existing technologies, with solar thermal becoming the dominant supply option over time, while natural gas maintains an important contribution, and LPG declines progressively. Biomass and electric water heaters contribute only marginally.
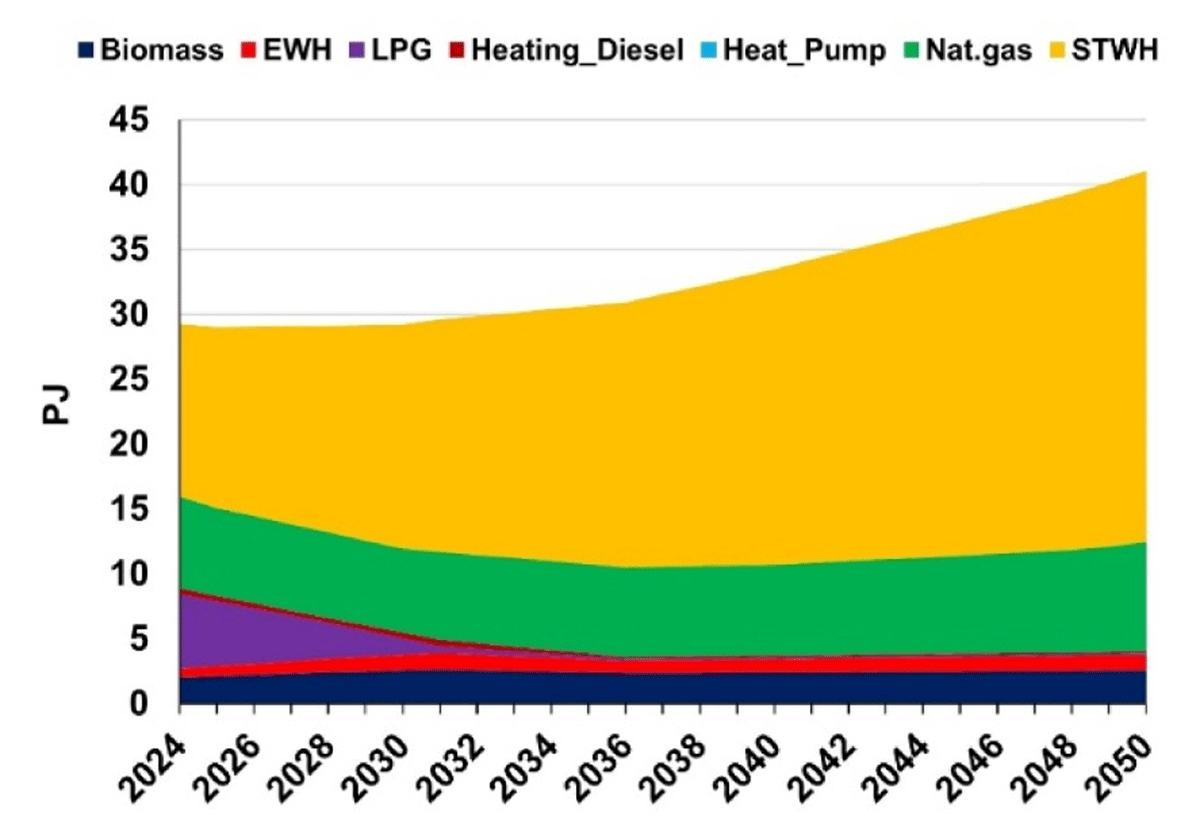
Figure 8
Annual DHW energy production by technology under the BAU scenario.
No heat pump deployment is observed in the BAU scenario, indicating that heat pumps are not cost-optimal under the central assumptions adopted in this study. The transition is instead driven by increasing deployment of solar thermal water heating (STWH). These results establish the reference system configuration and motivate the subsequent sensitivity analysis of alternative cost and performance assumptions.
Effect of cost assumptions
Results from Scenarios 1 and 2 show that heat pumps become competitive within the DHW supply mix under both cost assumptions. From 2030 onward, the technology mix in both scenarios is dominated by STWH, accounting for around 50% of total DHW supply, with the remaining share split between heat pumps and electric water heaters. Cost assumptions lead to noticeable differences in heat pump deployment, with a 5 percentage-point difference between scenarios. In Scenario 1 (Lower-Cost), heat pumps account for approximately 40% of total DHW supply, compared with 35% in Scenario 2 (Higher-Cost).
Figure 9 compares cumulative investment, O&M, electricity costs, and heat pump capacity additions over the 2030–2050 modelling horizon under the two scenarios. Lower-cost assumptions lead to greater heat pump deployment, with cumulative installed capacity reaching 3.13 GW in Scenario 1, compared with 1.78 GW in Scenario 2, confirming the strong influence of capital cost assumptions on heat pump uptake.
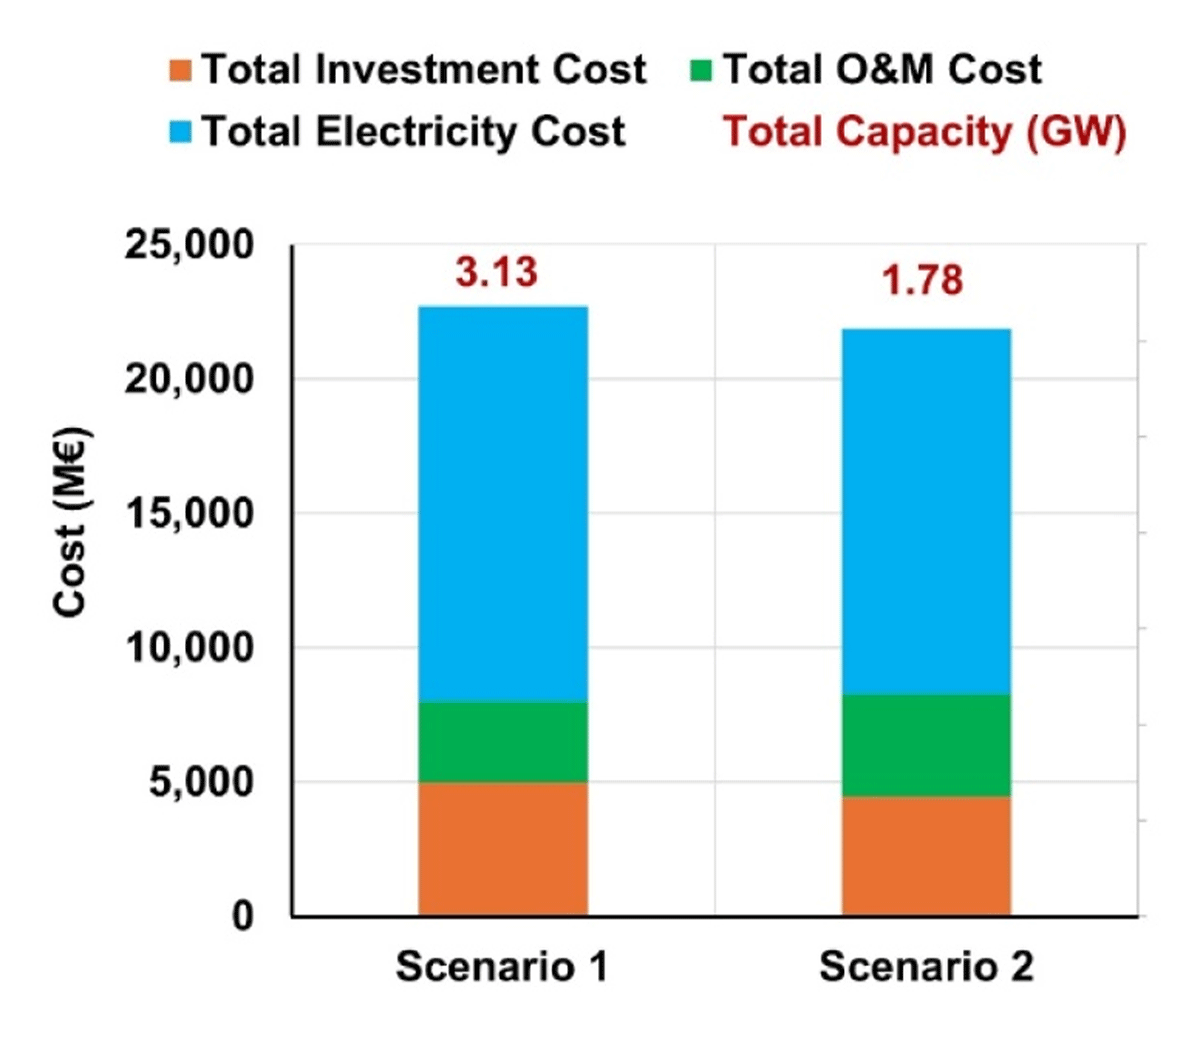
Figure 9
Comparative heat pump capacity and cost outcomes under Scenarios 1 and 2.
The lower-cost case also results in higher total investment expenditures, driven by greater installed capacity, while the higher-cost case constrains deployment. Differences are also observed in O&M and electricity costs, reflecting the influence of deployment levels on long-term system expenditures. Overall, the results show that cost assumptions directly influence both technology deployment and system costs, significantly affecting the representation of heat pumps in long-term energy planning models.
Effect of performance assumptions
The outcomes of Scenarios 3, 4, and 5 show technological pathways that are broadly similar to those of Scenario 1 in terms of capacity expansion and DHW generation. Differences emerge, however, in grid electricity demand associated with heat pump deployment, driven by the alternative COP assumptions.
Figure 10 illustrates annual grid electricity consumption under the three temperature-based scenarios, highlighting the sensitivity of electricity demand to heat pump performance. Scenario 4 (High COP) results in the lowest grid electricity consumption, reflecting higher efficiencies under upper-bound temperature conditions. By contrast, Scenario 5 (Low COP) produces the highest electricity demand, as lower efficiencies require greater electricity input to meet the same DHW demand. Scenario 3 (Reference COP) lies between these two cases.
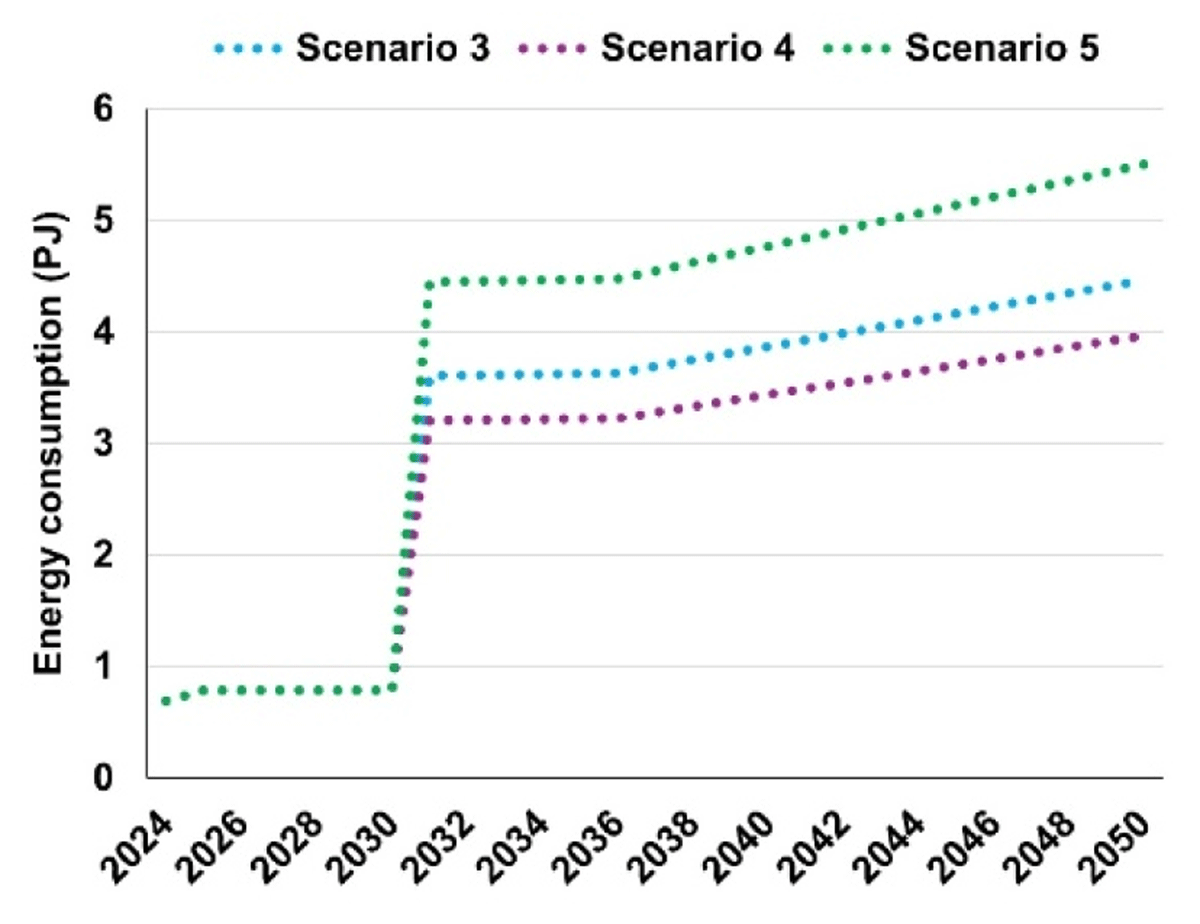
Figure 10
Annual grid electricity consumption under Scenarios 3, 4 and 5.
These results show that COP assumptions primarily affect electricity consumption rather than technology deployment, indicating that performance uncertainty influences operational energy requirements, associated electricity costs and potential consumer affordability. Overall, the findings highlight the importance of explicitly representing heat pump performance assumptions when modelling DHW electrification in long-term energy system studies.
Discussion and policy implications
Building decarbonisation is a central pillar of European climate policy, particularly under the EPBD, where electrification through high-efficiency technologies, such as heat pumps, is recognised as a key pathway to reducing residential greenhouse gas emissions. The modelling framework developed in this study contributes to this objective by providing a structured methodology for representing DHW heat pumps within long-term energy system planning using the open-source OSeMOSYS platform.
The scenario results show that heat pump representation in long-term optimisation models is highly sensitive to techno-economic assumptions. Under the BAU scenario, no heat pump deployment occurs, with solar thermal emerging as the dominant decarbonisation pathway. Alternative cost assumptions, however, significantly alter heat pump uptake, while performance assumptions primarily affect electricity demand rather than technology deployment. These findings highlight the importance of explicitly representing uncertainty in key modelling parameters, as technology adoption pathways may vary substantially depending on the assumptions applied.
A major challenge in representing DHW heat pumps is the limited availability of detailed national data on DHW consumption profiles, heat pump performance, and technology costs. Household hot water demand depends on behavioural factors such as occupancy patterns and daily routines, which are rarely captured in national statistics. Likewise, heat pump efficiency varies with climatic conditions, while detailed information on installed technologies and associated costs remains scarce. To address these constraints, the framework combines available national datasets with literature-based assumptions and simplified methodological approximations, providing a transparent basis for analysis under data-constrained conditions.
Beyond methodological considerations, the results raise important policy implications. The upfront investment required for DHW heat pump adoption may represent a significant barrier for households, particularly when installation costs and taxation are considered. Electricity tariffs and associated charges may further reduce the economic attractiveness of electrified heating solutions. These affordability constraints suggest that market uptake may remain limited without targeted policy support, such as subsidies, tax incentives, or dedicated financing mechanisms.
The electrification of DHW production also has implications for electricity system planning. Although the performance scenarios show broadly similar technology pathways, variations in COP assumptions significantly affect electricity demand, indicating that uncertainty in heat pump performance can materially influence grid planning outcomes. This is particularly relevant because DHW demand typically concentrates in morning and evening periods, potentially increasing local peak electricity demand if electrification occurs at scale.
At the same time, DHW heat pumps offer opportunities for flexibility through thermal storage. Since hot water can be produced and stored in advance, electricity demand may be shifted away from peak periods through smart control or demand response strategies, supporting renewable energy integration while maintaining service quality.
Overall, the findings demonstrate that accurate representation of DHW demand, heat pump performance, and economic assumptions is essential for robust long-term energy planning. Improving the availability of detailed DHW and heat pump data would strengthen future modelling efforts and support more reliable policy assessment of residential heating decarbonisation pathways.
Conclusions
Despite this work’s methodological contributions, several limitations remain. The analysis relies on aggregated datasets and literature-based assumptions due to the limited availability of detailed empirical data on DHW consumption patterns, heat pump performance, and technology deployment. In addition, the simplified time-slice structure of OSeMOSYS cannot fully capture short-term demand variability or the dynamic operational behaviour of heat pump systems. These limitations highlight the need for improved national datasets and monitoring to support more robust modelling.
The results show that data gaps and modelling assumptions can substantially influence the representation of DHW heat pumps in long-term national energy system models. Cost assumptions affect deployment pathways, while COP assumptions primarily influence projected electricity demand under the same decarbonisation constraints. This underlines the importance of transparency in parameter selection when using optimisation models to support building decarbonisation planning.
The study demonstrates that explicitly representing DHW technologies in long-term energy system models can provide insights into electrification pathways that may remain hidden in more aggregated building-sector representations. Documenting the assumptions and pragmatic modelling choices adopted under data-constrained conditions also improves transparency and reproducibility in long-term energy modelling.
Future work should extend the analysis to a broader range of technologies, policy scenarios, and behavioural assumptions, while strengthening the representation of affordability, flexibility, and electricity system interactions. Higher temporal resolution and improved coupling with electricity system models would further enhance the assessment of peak demand and infrastructure implications associated with large-scale DHW electrification.
Overall, this study provides a practical framework for integrating DHW heat pumps into national long-term energy system models under data-constrained conditions, supporting more informed planning of residential heating decarbonisation pathways.
Additional File
The additional file for this article can be found as follows:
PowerPoint Slides
PowerPoint Slides relating to this article. DOI: https://doi.org/10.66506/essp.7-108-26.s1
Acknowledgements
This research was co-financed by Component 5 – Capitalisation and Business Innovation, integrated into the Resilience Dimension of the Recovery and Resilience Plan within the scope of the Recovery and Resilience Mechanism (MRR) of the European Union (EU), framed in the Next Generation EU, for the period 2021–2026, within project ATE, with reference 56.
eceee paper ID
7-108-26