
Introduction – the need to guide consumers
The electrification of passenger cars and light commercial vehicles has been spurred on by the EU-level decisions to prohibit internal combustion engine (ICE) vehicles from 2035 (European Commission), with the focus being on lowering greenhouse gas emissions. The European Commission proposed recently to slightly relax this target (European Commission, 2025). Electrification in itself brings a significant improvement in energy efficiency due to the electrical motor’s superiority in this respect compared to the internal combustion engine. However, electric vehicles’ energy efficiency will need to – and can – improve further, which creates the potential to achieve an even more efficient European fleet. This is important in order to limit the impact on electricity demand from the electrification of light road vehicles for decades to come. Nor can it be ignored that ICE vehicles will continue to enter the market for at least another decade, and will be in use for a long time, so increasing their energy efficiency – and thus decreasing their CO2 emissions – is also needed.
Electrification reduces energy use during the use phase compared to ICE vehicles, but it also leads to an increased environmental and climate impact during manufacturing. Electric passenger cars sold in Europe today have about a third of the life cycle greenhouse gas emissions compared to a comparable petrol-driven vehicle, but this relationship is a snapshot in a time of rapid technological development (Bieker & Negri 2025). At the same time, battery production results in increased emission of heavy metals and chemicals that can cause human- and ecotoxicity. Studies show that these toxicity effects can be up to 20% higher from electric vehicles compared to ICE vehicles (Zhang, Xue & Li 2023), but advanced hydrometallurgical recycling processes can reduce them by 30–50%. Electric vehicles also require larger quantities of critical metals, but recycling can reclaim a large proportion of the metals, thereby greatly reducing primary material use (Yanqiu et al. 2021). The climate emissions of today’s electric vehicles compared to ICE vehicles are often offset after around 20,000 km of driving, by the much lower emissions during use (Bieker & Negri 2025). For these reasons, and not least because the landscape is changing so fast, providing information on life cycle impacts in a vehicle labelling scheme is important not only to quash misconceptions, but also to ensure that outdated knowledge is replaced by data that reflects the developments in manufacturing, recycling, electricity production and more in real time.
These impacts can vary greatly depending on several factors, not least the battery technology which is an area that is developing fast, but also the geographical location and the electricity mix used for the manufacture of the battery. Providing vehicle buyers with reliable information on these impacts could lead to more sustainable purchasing decisions, and in turn competitive advantages for manufacturers who minimize negative impacts. This information is however very difficult to access, and this is discussed further below.
Current focus on tailpipe emissions unfit for electric vehicles
The EU has had a basic legislative structure in place since 19991 regulating how information on fuel consumption and tailpipe emissions shall be presented to consumers for new passenger cars. Thirteen member states have implemented the directive as a label inspired by the EU energy label, but in most cases, it is based on tailpipe emissions.
This indicator does not differentiate between electric cars and thus does not provide any incentive for improving energy efficiency. Nor does it provide information on the emissions and environmental impact over the vehicle’s life cycle, providing no incentive for manufacturers to improve this aspect – which is even more important for electric vehicles than for ICE vehicles.
In December 2025 the EU Commission published a proposal2 for a revision of the current legislation. The proposal includes a harmonised label with a colour scale, as well as an EU-wide product database. The proposed label is based on tailpipe emissions.
The assignment to develop a label fit for the transition from fossil fuels to electric
This paper analyses the possibility of providing buyers with complex information about passenger cars and light commercial vehicles in a simple and easy-to-understand format, in order to encourage well-informed and more sustainable purchasing decisions. The analysis described in this paper is based on a government assignment given to the Swedish Energy Agency in 2024. The scope has been light duty vehicles, and as this is not a defined term in legislation, limits have been drawn to exclude busses, caravans and similar categories, in order to focus on passenger cars and light trucks.
The assignment was to present a proposal for a vehicle label showing at least tailpipe emissions, energy efficiency and life cycle emissions. The focus was to be on making the label easy to understand for consumers, and to improve the initial proposal for life cycle information that had resulted from the first assignment on the subject in 2022 (The Swedish Energy Agency, 2022).
The first step was to conduct desk research on the latest developments of EU member state implementation of the car labelling directive, the various studies and literature evaluating that directive, and the status of other related legislation at EU level. This research covered also the current marketing trends for vehicles and the availability of market data such as vehicles in the national vehicle registry.
The desk research was complemented by bilateral meetings to further explore the most relevant initiatives. These included discussions with the European Commission regarding both existing and forthcoming legislation. In addition, meetings were held with relevant French government authorities to gain a deeper understanding of their approach, in particular their environmental score based on a simplified life cycle assessment.
Meetings and a hearing were held with representatives from industry and from civil society. During the course of the assignment, stakeholder meetings were held to receive input from organisations from industry and from civil society.
As part of the government assignment, a group consisting of Swedish government authorities with expertise in light vehicles, transport, climate impact, public procurement, and consumer legislation was established. This group of authorities was consulted a number of times during the analysis phase, and valuable input was fed into the assignment regarding consumer needs, technicalities of vehicle registration, categorisation and type approval, consistency with other national policies and targets and more.
Within the Swedish Energy Agency, the working group conducting the assessment included in-depth knowledge of vehicle technology, long experience of policy and legislation regarding product labelling, extensive knowledge of energy efficiency, both regarding vehicles and in a broader sense, and legal and commercial knowledge of automotive marketing and distribution.
Methodology for designing a label fit for electrification
The choice of a label inspired by the EU energy label as a means to deliver complex information in a relatively simple way was part of the assignment. It has been used for energy-related products since 1994, and a vehicle is after all an energy related product. It has also inspired energy performance certificates for buildings in most EU member states. And as mentioned above it is used for vehicles in several other member states. Numerous studies and an EU barometer provide evidence of the high recognition from European consumers (European Commission 2024). The ability of the label to contribute to market transformation towards better performing products is well documented. This is achieved by conveying information to prospective buyers. The information and parameters on the label become purchasing criteria, thereby influencing purchasing choice. The label and the information contained in it will also serve as key selling points for manufacturers and dealers.
The design of the label comprises two main elements:
The information to be conveyed which includes: (i) the primary parameter for the main scale, including the appropriate indicator, number of classes, and thresholds defining these classes; (ii) the secondary parameters, including the appropriate indicators and, where relevant, the classes and thresholds; and (iii) any additional parameters deemed relevant;
The graphic design, including colours, pictograms and other visual elements to be tested through a consumer study.
The label needs to be designed in a way that addresses the transition from fossil fuels to electric vehicles, including when these different types coexist. One crucial aspect for electric vehicles is the developments with regards to life cycle assessment (LCA), for which an extensive mapping of published and ongoing initiatives regarding methodology and data for LCA of light motor vehicles was carried out. The scope of the mapping was primarily within the EU, both regional and national, as well as a scanning of significant initiatives from other regions/countries. This analysis was conducted by IVL Swedish Environmental Research Institute (hereafter referred to as IVL). The mapping listed relevant initiatives and also provided a preliminary assessment as to whether each initiative could provide data in a way that fulfilled the requirements of a labelling scheme. The results are summarised in the section below on life cycle assessment.
Defining the content of the label
This section determines the information points to be included in the label. First, the parameter and the indicator for the main scale is chosen. In connection with the colour scale, specific requirements for plugin hybrid vehicles were assessed. The colour scale then needed to be structured by setting the number of classes and class thresholds. Then the assessment of which additional information could be added to the label is included briefly. And finally, the work to identify the possibilities with regards to life cycle information is presented.
The choice of the indicator for the primary scale: tank-to-wheel final energy use per 100 km
Four indicators were identified as possible bases for the main colour scale: (i) Tailpipe CO2 emissions, (ii) well-to-wheel (WTW) CO2 emissions, (iii) tank-to-wheel (TTW) final energy use, and (iv) primary energy use, applying primary energy factors calculated on Swedish fuel/electricity. In simpler terms – emissions or energy, during use phase or from the fuel’s life cycle perspective. This section provides a brief description of the main challenges for each of the four indicators, with the pros and cons of each condensed into Table 1.
Table 1
Pros and cons of the four possible indicators for the main colour scale, where ZEV stands for zero emissions vehicle, and EV stands for electric vehicles.
| CO2 EMISSIONS – TAILPIPE | CO2 EMISSIONS – WELL TO WHEEL | TANK TO WHEEL FINAL ENERGY USE | PRIMARY ENERGY USE | |
|---|---|---|---|---|
| Drives innovation | No incentive for improving ZEVs | Gives incentive for improvement | Gives incentive for improvement | Gives incentive for improvement |
| Promotes energy efficiency | No differentiation of ZEVs | Differentiates between ZEVs | Somewhat exaggerates the relative efficiency of EVs | Yes, reflects the energy systems perspective but cannot take into consideration when (time of day/season) the energy is used |
| Promotes electrification | ZEVs promoted strongly | Yes | Yes | Weak promotion of EVs |
| Shows benefits of alternative fuels | Does not reflect actual climate impact | Shows actual climate impact | Does not reflect actual climate impact as fossil fuels are favouritised | Biofuels get worse ranking than fossil fuels |
| Differentiation within powertrain category | No differentiation of ZEVs | Yes | Yes | Can lead to inaccurate differentiation for dual-fuel vehicles |
| Differentiation between powertrain categories | ZEVs promoted strongly | Yes | Somewhat exaggerated promotion of EVs | Can favouritise fossil fuels and be unfavourable for electricity |
| Stability of data and over time | Stable over time, WLTP values | Values can be calculated in different ways and change over time | Stable over time, WLTP values | Primary energy factor for electricity and hydrogen can be calculated in different ways. Varies over time. |
| Internationally viable | Same in all countries | Differs between country/region | Same in all countries | Differs between country/region |
| Communicable | Easy to communicate but gives too little information | Difficult to communicate but more accurate information | Easy to communicate | Difficult to communicate |
Tailpipe CO2 emissions and TTW final energy use could both rely entirely on standardised data generated for each specific vehicle according to the Worldwide Harmonized Light Vehicles Test Procedure (WLTP). WLTP is a standardised test procedure to measure fuel and electricity consumption, CO2 emissions, pollutant emissions and electric range for electric vehicles. It is used in the EU for vehicle legislation, consumer information and vehicle registration.
First assignment –2022
The result of the analysis in the first assignment resulted in two main scales: the tank-to-wheel (TTW) final energy use and the well-to-wheel (WTW) emissions. The combination of the two indicators provided complementary information on both energy efficiency and CO2 emissions.
The TTW final energy use colour scale ranks vehicles according to their energy use in kWh per 100 km, i.e. energy efficiency. It is calculated on the vehicle’s WLTP combined fuel consumption multiplied by the energy content of the fuel. This provides differentiation both (i) between vehicles with different powertrains and (ii) among vehicles that have the same powertrain, thus providing incentives and room for further improvement and innovation also for electric vehicles. The TTW final energy use scale, expressed as kWh/100 km, can be considered an energy efficiency indicator as it refers to an energy consumption per distance, although it does not account for the number of passengers, volume or charge capacity of the vehicle.
WTW emissions illustrates the benefits of using biofuels, while bringing attention to emissions caused by electric vehicles even during their use phase, taking into consideration also the emissions for producing the fuel used, including electricity. This indicator varies over time, depending on the fuel composition or the origin of the electricity, and depends on the country in which the vehicle is driven.
Second assignment – 2024
The second assignment included instructions to simplify the label. Feedback received during the referral procedure confirmed the need to simplify, and also echoed concerns raised about the practicalities, as noted above, of the WTW emissions scale. This led to the removal of the WTW emissions scale, so that the label was left with just one colour scale representing TTW final energy use (kWh per 100 km). What is lost when the WTW emissions colour scale is removed is that the benefits of biofuels become less visible, and that there is no light shed on the climate impact of electricity use.
Finally, as mentioned above, the electrification of light transport is moving relatively fast, and by 2035 the vast majority of new light vehicles is expected to be electric vehicles, pursuant to the requirements foreseen in the Commission proposal for CO2 emission standards. A colour scale based on energy efficiency will remain relevant, and continue to achieve a meaningful spread of vehicles across the scale, throughout the transition to electric vehicles.
Information about light vehicles’ energy efficiency is not difficult to access, but is currently difficult to compare between zero emission vehicles, plugin hybrid vehicles, ICE vehicles. Providing this comparison in an mandatory car label would not only encourage buyers to choose a more efficient vehicle, but also in general raise awareness of the differences in energy efficiency of available vehicles.
Measurement method specific to plugin hybrid vehicles
Plugin hybrid vehicles (hereafter PHEVs) can exhibit very different energy efficiency depending on the operating modes used. It is the vehicle’s technical capabilities, the user’s charging behaviour and the vehicle’s settings that determine which operating mode is used most. The two extreme cases are battery mode, or fuel mode. WLTP measures energy use and CO2 emissions over a series of cycles on battery mode and fuel mode, and a calculation model then uses utility factors to produce values for energy use and CO2 emissions while driving with an estimated average share of battery and fuel, respectively (weighted combined WLTP values). The utility factors were considered representative of the use of PHEVs at the time of introduction and were developed to make PHEVs comparable to vehicles that are driven traditionally.
The results of the analysis with regards to PHEV energy efficiency values showed that it is possible to use WLTP values to show the energy use when driving in battery mode and in fuel mode. This information is available in the vehicle’s certificate of conformity and type approval but is often difficult to find in marketing material. To make the information more accessible and understandable for the consumer, the label for PHEVs should include three arrows on the colour scale, showing
energy use during battery mode
energy use during fuel mode and
energy use according to the combined weighted value.
We also reviewed the possibility of complementing the information provided by the three arrows in the colour scale with additional information on fuel and electricity consumption in the three driving modes. In particular, when a PHEV is driven in battery mode, some vehicles can supplement with the fuel engine in certain situations, depending on how the manufacturer has chosen to optimize the interaction between the two engines. Some fuel consumption can therefore occur when driving in battery mode, in addition to energy consumption from the battery, which would be of interest to the buyer, and which is very difficult to obtain from marketing information.
The proposal to have three arrows in the colour scale for PHEVs is expected to increase consumer understanding of the energy efficiency of PHEVs and highlight the benefits of driving on electricity. The results of the consumer panel survey suggested that there was a relatively strong interest for this information, where over 60% of the respondents stated that they were interested in the arrows showing energy use for driving on battery and on fuel. There was also relatively good understanding of the information.
Defining the number of classes and thresholds for the main scale
In this section the number of classes and the thresholds for the main scale are determined. For this, a data set of all new vehicle registrations between January 2022 and October 2024 was extracted from the Swedish vehicle registry. The data analysis was performed with Power BI. The objective of the scale was to provide:
differentiation between vehicles with different powertrains,
differentiation among vehicles with the same powertrain, and
room for further improvement and innovation, also for electric vehicles, for the next ten years. This necessitates leaving the best class empty at the time of adoption for technological advancements.
In the Power BI tool, the class thresholds for the colour scale could be changed and the impacts of such changes on the spread of the vehicles on the scale were visualised in real time. This enabled analyses with regards to how well the scale could achieve the objectives above. This analysis showed that ten classes would be required, instead of the seven classes typical of the EU energy label.
The proposed scale for passenger cars, resulting from the analysis, is presented in the figure and table below. The bar chart shows that there is good differentiation both within and between the three main powertrains (electric, petrol/electric and petrol). Table 2 shows the proposed thresholds that are the basis of the result in Figure 1. The PHEV placings are based on the weighted combined WLTP values.
Table 2
Preliminary class thresholds for passenger cars.
| CLASS | MAX (kWh/100 km) |
|---|---|
| A | 11.5 |
| B | 13.8 |
| C | 16.6 |
| D | 20 |
| E | 24 |
| F | 29 |
| G | 35 |
| H | 42 |
| I | 50 |
| J | 300 |
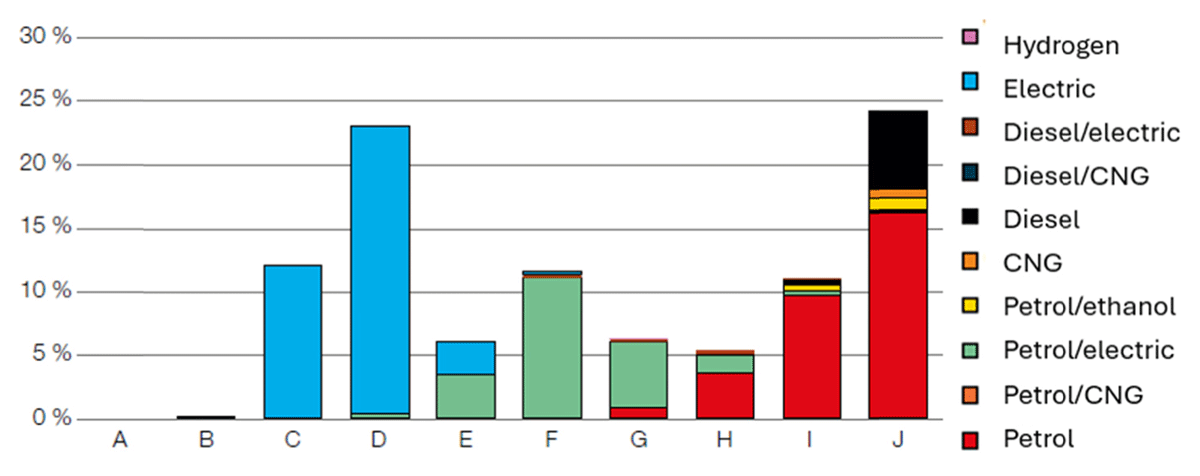
Figure 1
Passenger cars market share’s placing on A–J scale shown by powertrain category.
The choice of secondary parameters
In this section, the selection of the secondary parameters is described. One of these parameters is tailpipe emissions (expressed in CO2 per 100 km). The others relate to the propulsion battery and the vehicle’s weight.
Propulsion battery – carbon footprint, range and warranty
Given the adoption of the EU battery regulation,3 there are several potential information requirements that could provide a vehicle labelling scheme with interesting data on the propulsion battery for all vehicles that contain one. Several options were reviewed, such as the batteries’ carbon footprint (as regulated in article 7 of the EU battery regulation), recycled content (article 8), electrochemical performance and durability (article 10), and other information to be made available in the battery passport (annex XIII). While the proposal suggested that the carbon footprint battery label (expressed in kg CO2/kWh capacity, on an A-to-E scale) should be included in the vehicle label, it would now appear to be defunct, as the delegated act regulating this calculation method is much delayed, and the LCA methodology for the full vehicle is likely to be finalised very soon after the delegated act is adopted.
Information on recycled content was deemed to be potentially misleading as it only applied to certain materials, which not all batteries contain. The information is also of very minor relevance in the context of the vehicle’s overall environmental impact, and therefore not suitable for the vehicle label.
Information on the battery’s performance and durability as stipulated in the battery regulation was reviewed but considered too complex and not adequately relevant. It applies to the battery as an end product. A vehicle manufacturer configures and adapts the battery to optimize the vehicle in which the battery is to be installed, in relation to the performance that the manufacturer wants the vehicle to achieve and the commercial guarantees that the vehicle manufacturer offers for the vehicle and the battery. This means that the information about the battery’s electrochemical performance and durability required under the battery regulation is relevant for the buyer of the battery (i.e. the vehicle manufacturer) but is not easily translatable into comparable values for the person purchasing the vehicle. An alternative is to show the battery’s commercial warranty on the label, and this was the conclusion in the proposal. Having the commercial battery warranty on the label can promote manufacturers that provide a battery warranty that goes beyond the minimum requirements of Euro 7 and allows for easier comparison of this information.
While there are pros and cons to showing electric range on a label, there was strong interest in the information shown in the consumer survey (72% stated that electric range should be on the label). It is only relevant to show electric range, as this is still a reason why some buyers hesitate to buy electric vehicles whereas range is no issue for ICE vehicles. There is a risk that information about electric range promotes larger batteries, as a larger range is generally perceived as better. However, as a larger range is usually associated with a higher purchase price, the assumption is that the label will not influence the choice of range to any great extent.
Information on the battery was clustered on the label. ICE vehicles will have no information on the battery as it applies only to the propulsion battery. Non-plugin hybrids would only have the colour scale, and PHEVs and electric vehicles would have all the information related to the battery.
Vehicles’ weight
The purpose of including information on weight is primarily to raise the issue of vehicle weight, and thereby size, onto the agenda. The vehicle fleet in Sweden is moving towards larger and heavier vehicles (Gröna Mobilister 2025), which generally leads to higher emissions, higher fuel consumption, increased wear on infrastructure, increased risk of injury for pedestrians, cyclists and drivers of smaller vehicles (T&E 2025; Robinson et al 2025), and greater extraction of materials (including larger vehicle batteries) during manufacturing. The weight of the vehicle is especially important in comparison between technically similar vehicles (Ricardo Energy and Environment 2020).
Information points not selected – costs and air pollution
Several options were considered for inclusion on the label. One parameter relates to costs (capital costs, running costs and total cost of ownership). Although this information is relevant for consumers and is included in other jurisdictions’ information requirements it is difficult to incorporate into a static label, as prices are constantly changing and are influenced by market conditions, tax policies and the choice of fuel.
The mandatory emission limits for carbon monoxide (CO), hydrocarbons (HC), nitrogen oxides (NOx) and particulate matter for new cars have been tightened in stages since the introduction of exhaust emission requirements. The latest tightening to Euro 7 consists of an extension of how long the vehicle must meet the emission requirements and what deviations are allowed between laboratory emissions and real driving under extended test conditions, as it is generally considered difficult to lower the limit levels further. The vehicles sold today are relatively good at filtering the particulate matter from the emissions, and there is not much variation between vehicles.
The particulate matter emissions that are currently considered most problematic are those caused by braking wear and tyre abrasion. These emissions are regulated for the first time in Euro 7, with requirements for tyre wear that will come into force in stages starting in July 2028. The UNECE has recently published a testing method for tyre abrasion and microplastic emissions (UNECE 2026), but it was not published at the time of the assignment. Requirements for particulate emissions from braking differ between electric vehicles and other vehicles, as electric vehicles have lower levels of brake particles as a result of regenerative braking (i.e. braking using electric motors that charge batteries) (Dornoff & Rodríguez 2024). It could be relevant to show the differences in the total particulate emissions from different powertrains in the label (vehicle-specific information is unlikely to be available), but for this to provide a fair comparison, all three types of emissions must be included, which was not possible at the time of the assignment. Also, the stringency level of emissions in Euro 7 leaves limited room for improvement. Thus, the information on air pollution was not included in the proposed label.
Life cycle assessment – the missing element
The first prerequisite for being able to provide vehicle-specific data on life cycle information in a car labelling scheme is the existence of an LCA methodology that all manufacturers must use. In the first assignment, there were no such methods in place, and instead the Swedish Energy Agency gave IVL the task of presenting a suggestion for category-based default values. Based on the latest findings in research, IVL proposed default values of life cycle emissions and life cycle energy use, calculated based on the vehicle’s powertrain weight and vehicle type (Dahllöf, Lundström & Larsson 2022). The label proposal included a section illustrating these default values in relation to the use phase, as shown in Figure 2.
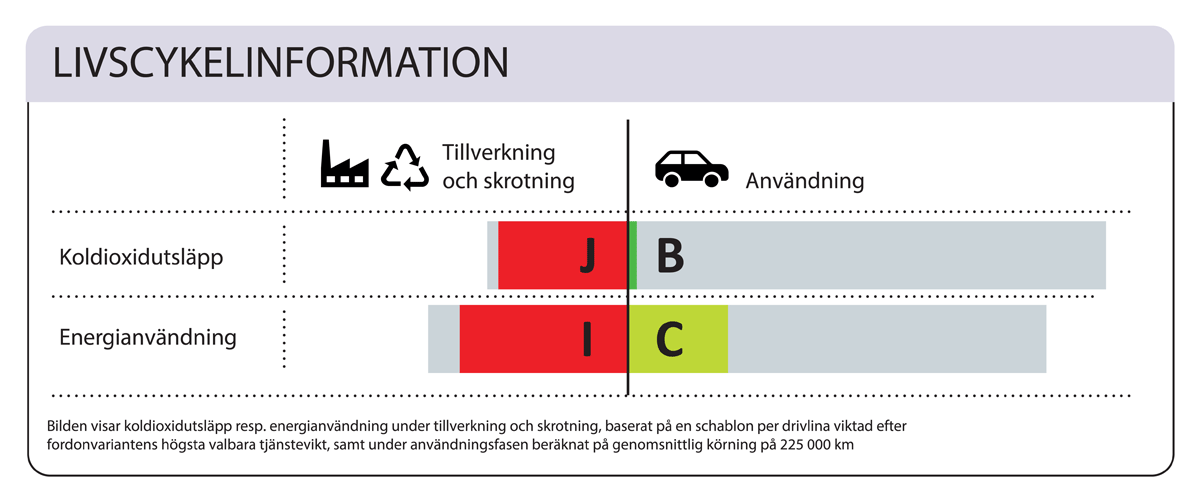
Figure 2
Early proposal for life cycle information based on default values calculated on vehicle type, weight and powertrain, showing CO2 emissions and energy use, during manufacture and end-of-life on the left, and use phase on the right. This example is for an electric vehicle.
The analysis of other life cycle impacts than emissions and energy use was deemed too complex to be included. However, the use of default values received little support in the feedback from the referral procedure, due mainly to the lack of visibility for those manufacturers who make an extra effort to monitor and minimize the life cycle impacts of their car manufacturing. There was strong support for including life cycle information in a labelling scheme, but the general consensus was that the information should be specific to the vehicle in question and not default values. So, for the second assignment, the starting point was to assess the availability of an LCA methodology that could serve as a common basis for a labelling scheme. The results of this assessment, as carried out by IVL, are presented in Table 3.
Table 3
IVL’s summary of relevant initiatives and methods to calculate the LCA of a vehicle, at time of analysis in December 2024.
| METHOD | SCOPE | ENVIRONMENTAL ASPECTS | TYPE OF METHOD | THIRD PARTY VERIFICATION | TIME-PLAN | RELEVANT FOR SWEDISH LABELLING SCHEME |
|---|---|---|---|---|---|---|
| Green NCAP | Whole vehicle | Climate impact | Labelling of vehicles based on default values | N/A | Published | Yes, for a default-value based scheme |
| PCR for passenger cars | Whole vehicle | 8 aspects | LCA-method | Yes | Published | Yes, as basis of vehicle-specific data from manufacturers |
| Tran-Sensus LCA | Whole vehicle | Several categories in addition to climate impact. | LCA-method | Yes | 2023–2025 | Yes, as basis of vehicle-specific data from manufacturers |
| GBA Rulebook | Batteries | Climate impact | LCA-method | Yes | Published | Yes, for batteries as input in label |
| UNECE IWG LCA | Whole vehicle | Climate impact | LCA-method | Highly likely | 2023–2025 | Yes, as basis of vehicle-specific data from manufacturers |
| Catena-X Rulebook | Components | Climate impact | LCA-method | Yes | Published | No |
| HIQ-LCA | Batteries | N/A | Improved generic LCA data | N/A | 2023–2025 | No |
| GREET | Whole vehicle | Climate impact | Builds on LCA-method with possibility to calculate simplified LCA:s in a tool | N/A | Published | Yes, for a default-value based scheme |
| CATARC | Whole vehicle | Climate impact | Simplified LCA-method | Not known | Published | Yes, partially |
| EU Battery regulation | Batteries | Climate impact | LCA-method | Yes | 2024 (but not yet published) | Yes, for batteries as input in label |
| LCA method, EU regulation 2023/851 | Whole vehicle | Likely climate impact | LCA-method | Highly likely | End of 2025 | Yes, as basis of vehicle-specific data from manufacturers |
Since the table was compiled, the TranSensus LCA methodology has been published (Bein & Cerdas 2025). IVL’s assignment also included assessing the suitability of the identified LCA methodologies for a vehicle label, based on the availability, completeness and comparability of the resulting data. The timetable for the publication and application of the LCA methodologies was also to be assessed. For the latter, IVL analysed the possibility of developing a proposal for how life cycle information could be presented in a vehicle label in 2025 (i.e. within the assignment) or in 2026 or later. As can be seen from Table 3, the issue of LCA of vehicles is highly topical and several initiatives are underway to develop calculation methods, databases, supporting documents, etc. IVL assessed that the product category rules for passenger cars (referred to in Table 3 as PCR for passenger cars) constitute an LCA methodology that has the potential to form the basis for life cycle information on a Swedish label that could be produced as early as 2025. One disadvantage that was identified was that this method differs from the method that the EU Commission is working on. This ongoing work at EU level is indicated in the last row of the table. According to Regulation (EU) 2023/851 Article 1(6) (which introduces a new Article 7a “Life cycle carbon emissions” in Regulation (EU) 2019/631), the EU Commission undertakes to develop a “methodology for the assessment and the consistent data reporting of the full life-cycle CO2 emissions of passenger cars and light commercial vehicles”. This method was to be published in a report, and established in a delegated act, by 31 December 2025. From 1 June 2026, it was to be possible for manufacturers to submit information on the life cycle emissions of their vehicles, calculated using the Union method, to the European Commission on a voluntary basis. The deadline for publication has not been met, and there is currently little visibility regarding when the method is likely to be published. However, IVL considers that the method is expected to have significant influence and legitimacy within the industry, and that it is suitable as a basis for life cycle information in a vehicle labelling scheme.
Given the pending harmonisation of an LCA methodology for vehicles on EU level, there is little merit in assessing other options for calculation methods at national level. Even when the LCA methodology has been established, there are additional aspects that need to be considered when the information is to be used in a vehicle label. The LCA methodology specifies which parameters are to be included in the calculation, which system boundaries that are to be applied, which functional unit is to be used, which type of data is to be required (primary or secondary) and how uncertainties are to be handled, etc. According to Article 7a in Regulation (EU) 2019/631, the methodology shall also include “consistent data reporting”. Depending on how detailed the LCA methodology is, it may need to be supplemented with standards or other detailed provisions for how each parameter is to be measured/calculated. This specification of the LCA methodology is necessary when the methodology is to be used to compare products. The LCA methodology must be applied in the same way by everyone in order for the results to be comparable. In order to be able to use the LCA methodology for a vehicle label, where the very purpose of the life cycle information is to compare vehicles, it is therefore necessary to ensure either that the methodology is sufficiently specified, or that complementary standards are in place.
Legislative requirements to label vehicles also need an appointed market surveillance authority to be responsible for the vehicle label, and this authority must also be able to check and verify that the life cycle information is correct. Most of the other information points in the proposed vehicle label can be taken from the vehicle type approval, which is already subject to verification and supervision by an authority under other existing legislation. Vehicle-specific life cycle information has no such regulatory context. This means that conformity assessment procedures (which regulate how manufacturers shall prove the correctness of the life cycle information they submit), and market surveillance procedures (which regulate how the authority checks that the information is correct) need to be established. This is a prerequisite for the responsible authority to be able to supervise the requirements, and thus for the legal certainty of the requirements.
Testing the label design to improve consumer comprehension
When we had a preliminary list of information points the label was to contain, including the colour scale, a graphic designer composed a label proposal. The label proposal was also tested in a consumer survey (The Swedish Energy Agency 2025, Annex 2), carried out by Novus, with 1,000 respondents, representative of the Swedish population, with some limits such as maximum age and holders of a driver’s license. The bulk of the survey focused on understandability and clarity of the various parts of the label, but it also included questions on how the label would influence a purchasing decision. This part of the survey was however limited to a self-assessment, and the results of that part are therefore less robust as self-assessments are generally known to be over-optimistic with regards to how environmental aspects impact purchasing decisions (Folkvord et al 2020).
Conclusions
The objective of the government assignment to the Swedish Energy Agency was to create a label to guide consumers through the transition towards electrification of passenger cars and light commercial vehicles. The existing EU legislation that has applied since 1999, and also the current proposal for development of this legislation, focuses on comparability of tailpipe emissions. This may appear appropriate for transitioning away from fossil fuel driven vehicles. However, this indicator does not differentiate among electric cars and thus does not provide incentive for improving energy efficiency. Nor does it provide information on the emissions and environmental impact over the vehicle’s life cycle, providing no incentive for manufacturers to improve this aspect – which is even more important for electric vehicles than for ICE vehicles.
A label to address the use phase
The first step was to address the use phase. The label proposed by the Swedish Energy Agency is shown in Figure 3 with an example for an electric vehicle and Figure 4 with an example for a PHEV (a label for ICE vehicles was also proposed and is available in the main report). The parameters and the information, as well as its design were determined as described in the previous chapters of this paper. The comprehension by consumers was also tested in a consumer survey.
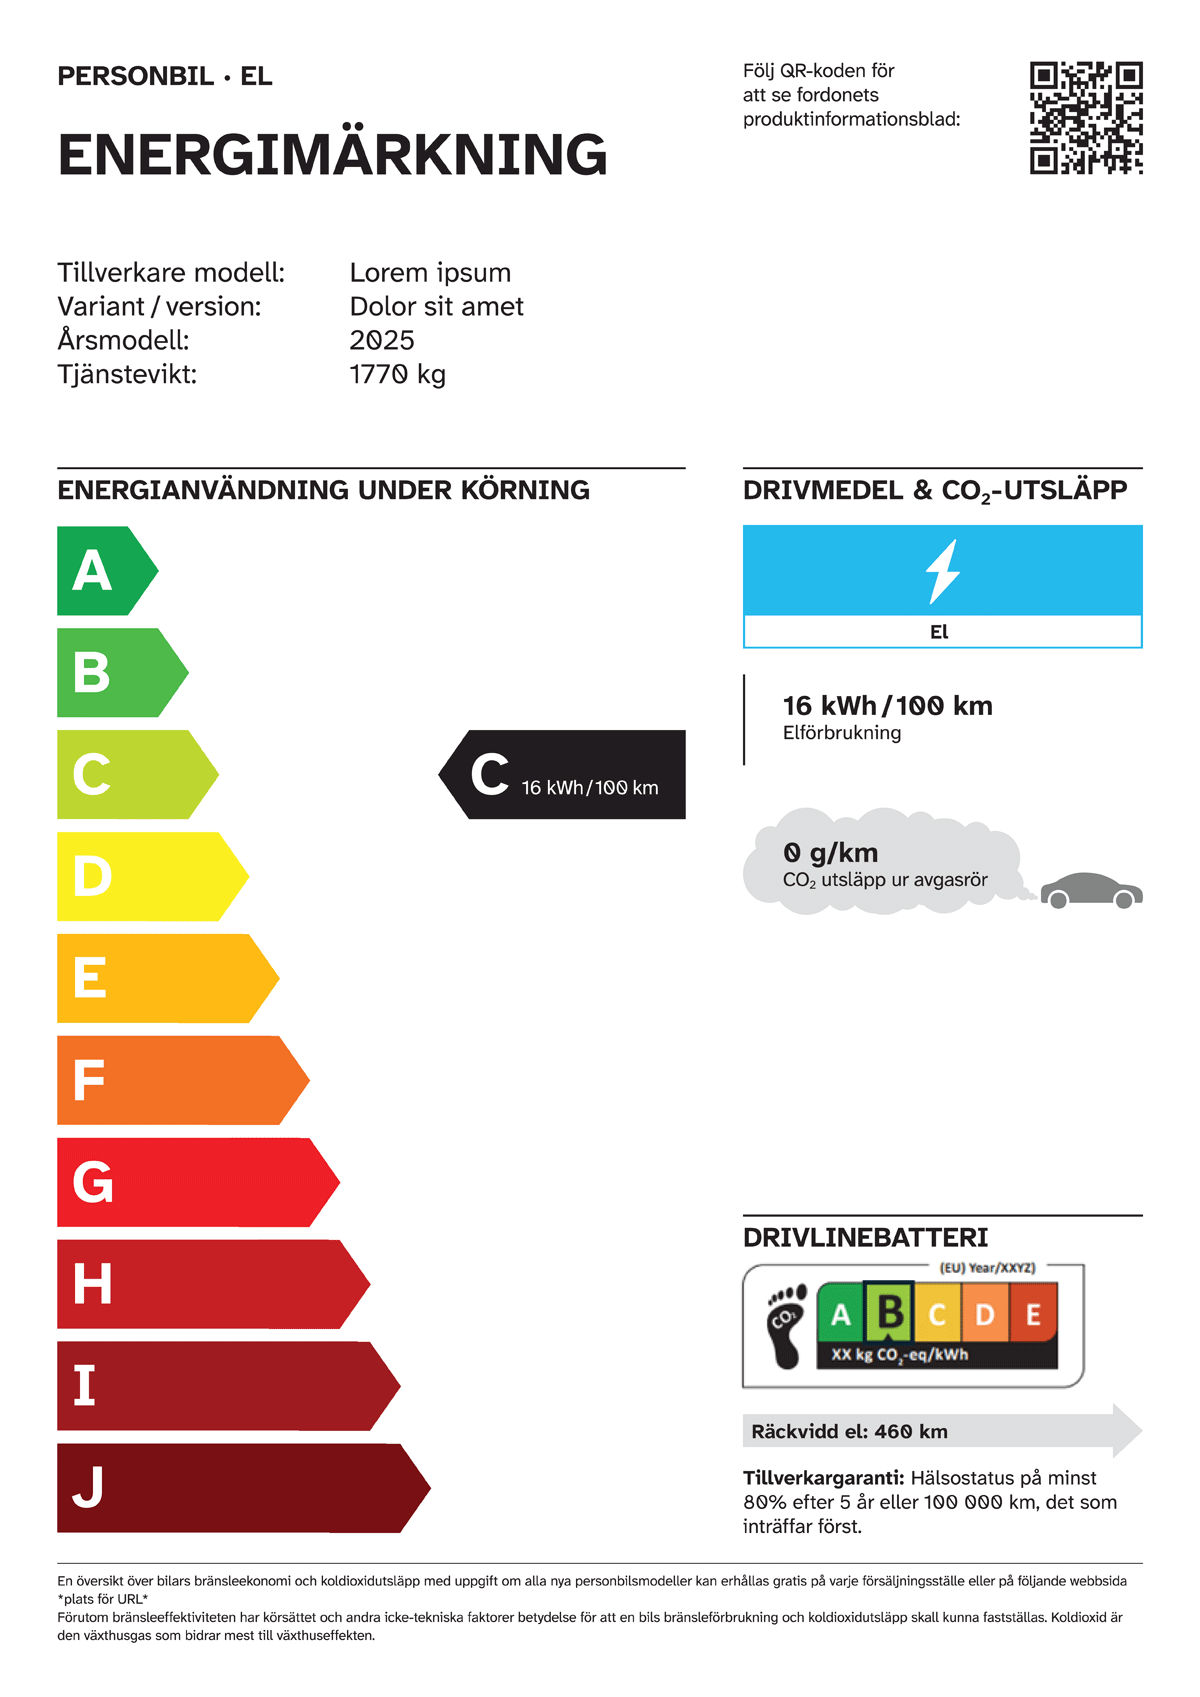
Figure 3
Label proposal for electric passenger car.
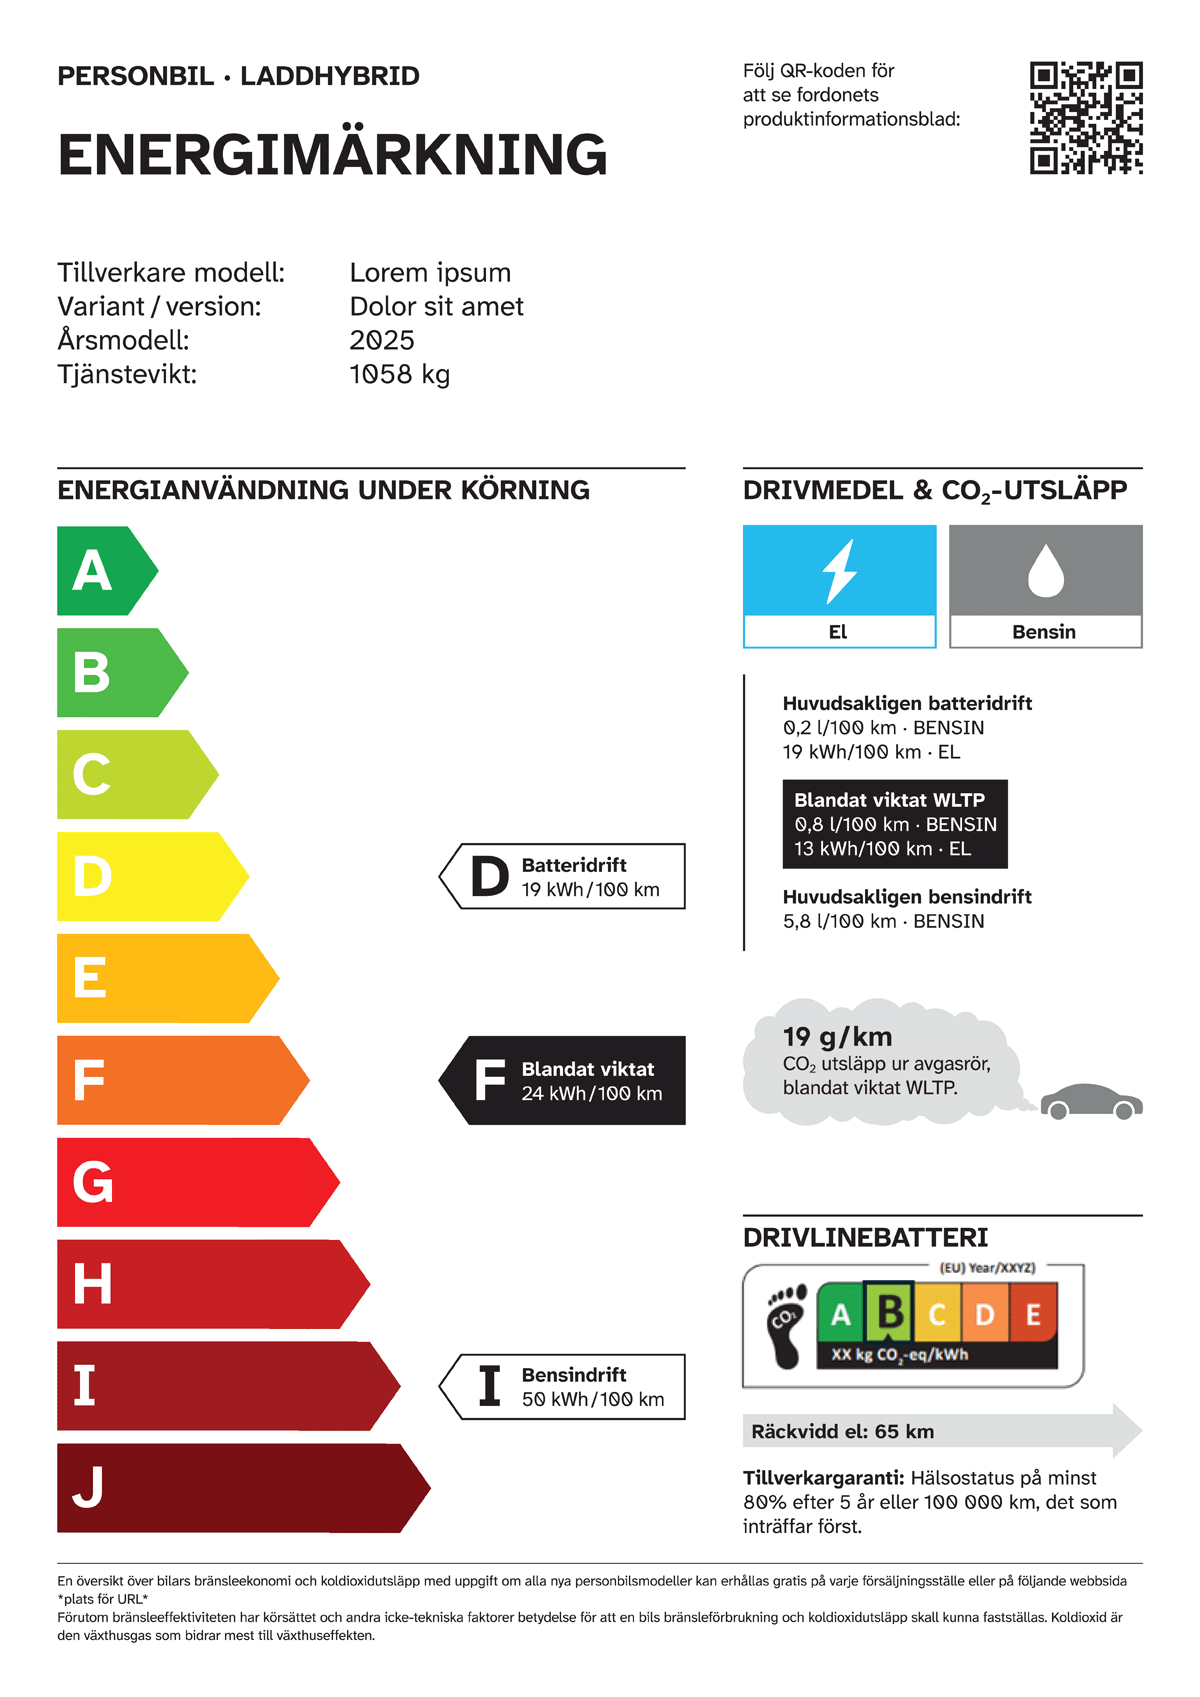
Figure 4
Label proposal for plugin hybrid passenger car.
The colour scale based on energy efficiency is the dominant message of the proposed label and it provides a clear and simple ranking of vehicles. Even a buyer who pays little attention to the details of the label should be made aware of the placing on the colour scale. Electric vehicles (Figure 3) and ICE vehicles have one arrow, while PHEVs (Figure 4) have three arrows.
The section on the propulsion battery will not be included in the label for ICE vehicles. For hybrid vehicles (non-plugin) only the colour scale for the battery would be included, as they have no WLTP electric range and seldom any commercial battery warranty.
The above proposal is more complex and contains more information than the current EU Commission proposal, which is based on tail pipe emissions. The main difference is of course the main scale indicator, and the subsequent spread of vehicles on the scale. The dominant messages of the two different labels are therefore different. The EU Commission proposal promotes all zero emission vehicles without discretion. The proposal above promotes the most efficient electric vehicles, while still promoting all electric vehicles in comparison to other powertrains, and it also promotes driving PHEVs on electricity.
The electrification of the transport sector will significantly increase the demand for electricity and raw materials for batteries, and it is therefore important to simultaneously strive for the most efficient vehicle fleet possible. The vehicles added to the fleet today will be on the roads for a long time to come. It is therefore important to promote not only electric vehicles but above all energy efficient electric vehicles. A labelling scheme promoting energy efficient vehicles would not only contribute to the energy efficiency targets but also raise awareness of the variation of performance with regards to energy use and energy efficiency within the category electric vehicles.
Life cycle assessment, the missing part: state of play and next steps
The analysis demonstrates that the inclusion of life cycle information in vehicle labelling is highly dependent on the availability of a harmonised and widely accepted LCA methodology.
Initial efforts based on category-level default values provided a temporary solution, but these were not well received by stakeholders, as they failed to reflect differences in manufacturers’ performance and did not incentivise improvements in life cycle impacts. There was, however, strong overall support for integrating life cycle information, provided that it is specific to individual vehicles.
The extensive assessment of existing methodologies shows that the field of vehicle life cycle analysis is rapidly evolving, with several initiatives underway. While approaches such as Product Category Rules (PCR) could enable near-term implementation, their divergence from emerging EU-level methodologies limits their long-term suitability. The forthcoming EU methodology, mandated under Regulation (EU) 2019/631, is expected to become the reference framework due to its anticipated legitimacy and harmonisation benefits, even though delays in its development create uncertainty regarding timing.
The findings further highlight that methodological harmonisation alone is insufficient. For life cycle information to be meaningful and comparable, the methodology must be applied consistently and may require additional detailed standards. Unlike other vehicle data, life cycle information currently lacks established procedures for conformity assessment and market surveillance. The development of such frameworks is essential to ensure data reliability, enforce compliance, and provide legal certainty.
Overall, the study concludes that while life cycle labelling is both desirable and feasible, its implementation depends on EU-level harmonisation and the establishment of robust verification and governance mechanisms.
Additional File
The additional file for this article can be found as follows:
Presentation for discussion on the paper: A label to power the electric car shift – guiding consumers through the transition from fossil fuels to electrification
Powerpoint presentation used for discussion purposes when presenting the paper, covering legislative background information, label proposals, summaries of analyses, and conclusions. DOI: https://doi.org/10.66506/essp.6-169-26.s1
Notes
[1] Directive 1999/94/EC of the European Parliament and of the Council of 13 December 1999 relating to the availability of consumer information on fuel economy and CO2 emissions in respect of the marketing of new passenger cars.
eceee paper ID
6-169-26