
Table 1
Countermeasures listed in Long-term Energy Supply and Demand Outlook, their planned dissemination ratio and energy saving, and progress in Fy2023.
| RESIDENTIAL SECTOR | |||||||
|---|---|---|---|---|---|---|---|
| COUNTERMEASURES | DISSEMINATION RATIO | EXPECTED ENERGY SAVINGS [PJ] (FY2030) | DISSEMINATION PROGRESS IN FY2023* | ||||
| FY2012 | FY2030 | TOTAL | ELECTRICITY | FUEL | |||
| Promotion of energy efficient housing (New construction) | 6% | 30% | 97.9 | 24.5 | 73.4 | 43% | |
| Promotion of energy efficient housing (Renovation) | 35.2 | 9.1 | 26.1 | 67% | |||
| Promotion of high-efficiency water heaters (Thousands of units) | Heat Pump | 4,000 | 15,900 | 102.7 | –10.9 | 113.4 | 49% |
| Condensing boiler | 3,400 | 30,500 | |||||
| Fuel Cell | 55 | 3,000 | |||||
| Promotion of high-efficiency Lighting | 9% | Nearly 100% | 75.0 | 75.0 | 241% | ||
| Improvement in appliance energy efficiency by the Top-runner Standard | – | – | 65.7 | 56.6 | 9.1 | 53% | |
| Comprehensive Energy Management | HEMS etc. | 0.20% | 85% | 83.7 | 74.1 | 9.7 | 29% |
| Energy-saving information provision rate | 0% | 80% | |||||
| Encouraging effort by citizens | – | – | 6.7 | 4.2 | 2.4 | ||
| NON-RESIDENTIAL SECTOR | |||||||
| COUNTERMEASURES | DISSEMINATION RATIO | EXPECTED ENERGY SAVINGS [PJ] | DISSEMINATION PROGRESS IN FY2023* | ||||
| FY2012 | FY2030 | TOTAL | ELECTRICITY | FUEL | |||
| Promotion of energy efficient building (New construction) | 23% | 57% | 156.1 | 76.5 | 79.6 | 33% | |
| Promotion of energy efficient building (Renovation) | 55.5 | 22.8 | 32.7 | 52% | |||
| Promotion of high-efficiency water heaters | Condensing boiler | 7% | 44% | 20.0 | 3.4 | 16.6 | 64% |
| Heat pump water heater | |||||||
| High-efficiency boiler | |||||||
| Promotion of high-efficiency lighting | 9% | Nearly 100% | 75.7 | 75.7 | 235% | ||
| Improvement in equipment energy efficiency by the Top-runner Standard | – | – | 132.6 | 132.6 | 75% | ||
| Comprehensive Energy Management | 6% | 47% | 92.4 | 50.9 | 41.6 | 58% | |
| Encouraging effort by occupants’ | – | – | 0.9 | 0.9 | |||
[i] *Source: Ministry of Environment (2025).
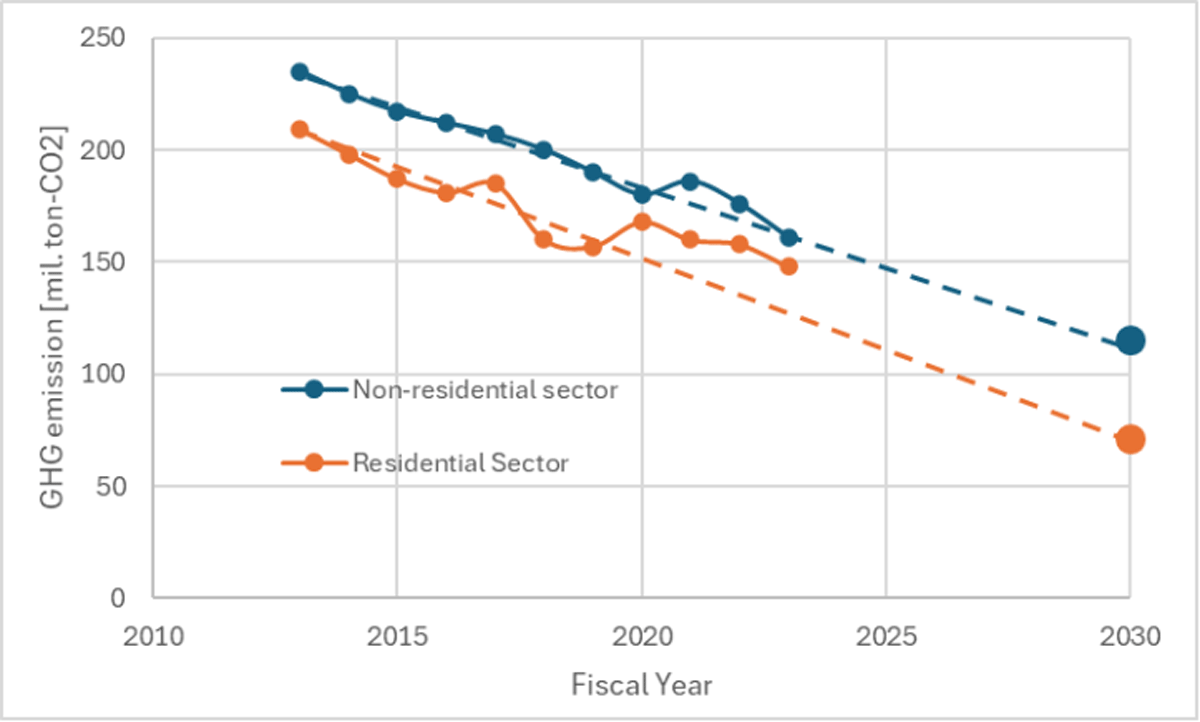
Figure 1
Progress of Japanese GHG emission reduction in the Residential sector and Non-residential Sector (National Institute for Environmental Studies, 2025).
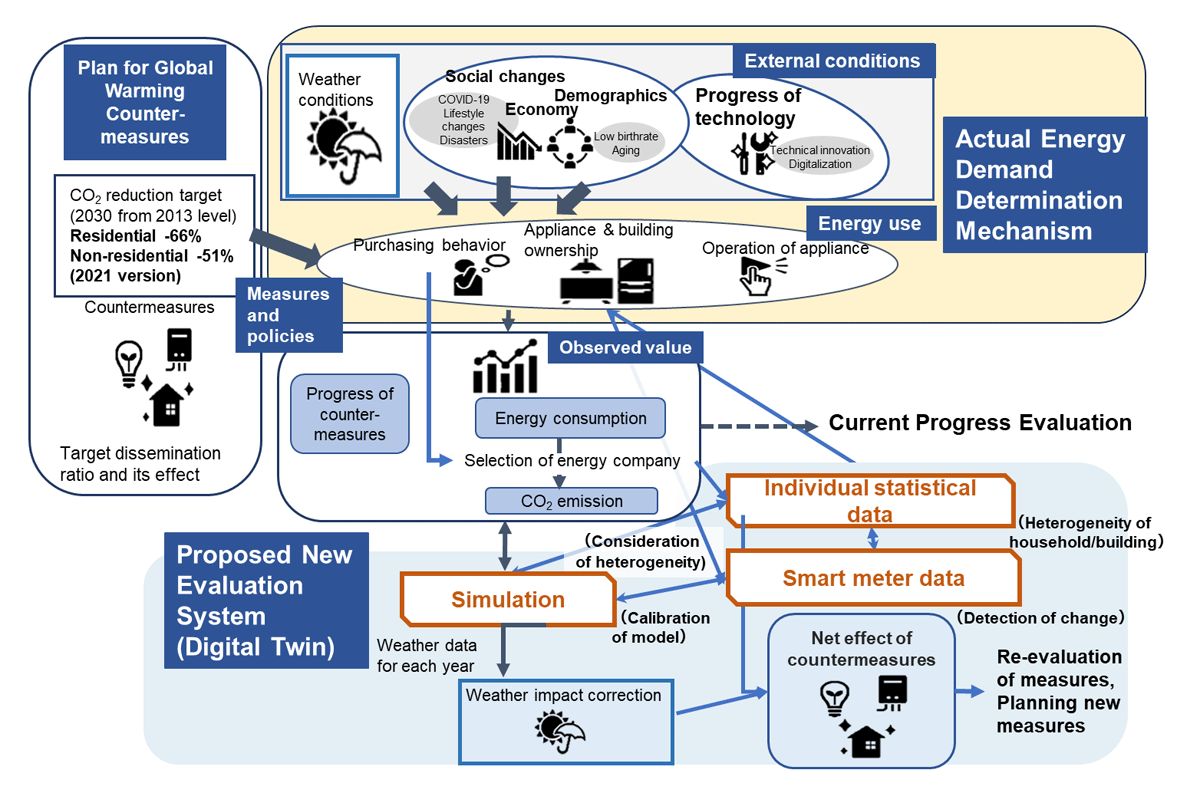
Figure 2
Overview of proposed energy and carbon management system.
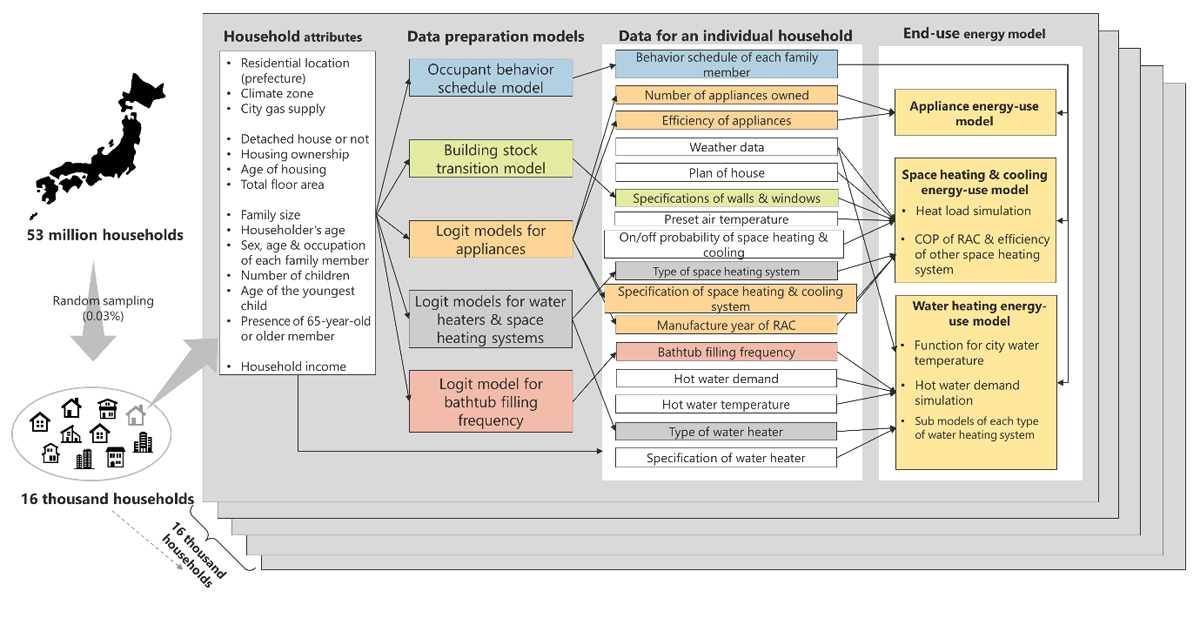
Figure 3
Procedure of the TREES simulation model.
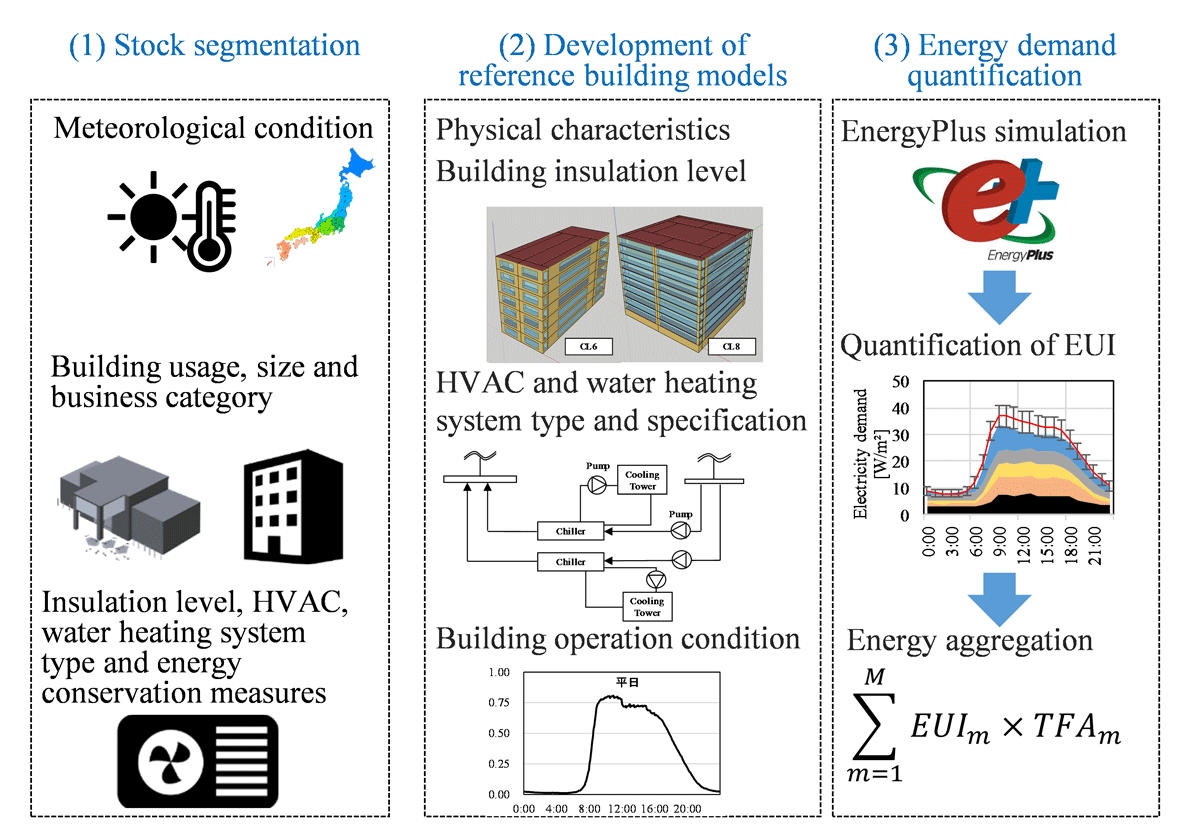
Figure 4
Overview of the model for the Japanese non-residential building stock.
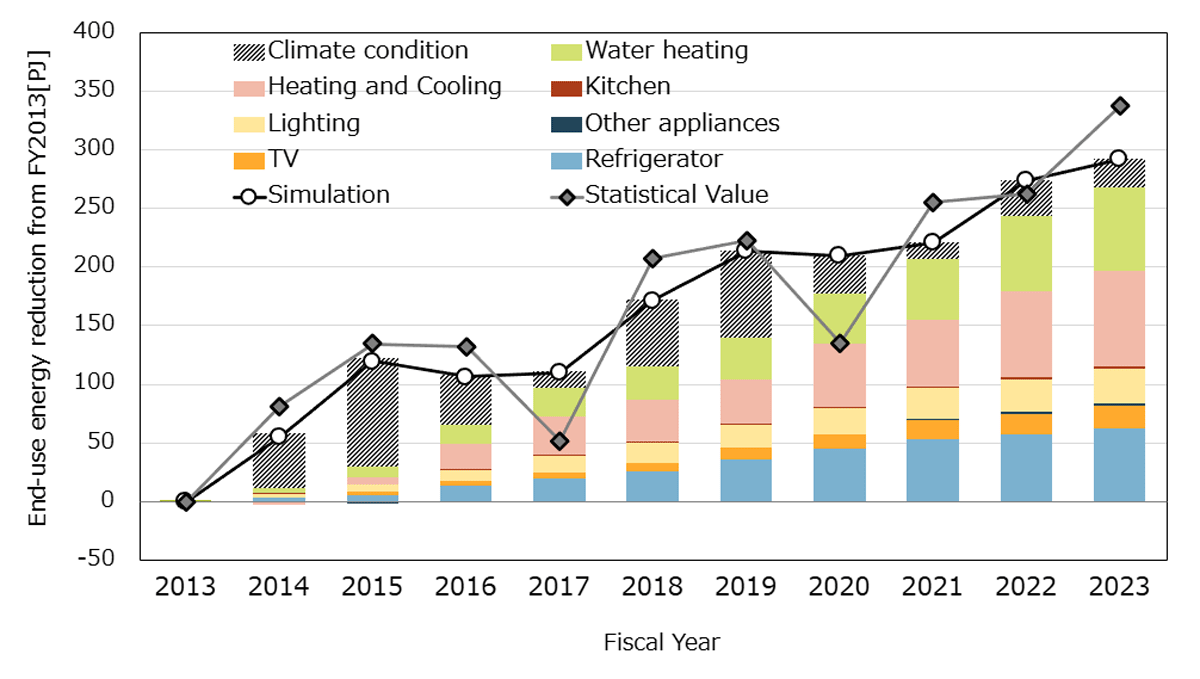
Figure 5
Reduction in End-Use Energy Consumption by Residential Sector by Factor from Fiscal Year 2013.
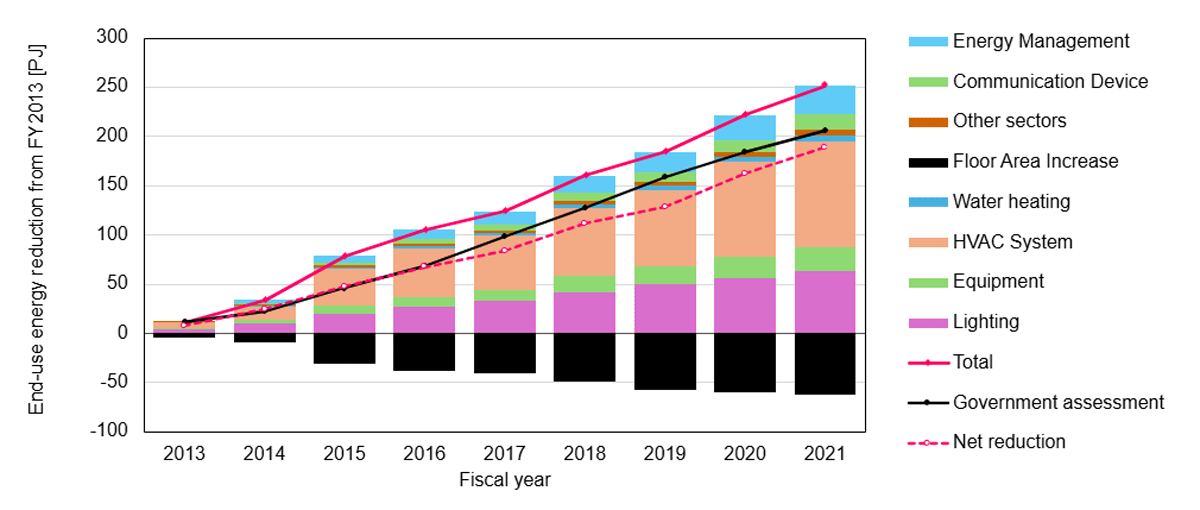
Figure 6
Reduction in End-Use Energy Consumption by Non-residential Sector by Factor from Fiscal Year 2013 to Fiscal Year 2021 (Yamaguchi, et al. 2024).
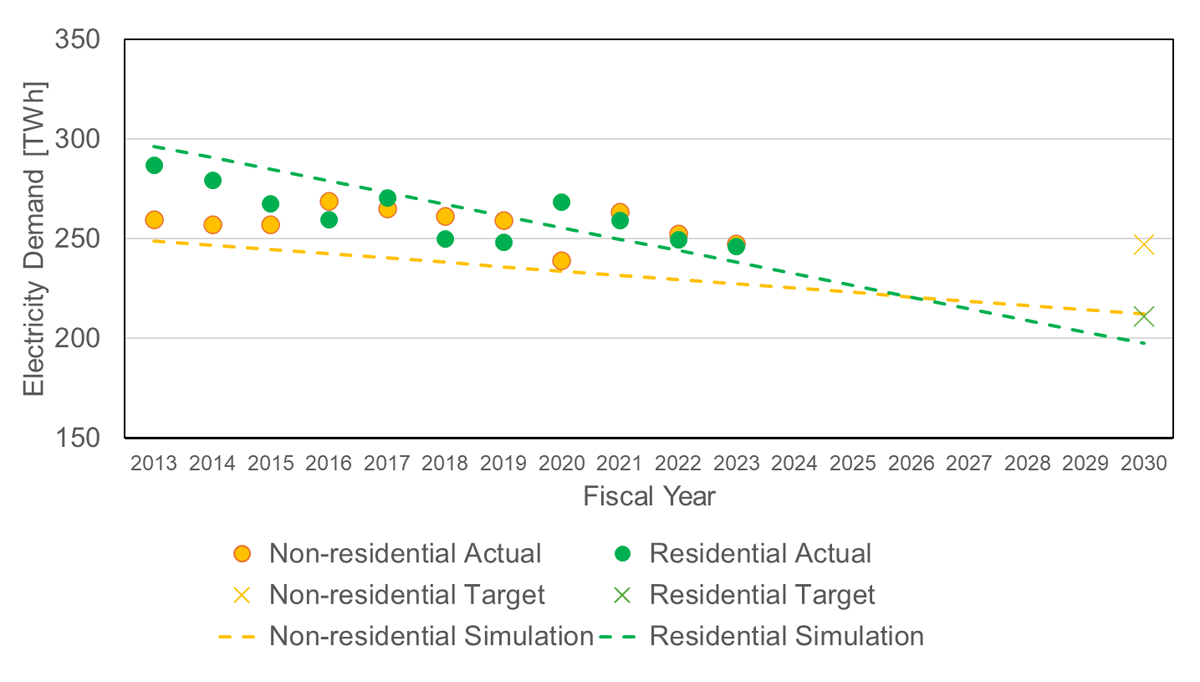
Figure 7
Comparison between observed and estimated electricity consumption.
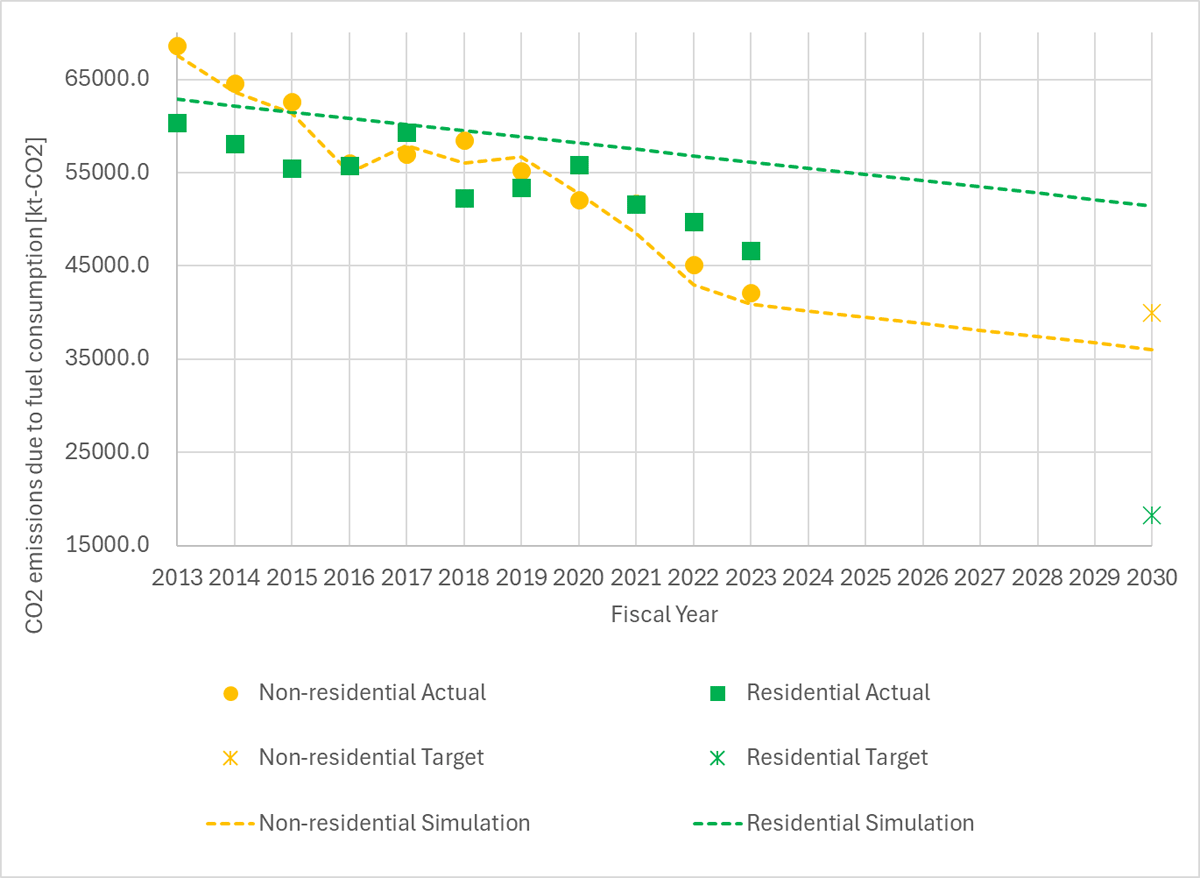
Figure 8
Comparison between observed and estimated CO2 emission due to fuel consumption.