
Introduction
Japan has pledged through its NDC to reduce emissions by 46% from 2013 levels by 2030. To achieve such a significant reduction, the Japanese government established the Japanese Plan for Global Warming Countermeasures (PGWC) which consists of various kinds of mitigation measures (Ministry of Environment, 2021). A distinctive feature of Japan’s PGWC is that it sets reduction targets not only for the nation but also for each sector. For the building sector, it aims for a 66% reduction in the residential sector and 51% reduction in the non-residential sector by FY (Fiscal Year) 2030 compared to FY2013, achieved through energy-saving measures, secondary energy switch, and decarbonization of the electricity supply. Furthermore, the reduction targets assigned to each sector are expressed as the sum of the effects of individual reduction measures. For example, the greenhouse gas reduction effect of energy-efficient refrigerators is calculated by multiplying the estimated reduction per unit by the target number of units to be disseminated. When all reduction effects for the residential sector listed in the PGWC are summed, the result equals the reduction target for the residential sector.
To achieve such significant reductions, accurate progress evaluation system is required. In the building sector, it is crucial to evaluate the progress of energy efficiency measures while considering energy demand heterogeneity and excluding external factors such as weather conditions and pandemics. To fulfil this requirement, the authors proposed developing a digital twin model of building sector energy consumption in the nation for this purpose (Shimoda et al. 2022). This paper discusses the feasibility of achieving the 2030 target for the Japanese building sector by applying this model to the residential sector through FY2023 and the non-residential sector through FY2021.
Current Japanese plan and follow-up procedure
Japanese global warming countermeasures
As the basis for its PGWC, the Japanese Agency for Natural Resources and Energy had published the Long-term Energy Supply and Demand Outlook (LESDO) (Agency for Natural Resources and Energy, 2021). LESDO had established the targets for introducing energy efficiency and decarbonization technologies required to meet the PGWC goals for each sector, as shown in Table 1. The government is implementing various policies to ensure these technologies achieve the dissemination rates indicated in Table 1.
Table 1
Countermeasures listed in Long-term Energy Supply and Demand Outlook, their planned dissemination ratio and energy saving, and progress in Fy2023.
| RESIDENTIAL SECTOR | |||||||
|---|---|---|---|---|---|---|---|
| COUNTERMEASURES | DISSEMINATION RATIO | EXPECTED ENERGY SAVINGS [PJ] (FY2030) | DISSEMINATION PROGRESS IN FY2023* | ||||
| FY2012 | FY2030 | TOTAL | ELECTRICITY | FUEL | |||
| Promotion of energy efficient housing (New construction) | 6% | 30% | 97.9 | 24.5 | 73.4 | 43% | |
| Promotion of energy efficient housing (Renovation) | 35.2 | 9.1 | 26.1 | 67% | |||
| Promotion of high-efficiency water heaters (Thousands of units) | Heat Pump | 4,000 | 15,900 | 102.7 | –10.9 | 113.4 | 49% |
| Condensing boiler | 3,400 | 30,500 | |||||
| Fuel Cell | 55 | 3,000 | |||||
| Promotion of high-efficiency Lighting | 9% | Nearly 100% | 75.0 | 75.0 | 241% | ||
| Improvement in appliance energy efficiency by the Top-runner Standard | – | – | 65.7 | 56.6 | 9.1 | 53% | |
| Comprehensive Energy Management | HEMS etc. | 0.20% | 85% | 83.7 | 74.1 | 9.7 | 29% |
| Energy-saving information provision rate | 0% | 80% | |||||
| Encouraging effort by citizens | – | – | 6.7 | 4.2 | 2.4 | ||
| NON-RESIDENTIAL SECTOR | |||||||
| COUNTERMEASURES | DISSEMINATION RATIO | EXPECTED ENERGY SAVINGS [PJ] | DISSEMINATION PROGRESS IN FY2023* | ||||
| FY2012 | FY2030 | TOTAL | ELECTRICITY | FUEL | |||
| Promotion of energy efficient building (New construction) | 23% | 57% | 156.1 | 76.5 | 79.6 | 33% | |
| Promotion of energy efficient building (Renovation) | 55.5 | 22.8 | 32.7 | 52% | |||
| Promotion of high-efficiency water heaters | Condensing boiler | 7% | 44% | 20.0 | 3.4 | 16.6 | 64% |
| Heat pump water heater | |||||||
| High-efficiency boiler | |||||||
| Promotion of high-efficiency lighting | 9% | Nearly 100% | 75.7 | 75.7 | 235% | ||
| Improvement in equipment energy efficiency by the Top-runner Standard | – | – | 132.6 | 132.6 | 75% | ||
| Comprehensive Energy Management | 6% | 47% | 92.4 | 50.9 | 41.6 | 58% | |
| Encouraging effort by occupants’ | – | – | 0.9 | 0.9 | |||
[i] *Source: Ministry of Environment (2025).
Follow-up procedure of PGWC
The progress of PGWC is reviewed every year by a joint council of the Ministry of Environment and the Ministry of Economy, Trade and Industry (Ministry of Environment 2026a). The review is done in two ways:
Evaluation based on the National Greenhouse Gas Inventory.
Evaluation of the progress of each of the measures shown in the last column of Table 1.
From the evaluation of progress in FY2023 (Ministry of the Environment 2025), the results were as follows.
Japan’s national greenhouse gas emissions and removals for FY2023 were 1,017 million tonnes of carbon dioxide equivalent (Mt CO2 eq.), showing a 27.1% decrease compared to FY2013 (National Institute for Environmental Studies 2025). This represents reductions are on track toward the 2030 targets. However, the progress of renewable electricity and restart of nuclear plants have been behind schedule, and this has been offset primarily by reduced activity in the industrial sector. As shown in Figure 1, progress toward emissions reductions in the residential sector for FY2023 is at 45%, while progress in the non-residential sector is at 58%. Assuming a linear reduction pathway, the figure should have reached 59% in FY2023, meaning the non-residential sector is almost on track, while the residential sector is behind. The residential sector’s delay can be attributed to the fact that over two-thirds of its greenhouse gas emissions come from electricity consumption, which is affected by the aforementioned decarbonization delays in the power sector. In addition, this assessment does not account for the impact of weather conditions.
The progress of dissemination for each measure is indicated in the last column of Table 1. Despite the promotion of high-efficiency lighting has shown significant progress in both sectors, the promotion of energy efficient residential and commercial buildings in new construction has not progressed as much. In the residential sector, the adoption of high-efficiency water heaters and energy management systems is behind schedule. The adoption of high-efficiency water heaters has been delayed because they are being used longer than expected, and it is difficult to switch to a different type when they break down. The adoption of HEMS has been slow because the benefits are not easily understood by the general public.
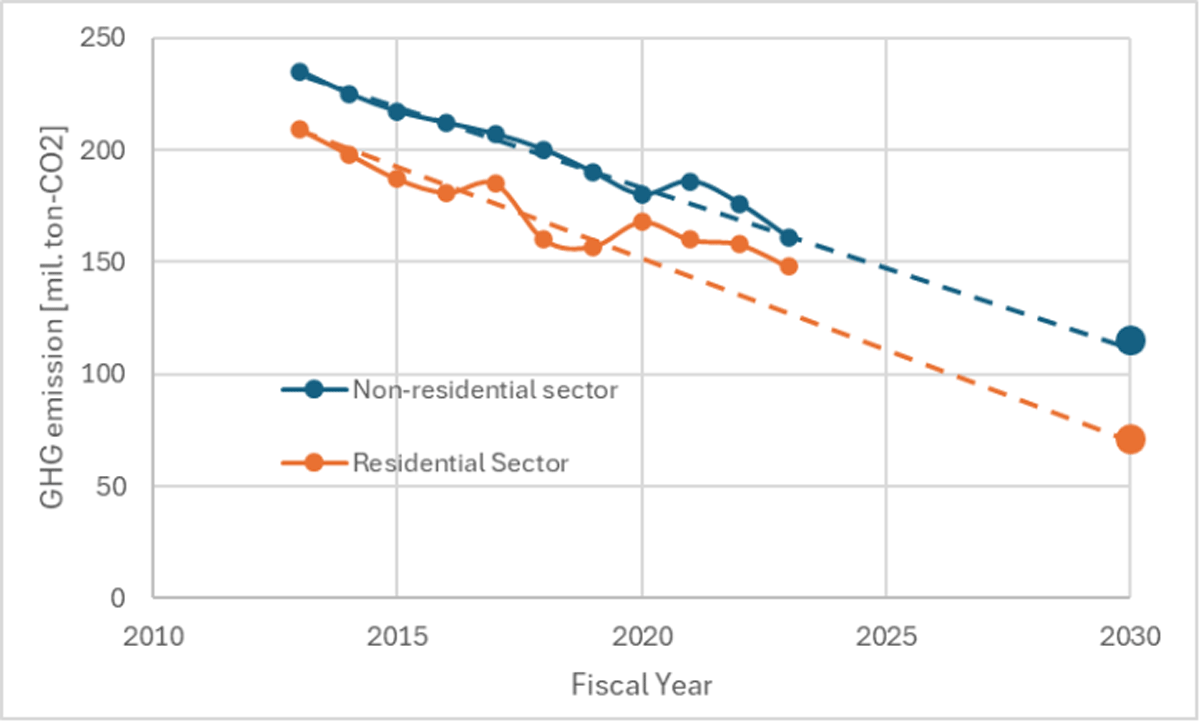
Figure 1
Progress of Japanese GHG emission reduction in the Residential sector and Non-residential Sector (National Institute for Environmental Studies, 2025).
The evaluations based on the two approaches differ slightly. The following reasons are considered to cause this.
Actual CO2 emissions and energy consumption are affected by various factors such as weather conditions and socio-economic activities.
Since the CO2 emission intensity of electricity significantly affects CO2 emissions in these sectors, progress of the dissemination of energy efficiency technologies in the residential and non-residential sector does not consistently correlate with CO2 emissions.
In LESDO, the effect of each measure is estimated as the product of the amount of dissemination and the energy saving effect per unit. However, in reality, the magnitude of energy-saving effects of each measure varies depending on factors caused by heterogeneity, such as the characteristics of households and buildings.
Proposed progress management system
Overview of the digital twin model
To improve the accuracy of the follow-up in the current state described above, the authors proposed a new carbon and energy management system suitable for the modern digital society (Shimoda et al. 2022). An overview of the system is shown in Figure 2. The model consists of the following three tools: 1) a bottom-up, end-use energy simulation model that can replicate the energy demand determination mechanism, 2) individual statistical data that explain the relationships between household/building characteristics and energy consumption, appliance ownership status, and the energy-saving behavior of a building’s occupants in order to account for the heterogeneity of households/buildings, and 3) smart meter data that can be used to analyze the energy efficiency progress of households/buildings. By combining these three tools, it is possible to assess the present situation regarding energy consumption and CO2 emissions in the residential and non-residential sectors, evaluate the progress of the energy efficiency program currently in place, and plan for new energy efficiency measures.
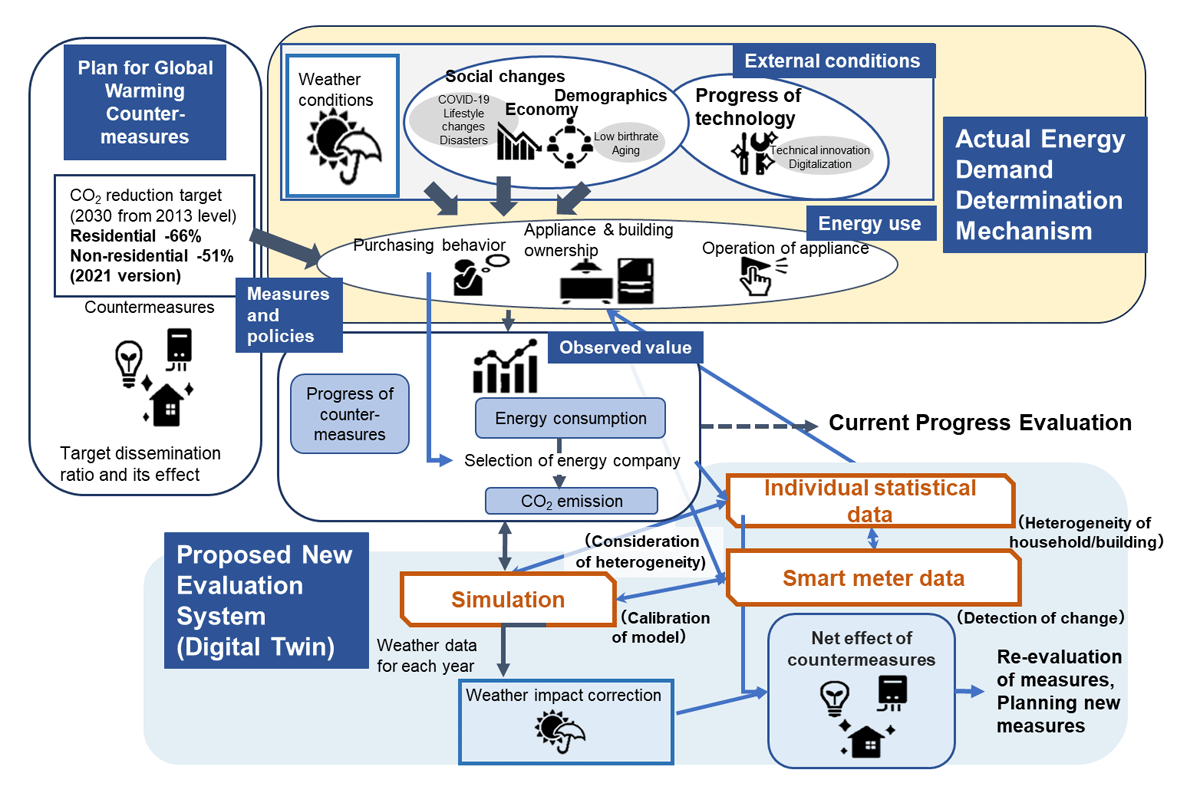
Figure 2
Overview of proposed energy and carbon management system.
Residential sector model
To simulate end-use energy consumption in residential sector, TREES (Total Residential End-use Energy Simulation) model was used. TREES is a bottom-up engineering model based on the time-use schedule of building occupants and a heating/cooling load calculation model. The procedure of the TREES simulation model is shown in Figure 3. TREES has previously been used to evaluate the Japanese PGWC up to 2030 (Taniguchi-Matsuoka et al. 2020) and carbon neutrality in 2050 (Shimoda et al. 2021). In this study, 0.03% of Japan’s 53 million households were randomly selected as representative households. Household attributes were randomly assigned to each representative household according to the census (Statistic Bureau of Japan, 2026). Survey on Carbon Dioxide Emissions from Residential Sector (Household CO2 Statistics), published annually by the Ministry of the Environment (Ministry of Environment, 2026), was used to provide input data such as the appliance ownership status for our bottom-up simulation. Smart meter data was used to calibrate the appliance operation schedule (Uchida et al., 2025).
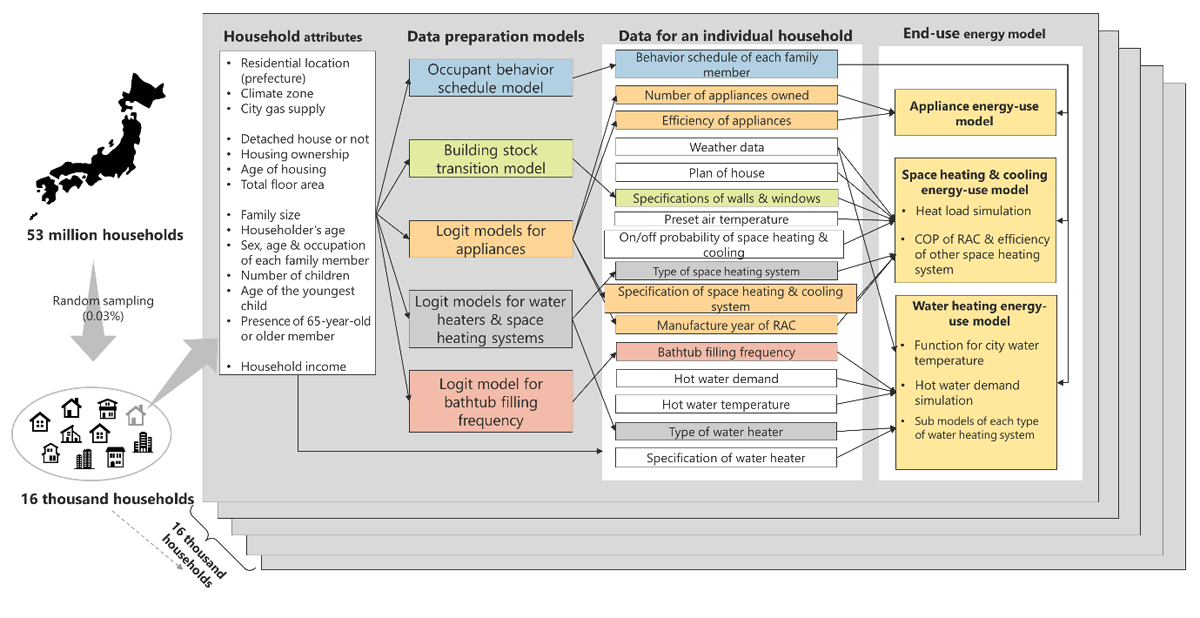
Figure 3
Procedure of the TREES simulation model.
Non-residential sector model
The energy model for the non-residential building stock uses an approach similar to the TREES model, as shown in Figure 4. The model consists of reference building models that represent a building stock segment, classified by climate condition, building business category and size, insulation performance, system configuration for space heating and cooling and water heating, and energy conservation measures. This reference building models were used for EnergyPlus simulation that would allow a quantification of energy use intensity (EUI) per floor area. (EnergyPlus, 2026) Total energy consumption was quantified by summing the products of the EUI and total floor area for all the building stock segments. The model was updated to consider the yearly change in building stock in order to quantify the yearly change in CO2 emissions (Yamaguchi et al., 2024). There are no comprehensive government statistics available for non-residential buildings. However, the Japan Sustainable Building Consortium (2020) publishes its Database for the Energy Consumption of Commercial Buildings (DECC), which provides data on the energy consumption, building use, and building size for 44,000 buildings. This data was used to validate our simulation model.
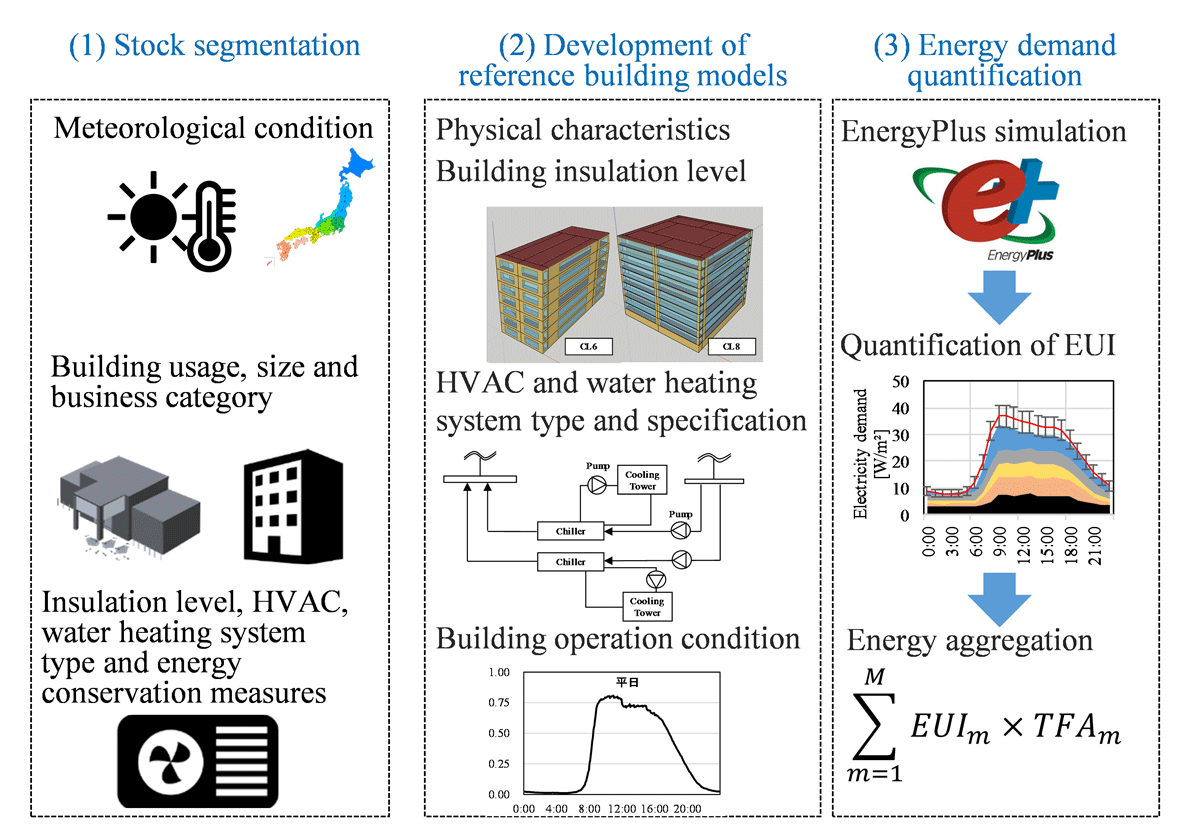
Figure 4
Overview of the model for the Japanese non-residential building stock.
End-use energy demand simulation results
Residential sector
The annual changes in end-use energy demand in the residential sector were compared between simulation results and statistical data (Agency for Natural Resources and Energy 2026), expressed as reductions relative to 2013 energy consumptions. In this simulation, estimation model for the energy efficiency distribution of housing stock (Taniguchi et. al. 2008) is used. Dissemination ratio of LED lighting and high efficiency water heaters are obtained from government survey data (Ministry of Environment 2025). Energy efficiency distributions of TV, refrigerator and room air conditioner are estimated from Household CO2 Statistics (Ministry of Environment 2026b).
Figure 5 shows the reduction in end-use energy consumption for the residential sector from FY 2013 to FY2023, broken down by factor, as obtained by the model. From this result, the following can be observed.
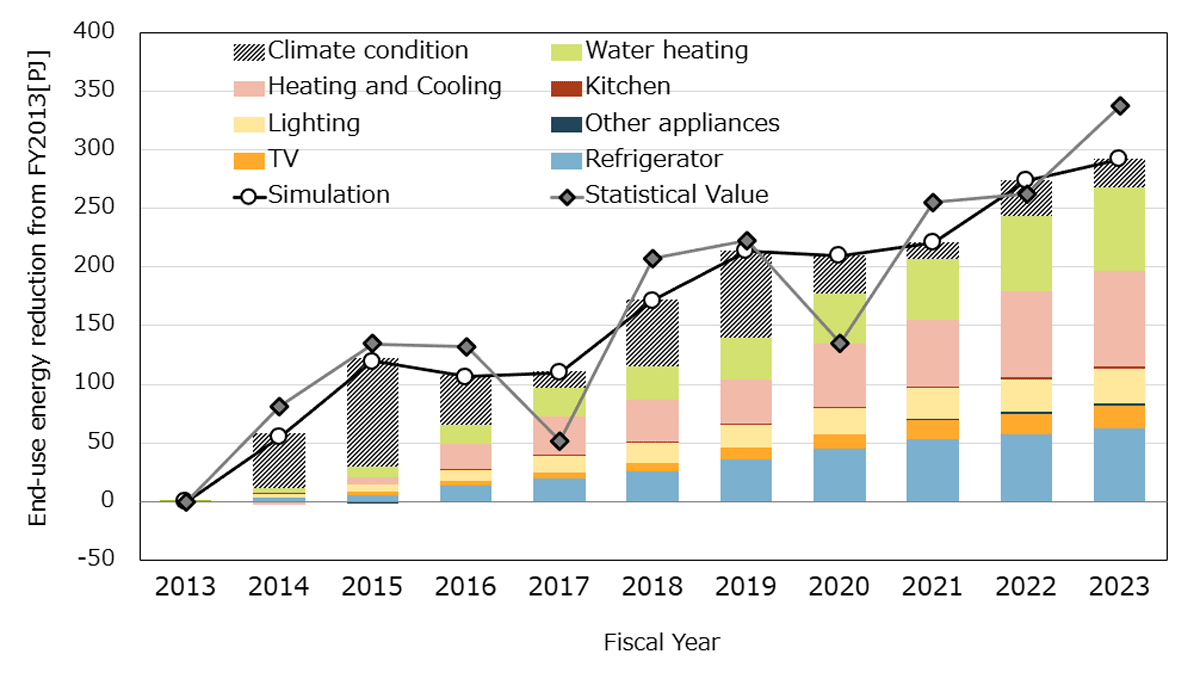
Figure 5
Reduction in End-Use Energy Consumption by Residential Sector by Factor from Fiscal Year 2013.
The simulated energy consumption reductions show good agreement with statistical values for all years except FY2017 and FY2020. The gap in FY2020 is likely due to increased occupant time spent at home during the pandemic, which the simulation did not consider. The cause of the FY2017 gap is unclear, the fact that the gap is significant only in specific region suggests there may be some issue with the statistical values.
The impact of weather differences was significant until FY2019, contributing to the apparent steady reduction in greenhouse gas emissions shown in Figure 1. After FY2020, its proportion has decreased. The effect of weather differences has consistently been positive, indicating that the weather in FY2013 led to a significant increase of residential energy demand.
The primary contributors to reduced energy consumption are heating and cooling—namely, improvements in building energy efficiency and room air conditioner efficiency—along with water heating and refrigerators. The full mandatory implementation of energy efficiency standards for residential buildings begins in 2025; since water heaters tend to be used for longer than anticipated, compliance with energy efficiency standards for newly built homes and the adoption of high-efficiency water heaters are behind schedule. However, since their energy reduction potentials are significant, strengthening these measures are very important. Refrigerators have seen rapid efficiency improvements since around FY2000 due to the introduction of top-runner standards, with their effects lasting even 20 years later.
Excluding the effects of different weather conditions from the results of the simulation, end-use energy reduction is 15% smaller than the planned value in 2023.
Non-residential sector
This sector is classified as “Commercial and Other” in Japan’s energy statistics, which also includes energy consumed by water supply and waste management industries, as well as statistical errors. The authors exclude these non-building sectors—specifically ‘Electricity, Gas, Heat Supply and Water’; ‘Transport and Postal Activities’; ‘Miscellaneous Services’; and ‘Unable to classify (statistical errors)’—and analyse the remainder as non-residential building energy consumption. One-quarter of the GHG emission reduction in the non-residential sector shown in Figure 1 is attributed to reductions in the ‘Unable to Classify’.
In the non-residential sector model, specifications for lighting, HVAC equipment, and other systems are established based on building use and age, and data on building demolition and new construction are used to determine the overall distribution of thermal insulation levels and the composition of equipment types and efficiency across the entire building stock. Details are presented in Yamaguchi et. al. (2024).
Figure 6 shows the simulation results until FY2021 and the result of government’s assessment, namely the product of observed dissemination amount and energy use reduction per unit (Ministry of Environment 2025). This simulation result excludes the effects of annual weather variations and energy use of non-building sectors. In the non-residential sector, the impact of weather variations is not as significant as it is in the residential sector. (Yamaguchi, et al. 2024) Due to difficulties in obtaining data, simulations beyond 2022 could not be conducted.
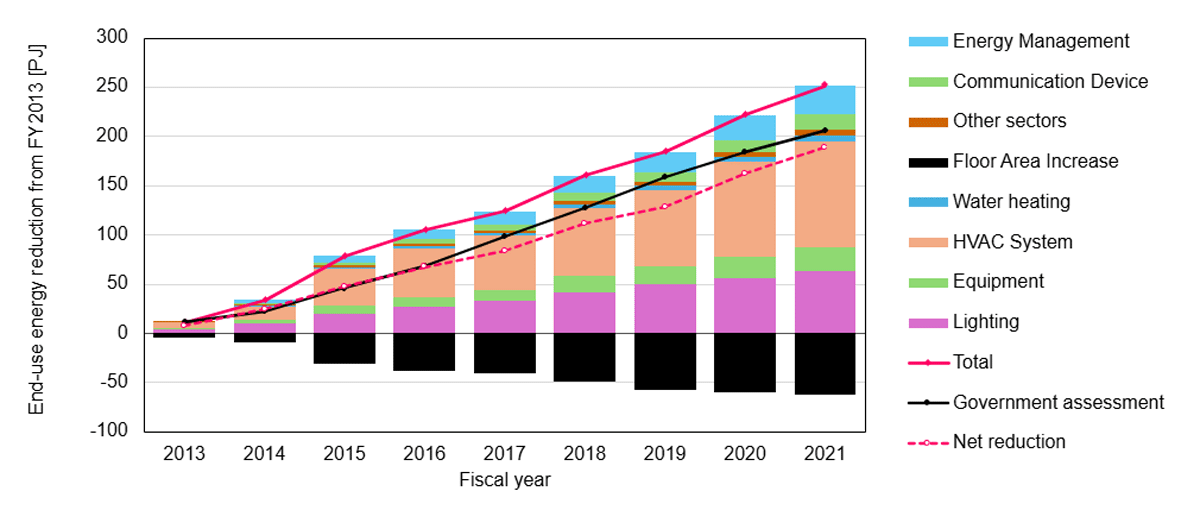
Figure 6
Reduction in End-Use Energy Consumption by Non-residential Sector by Factor from Fiscal Year 2013 to Fiscal Year 2021 (Yamaguchi, et al. 2024).
The simulated energy consumption reduction is 20% higher than governmental evaluation. However, 25% of the energy savings are offset by the increase in floor area, which is not considered in the governmental evaluation.
The most significant effects come from energy efficiency improvements in the building’s HVAC system and lighting, highlighting the importance of measures taken during both new construction and renovation.
Prediction of GHG emission reduction in 2030
Prediction of electricity consumption and CO2 emission associated with fuel consumption
Using the simulation results described in the previous section, greenhouse gas emissions for both sectors in FY2030 were predicted. The reduction in annual energy consumption calculated by simulation is nearly linear in both sectors; accordingly, this trend was linearized and extrapolated through fiscal year 2030.
First, energy consumption is divided into electricity consumption and fuel consumption, and the annual changes in each energy use are subjected to regression analysis. This implies that not only future energy savings but also fuel switching will maintain the trend observed previously. This serves as a business-as-usual measure in promoting electrification policies.
Next, the actual greenhouse gas emissions from both sectors in FY2013 are decomposed into those attributable to electricity consumption and those attributable to fuel consumption. The above trends are then applied to each component to forecast greenhouse gas emissions for FY2030.
It should be noted that the 2030 projections presented here are based on the simulation results from the previous sections, which calculate energy consumption based on 2013 weather conditions.
Figure 7 shows the comparison between the estimated electricity consumption obtained from the simulation up to FY2030 and the actual electricity consumption. In the residential sector, actual electricity consumption since FY 2020 has been higher than the estimated values due to the impact of the pandemic in 2020 and the increasingly hot summers from FY2023. In the non-residential sector, electricity consumption other than building is excluded, the discrepancy with the observed values is slightly larger due to discrepancies in the allocation of electricity and fuel, as well as differences in weather conditions. For both sectors, the projected electricity consumption in 2030, excluding weather effects, will be lower than the LESDO target value.
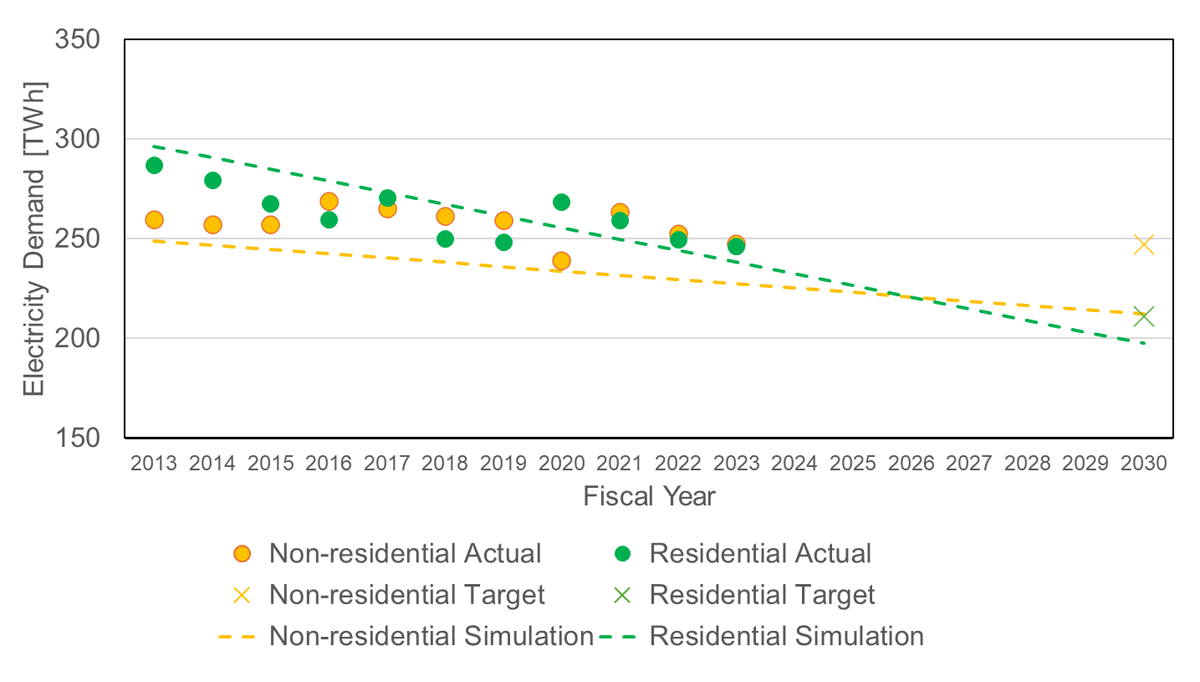
Figure 7
Comparison between observed and estimated electricity consumption.
Figure 8 shows the comparison between the estimated CO2 emissions due to fuel consumption obtained from the simulation up to FY 2030 and observed emissions due to fuel consumption. For non-residential sector, emissions of ‘Other sectors and statistical error’ described above are added to simulation result.
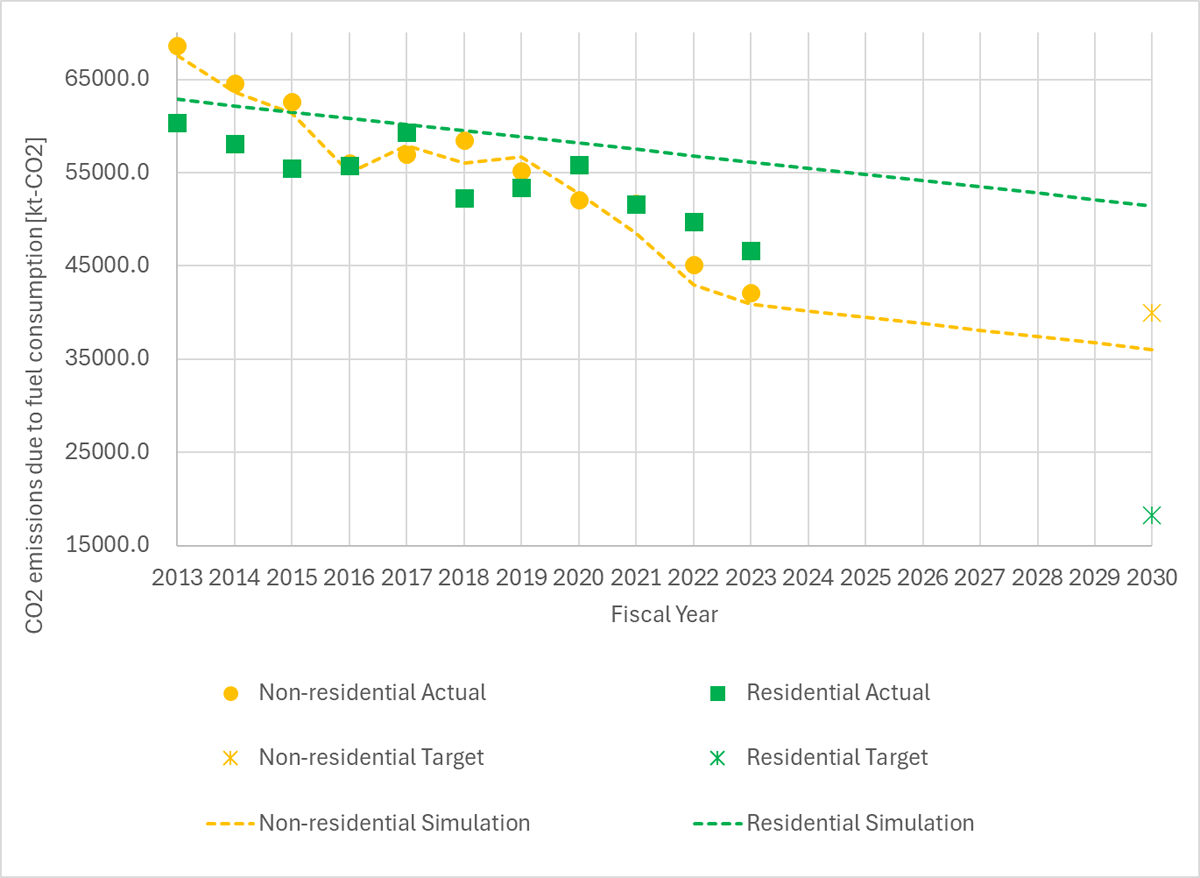
Figure 8
Comparison between observed and estimated CO2 emission due to fuel consumption.
In the residential sector, the simulated emission trend is always larger than the observed one due to warmer winters. Estimated emission in FY2030 is 2.8 times larger than the target. However, by FY2030, winters are expected to become warmer, and fuel consumption and associated CO2 emissions are likely to be lower than predicted. Since our model can account for changes in temperature, energy consumption that considers the effects of global warming can be predicted if an appropriate temperature rise trend is specified.
In the non-residential sector, the significant reduction until FY2023 is primarily due to the reduction of ‘statistical error’. The reduction rate thereafter is expected to slow considerably, as it will be driven solely by the actual reduction in buildings.
Prediction of CO2 emissions from the building sector
From the results obtained in the last section, CO2 emissions from the building sector in FY2030 is estimated. LESDO has set the CO2 emission intensity for electricity consumption in FY2030 at 0.25 kg-CO2/kWh. However, decarbonization in the power sector is currently delayed, with the latest figure for FY2023 standing at 0.458 kg-CO2/kWh. Therefore, we have projected CO2 emissions for the non-residential and residential sectors in FY2030 based on several electricity CO2 emission intensities. The values for the “Other” category in the non-residential sector are assumed to remain unchanged from the 2023 values. The results are shown in Table 2.
Table 2
Projected CO2 emissions in 2030 [kt-CO2].
| SECTORS | CO2 EMISSION INTENSITY OF ELECTRICITY [KG-CO2/KWH] | TARGET VALUE IN PGWC [KT-CO2] | ||
|---|---|---|---|---|
| 0.25 | 0.35 | 0.45 | ||
| Non residential | 102,307 | 128,814 | 155,322 | 115,000 |
| Residential | 100,813 | 120,557 | 140,301 | 71,000 |
Thus, while the non-residential sector is expected to achieve the government’s targets, the residential sector will fail to meet its goals if the CO2 emission intensity is 0.25 kg-CO2/kWh. Since both sectors meet their targets for electricity consumption, this indicates that electrification in residential sector has not progressed as planned. In reality, achieving the PGWC target is increasingly difficult for both sectors due to delays in renewable energy dissemination and the restart of nuclear power plants, which will result in higher CO2 emission intensity as shown in the Table 2.
Conclusion
In this paper, a new evaluation system for the national greenhouse gas emission reduction plan for building sector is proposed. By applying this system, the feasibility of achieving the FY2030 target for Japanese building sector is examined. The results are as follows:
Excluding the effects of different weather conditions from the results of the simulation, end-use energy reduction is 15% smaller than the planned value in 2023. Currently, most of the delay stems from the delayed decarbonization of the power sector. According to our assessment system, even if the electricity sector achieves its CO2 emission intensity target by 2030, delays in electrification will prevent the residential sector from achieving its target.
While CO2 emissions reductions in the non-residential sector appear to be progressing smoothly, this is largely due to significant reductions in non-building sectors, and such reductions cannot be expected in the future. The increase in floor area had offset one-quarter of energy efficiency effects.
Delays in decarbonizing the power system pose a major obstacle to achieving the plans in both sectors.
This assessment excludes the impact of weather, but it should be noted that future increases in winter temperatures will reduce energy consumption especially in the residential sector, while increases in summer temperatures will increase electricity consumption in both sectors.
The evaluation system proposed by the author not only quantitatively indicates the effectiveness of each countermeasure but also allows for the separation of external factors such as weather variations and changes in total floor area. Our model is also capable of quantitatively evaluating these effects and effects of introducing new energy efficiency countermeasures. Therefore, it is suggested it can be utilized for both factor analysis of the current situation and near future scenario analysis.
As no significant variation was observed in the annual data, the linear approximation line obtained from simulations covering the residential sector from FY2013 to FY2023 and the non-residential sector from FY2013 to FY2021 was used for the FY2030 prediction in this paper. However, to forecast the future considering short-term changes brought about by policy adjustments, it is necessary to develop methodology to detect the slight variations observed over the past few years and reflect them in future projections.
eceee paper ID
4-172-26