
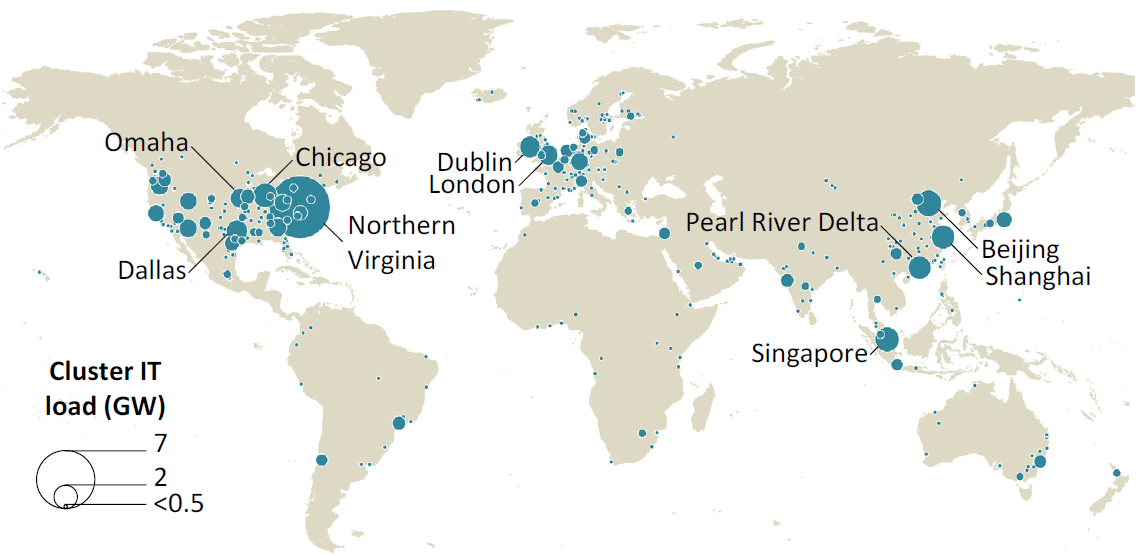
Figure 1
Global map of large data center clusters, 2024.
Source: IEA (2025). Reproduced under the Creative Commons Attribution 4.0 (CC BY 4.0) license.
Table 1
Overview of existing bottom-up methodologies for data center-related measures (based on Moura et al. 2025).
| COUNTRY | SCOPE | TYPE OF MEASURE | APPROACH | KEY CHARACTERISTICS |
|---|---|---|---|---|
| Czech Republic | IT equipment | Legislative methodology | Engineering-based | Based on national regulation and standardized parameters |
| Czech Republic | Cooling | Legislative methodology | Engineering-based | Integrated assessment of data center cooling performance |
| France | Cooling | Containment systems | Deemed/engineering | Focus on hot/cold aisle containment |
| France | Cooling | Free cooling systems | Engineering-based | Replacement of chillers with free cooling |
| Luxembourg | Cooling | Efficiency improvement | Engineering-based | General improvement of data center infrastructure |
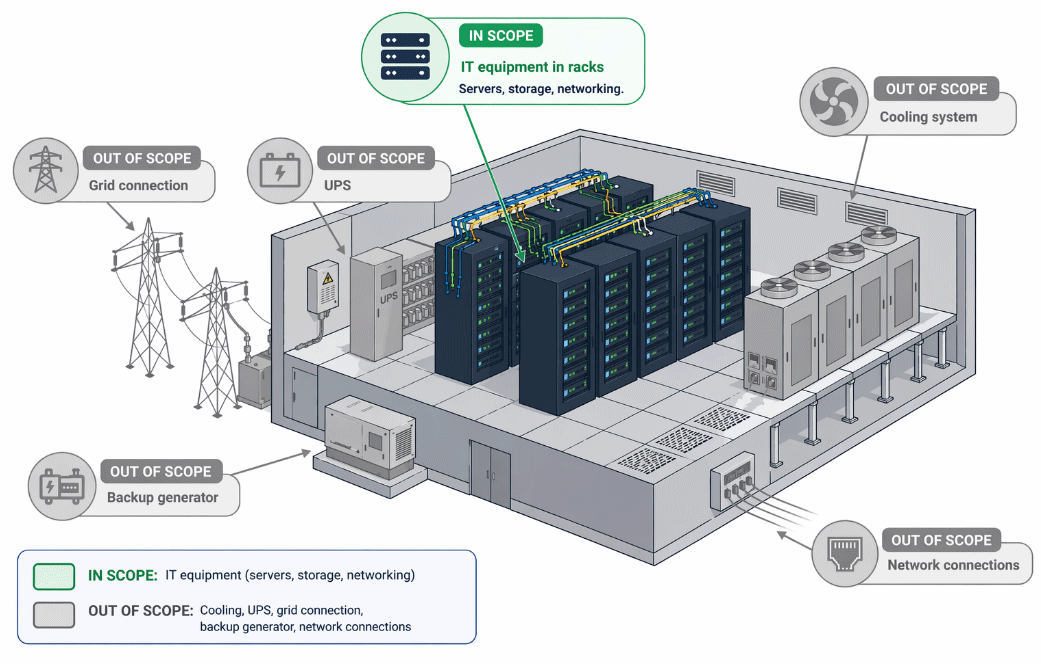
Figure 2
System boundaries for the IT equipment methodology. IT equipment is in scope, while cooling and supporting infrastructure are excluded.
Table 2
Energy consumption before the implementation of the action and PUE for different categories of data centers.
| CATEGORY | IT POWER | ECbefore [MWh/a] | PUE |
|---|---|---|---|
| Very Small | 100–500 kW | 650–4,000 | 1.5–1.8 |
| Small | 500–1,000 kW | 3,250–8,000 | 1.4–1.7 |
| Medium | 1–2 MW | 6,500–17,000 | 1.3–1.6 |
| Large | 2–10 MW | 14,000–85,000 | 1.3–1.5 |
| Very Large | >10 MW | >85,000 | 1.1–1.4 |
Table 3
Proportion of IT electricity consumption attributed to each load component.
| LOAD | % |
|---|---|
| Servers | 60–70% |
| Storage Devices | 10–15% |
| Networking | 10–15% |
| Other IT Loads | 5–10% |
Table 4
Energy savings by type of efficiency measure and lifetime of savings.
| LOAD | MEASURE | % | LIFETIME |
|---|---|---|---|
| Servers | Server virtualization and consolidation | 20–40% | 6 years |
| Servers | Decommissioning obsolete servers | 5–15% | 3 years |
| Servers | Deployment of energy-efficient server hardware | 10–25% | 5 years |
| Servers | Intelligent workload scheduling | 10–30% | 4 years |
| Servers | Activation of power management features | 5–20% | 4 years |
| Servers | Efficient virtualization/container platforms | 10–20% | 5 years |
| Servers | Monitoring and analytics for server energy use | 0–5% | 2 years |
| Storage | Data management optimization | 5–15% | 4 years |
| Storage | Storage tiering and energy-aware systems | 10–20% | 5 years |
| Storage | Modernization of storage hardware | 10–20% | 5 years |
| Network | Efficient network design and topology optimization | 5–15% | 4 years |
| Network | Energy-efficient network equipment | 5–15% | 5 years |
| Network | Intelligent port and link management | 5–10% | 4 years |
| Network | Monitoring network device consumption | 0–5% | 2 years |
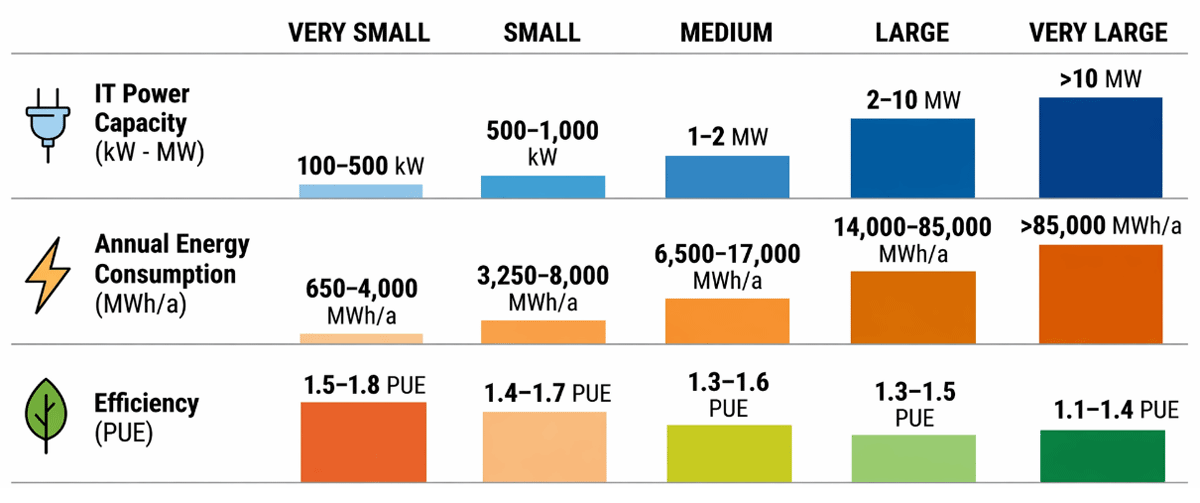
Figure 3
Data center scaling – power capacity and efficiency.
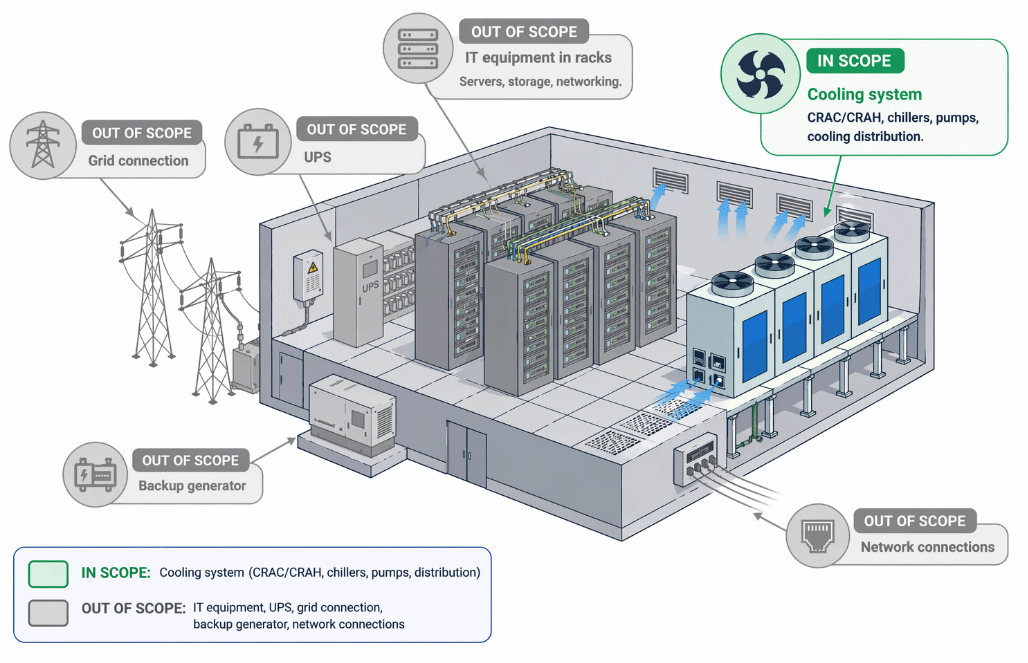
Figure 4
System boundaries for the cooling methodology. Cooling systems are in scope, while IT equipment and other infrastructure are excluded.
Table 5
Reference values for PUE for different cooling technologies of data centers.
| TECHNOLOGY | PUEbefore | PUEafter | LIFETIME |
|---|---|---|---|
| Upgrade CRAC/CRAH units to variable-speed systems | >1.8 | 1.5–1.6 | 15 years |
| Transition to chilled water system with air-side economizers | >1.6 | 1.3–1.5 | 15 years |
| Implement free cooling (air-side, water-side, TES etc.) | 1.6–1.8 | 1.2–1.4 | 15 years |
| Deploy liquid cooling (direct-to-chip or immersion) | 1.6–1.8 | 1.02–1.1 | 15 years |
| Optimize two-phase/passive cooling (e.g., thermosiphon loops) | 1.5–1.7 | 1.1–1.3 | 15 years |
| Integrate thermal energy storage (TES) for peak shaving and free cooling | 1.6–1.8 | 1.2–1.4 | 15 years |
Table 6
Energy consumption of non-IT loads, including cooling, uninterruptible power supply (UPS), and lighting, before the implementation of the action for different categories of data centers.
| CATEGORY | IT POWER | non-IT LOADS [MWh/a] | COOLING [MWh/a] |
|---|---|---|---|
| Very Small | 100–500 kW | 360–2,700 | 293–2,000 |
| Small | 500–1,000 kW | 1,900–5,700 | 1,300–3,600 |
| Medium | 1–2 MW | 4,000–13,000 | 2,275–6,800 |
| Large | 2–10 MW | 9,300–65,000 | 4,200–29,750 |
| Very Large | >10 MW | >65,000 | >21,250–>25,500 |
Table 7
Estimated share of cooling in non-IT load for different categories of data centers.
| CATEGORY | IT POWER | Scooling [%] |
|---|---|---|
| Very Small | 100–500 kW | 75%–80% |
| Small | 500–1,000 kW | 65%–70% |
| Medium | 1–2 MW | 50%–55% |
| Large | 2–10 MW | 44%–48% |
| Very Large | >10 MW | 32%–40% |
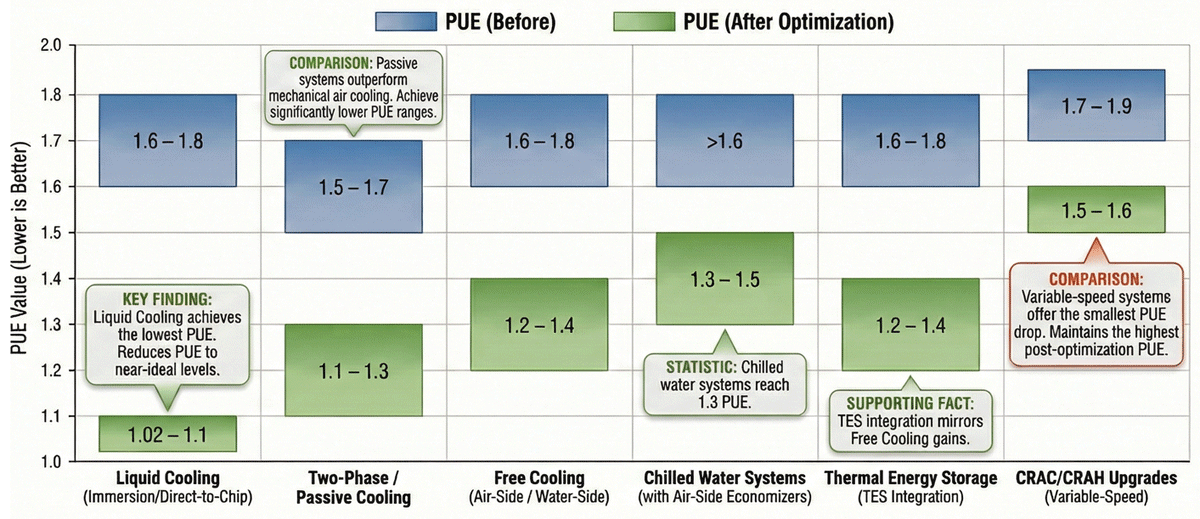
Figure 5
Comparison of baseline and optimized PUE values across data center cooling technologies.