
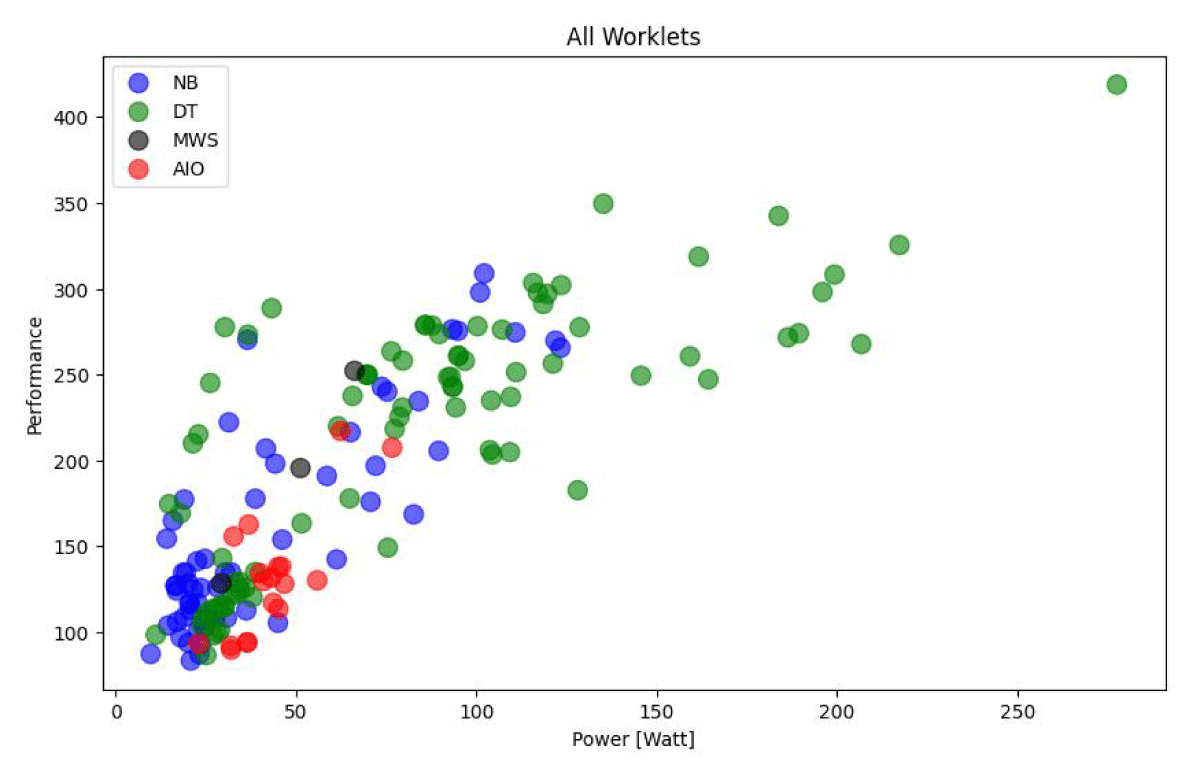
Figure 1
Scatter plot of test results for performance over watts.
Table 1
Test suite software worklets and description: Gen14 for the general computing and the 7 and 8 worklet alternatives for the high performance computing.
| # | WORKLET NAME | GEN14 TEST | PERF7 TEST | PERF8 TEST |
|---|---|---|---|---|
| 1 | LibreOffice Writer | X | ||
| 2 | LibreOffice Impress | X | ||
| 3 | LibreOffice Calc | X | ||
| 4 | SQLite 1 thread | X | ||
| 5 | Encode MP3 | X | X | |
| 6 | Selenium Kraken Chrome | X | ||
| 7 | PyBench | X | ||
| 8 | TJBench | X | ||
| 9 | LibreOffice Convert | X | ||
| 10 | FreeCAD | X | ||
| 11 | Decompress ZSTD | X | X | |
| 12 | Compress ZSTD | X | X | |
| 13 | 7zip (integrated Benchmark) | X | X | |
| 13 | 7zip | X | X | |
| 14 | Stockfish | X | X | X |
| 15 | Blender | X | X | |
| 16 | 3DMark Wild Life Extreme | X | ||
| 17 | Unity Spaceship | X | ||
| 18 | Handbrake | X | X | |
| 19 | Gravitymark | X | ||
| 20 | 3DMark Steel Nomad | X | ||
| 21 | 3DMark Solar Bay | X | ||
| 22 | Procyon AI Computer Vision | X |
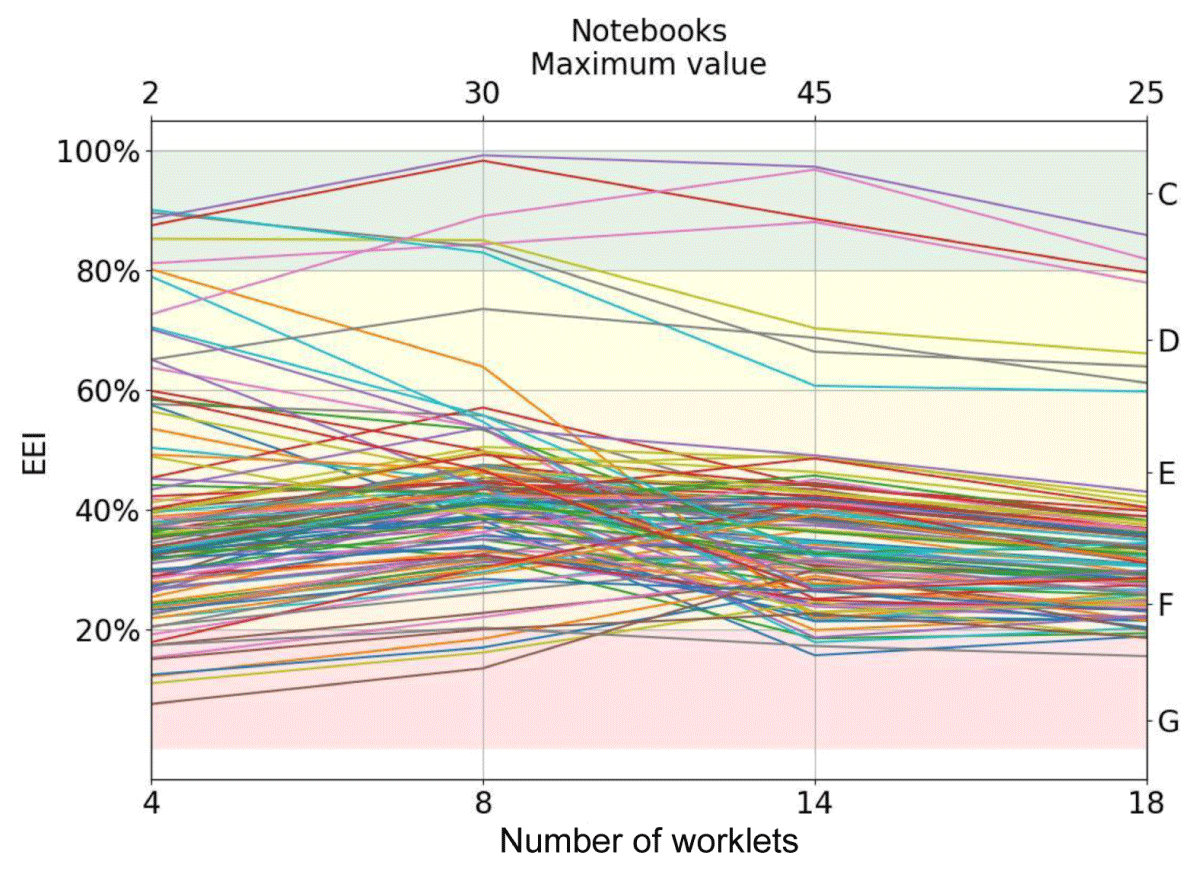
Figure 2
Distribution of energy efficiency indicators (EEI) for notebooks for the discussed sets of 4 and 8 worklets for the high performance computing user profile and the 14 and 18 worklets sets for general computing. Generated by Python.
Table 2
EEI limits for each energy efficiency category (A to G) for each approach (4 to 18 worklets).
| GENERAL COMPUTING | HIGH PERFORMANCE COMPUTING | ||||
|---|---|---|---|---|---|
| CLASS | EEI RANGE NOTEBOOK & DESKTOP | % MODELS | CLASS | EEI RANGE NOTEBOOK & DESKTOP | % MODELS |
| A (highest class) | 38.40 ≤ EEI | 0.0% | A | 27.90 ≤ EEI | 0.0% |
| B | 26.50 ≤ EEI < 38.40 | 0.5% | B | 21.10 ≤ EEI < 27.90 | 0.7% |
| C | 18.30 ≤ EEI < 26.50 | 5.8% | C | 16.00 ≤ EEI < 21.10 | 9.1% |
| D | 12.60 ≤ EEI < 18.30 | 6.8% | D | 12.10 ≤ EEI < 16.00 | 13.3% |
| E | 8.70 ≤ EEI < 12.60 | 24.6% | E | 9.20 ≤ EEI < 12.10 | 31.5% |
| F | 6.00 ≤ EEI < 8.70 | 18.3% | F | 7.00 ≤ EEI < 9.20 | 29.4% |
| G (lowest class) | EEI < 6.00 | 44.0% | G | EEI < 7.00 | 16.1% |
Table 3
Illustrative example on options on different system configurations.
| COMPONENT PART | NUMBER OF OPTIONS |
|---|---|
| Central processing unit (CPU) | 5–12 |
| Graphics processing unit (GPU) | 7–15 |
| Memory (different brands, speeds, quantity) | 40–60 |
| Storage (SSD – brands, speed, quantity) | 40–60 |
| Power supply | 30–60 |
| Total combinations | 1 680 000–38 880 000 |
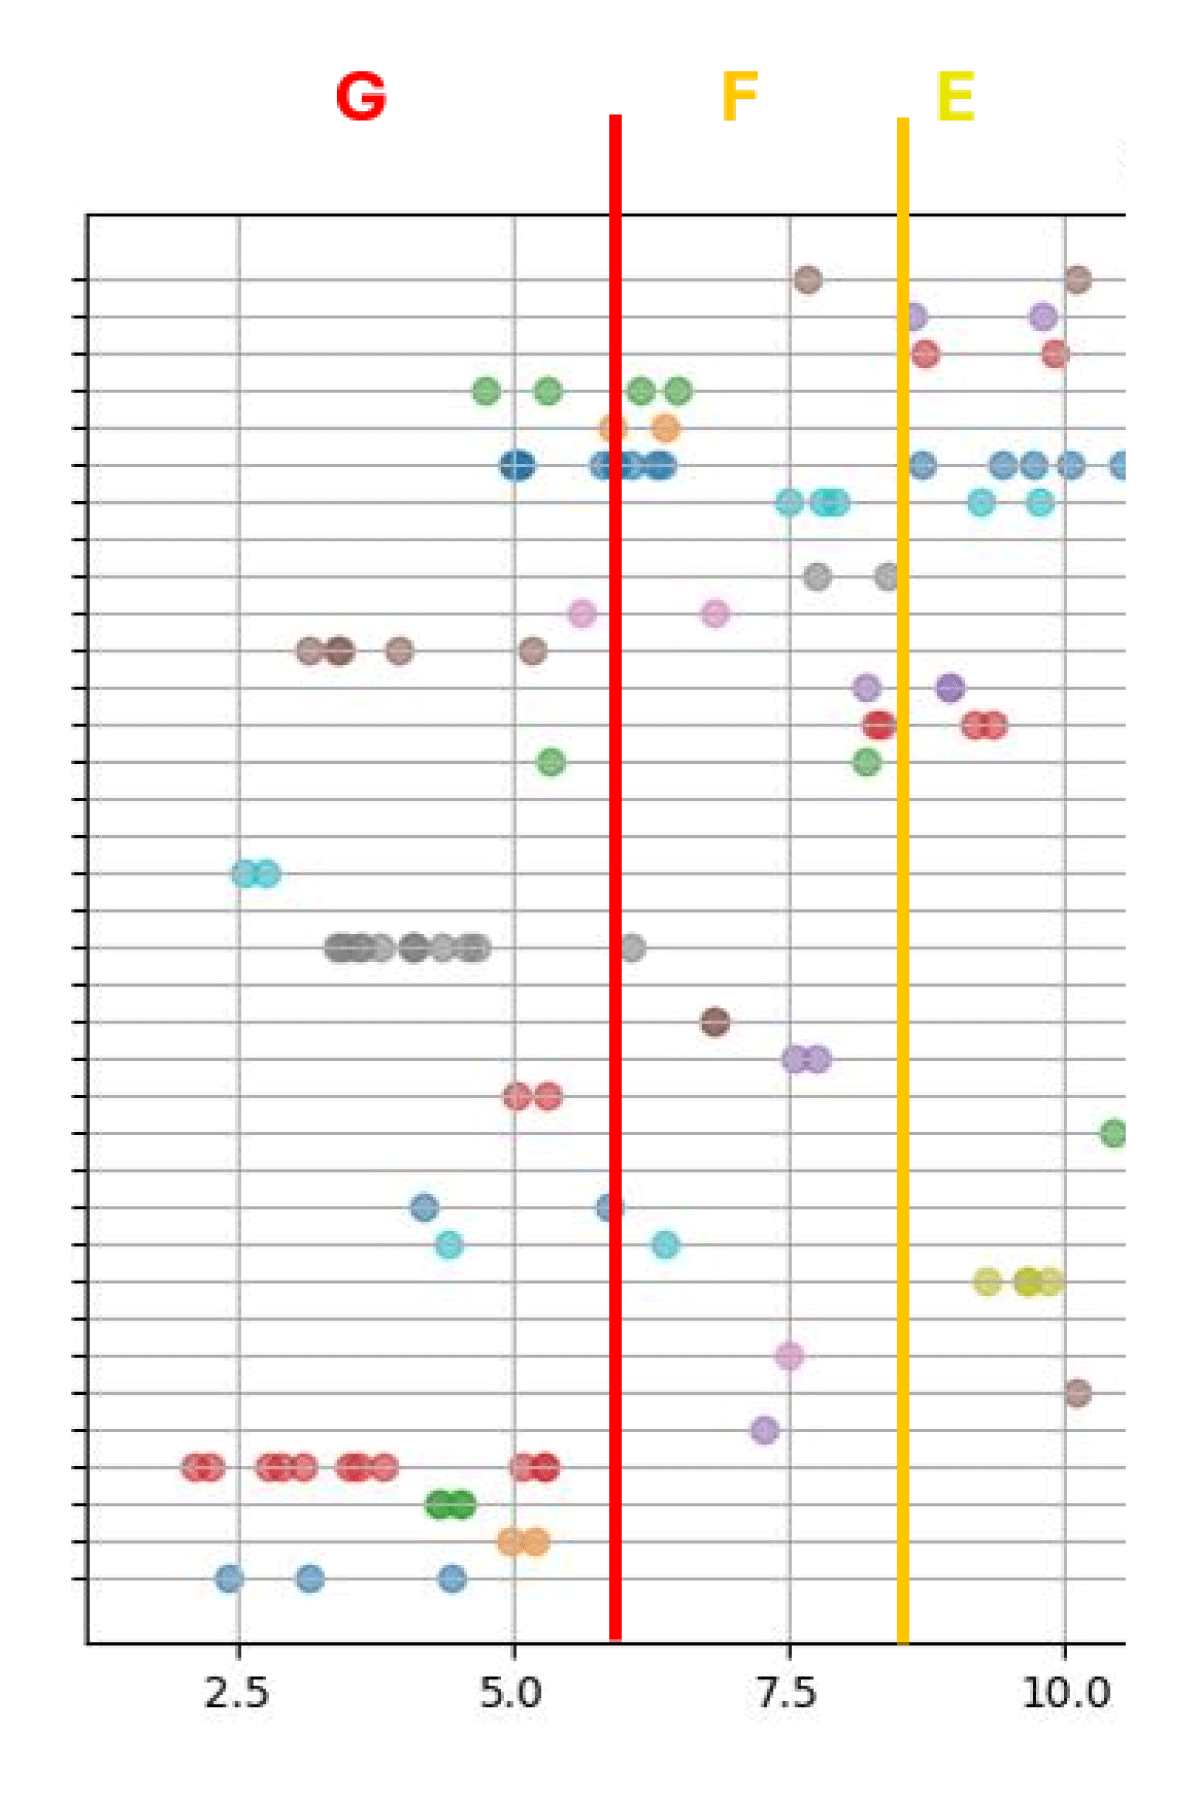
Figure 3
Distribution of meta energy efficiency for tested product families.