
Introduction
The European energy label1 is designed to inform consumers about the energy efficiency they can expect from several products and appliances. Over time, the label has undergone updates and developments in order to better portray advances in technology and to provide more comprehensive information. For these labels, striking a balance between scientific accuracy and usefulness is important. Significant development work goes into finding ways to keep information sound but also easily understandable and applicable. Compared to other labelled products, computers show a significantly more complex architecture, which poses challenges to the aforementioned need for clarity and accuracy.
This papers shows part of this work that went into the upcoming label for computers, as part of the revision of the ecodesign regulation for this product group. Although, as mentioned above, the label will include information beyond the energy efficiency, this paper focuses on the development of how the information on this particular metric would be conveyed. Three aspects are of relevance here: proper differentiation between form-factors (or sub-product categories), setting up appropriate user profiles (reflective of actual user behaviour) and the definition of the product groups. As it will be explained in what follows, balancing these aspects presents considerable challenges. The paper will close with the discussion of possible approaches to overcome them and give shape to the new computer labels.
Development of energy efficiency classes
The process of developing new regulations requires extensive preliminary work (e.g. technical studies, impact assessments), which involve many stakeholders; see for reference the European Commission’s Better Regulation framework (European Commission, 2025). In order to lay some groundwork for the discussion, some key elements of the preliminary work done for the updated computer label are explained in this section. This work has been performed by Bio Innovation Service and Fraunhofer IZM, in close collaboration with GTD who were in charge of the technical aspects of the worklet development.
For the purpose of measuring energy efficiency during active use of computers; a consortium composed by CLASP, GTD and Intertek developed a dedicated software tool (Arregui et al., 2021). This tool measures, on the one hand, the energy use during certain tasks and on the other, the performance of said tasks (on the basis of a reference unit per task). Based on these, the energy efficiency is calculated. In the development process, computer manufacturers as well as representatives of the European Commission have been actively involved.
Worklets
As mentioned above, one of the building blocks of the energy efficiency measurement method developed by GTD are the so-called worklets. Worklets represent specific tasks that can be performed by a computer, with a quantifiable performance and using a given amount of energy e.g. text processing, calculations, file compression/decompression etc. As said, the worklets measure both the tasks performance and the energy usage during it. The result computes the amount of work accomplished with the amount of energy used i.e. the energy efficiency of a task. In total, GTD developed 40 worklets representing different computer tasks. Out of the total, 18 were selected for the calculation of the overall energy efficiency to be displayed in the label. The following formula expresses how this worklet efficiency is reached:
In this case, Work is the quantifiable performance of a given task in the worklet. The units vary per worklet e.g. MB, frames or operations. These are all measured over a certain time period. Furthermore, for some worklets a higher value is better, whereas in others a lowest value indicates a better performance. In order to normalize the values before aggregation, the low is better results are inverted (1/n). The energy drawn during that period is also factored in. Following this, the efficiency per worklet is calculated individually. After this, the nergy efficiency (an aggregate metric considering several worklets) is calculated as the geometric mean. The formula below expresses this step, where n refers to the total worklets considered:
A more detailed explanation of the mathematical background of the methodology can be found in (Arregui et al., 2021), (GTD GmbH, 2024) and (GTD GmbH, 2021).
Transformation into energy classes
The design of the label groups devices together into energy efficiency classes to make the information as quickly and easily understandable as possible. Furthermore, the EU energy labelling regulation sets certain rules for said energy efficiency classes, namely:
Class A shall remain vacant and B vacant or almost vacant at the start of implementation of the label (so as to allow for accommodating improvement over time).
Differentiation of devices shall be clearly possible via measurements.
The tolerances of measurements shall be significantly smaller than the range set for the energy efficiency classes.
As part of the preliminary work to defined the efficiency measurement methodology; Digital Europe, the industry’s representative organisation, has tested an extensive set of actual computers of different brands using the worklets in scope and has provided the results to the working group. In total, 250 complete test runs were made available for analysis. Overall, the results showed a big amount of similarly performing units with only a few exceptions (which are nonetheless included in the analysis).
Form factors
Currently there are many types of computers on the market, tailored to different environments and targeting different user profiles. These form factors also tend to have different specs (even if there is overlaps) (Elias, 2020). The various form factors can also vary in their architecture and components, for example; All-in-One (AiO) computers and laptops have integrated displays, whereas desktop computers do not. Since the aim is to measure energy efficiency based on the expected use and given the aforementioned architectural differences, the setting of the energy efficiency classes for the label is done per form factor. For that purpose, the following form factors are defined:
Desktop computers (including stationary workstations)
Integrated desktop computers (AiO)
Portable computers (including tablet c, notebooks and mobile workstations)
A scattering of meta efficiency test results for all form factors can be seen in Figure 1. These are distinguished by colour coding. As the graphic showcases, despite the overlap the decision of separate efficiency classification is justified on the actual distribution of values. The figure below includes mobile workstations (MWS) as well but at a later point in the development of the label, it was decided that the MWS would be part of the broader portable computers category since it is clearly not distinguishable from it in terms of energy efficiency.
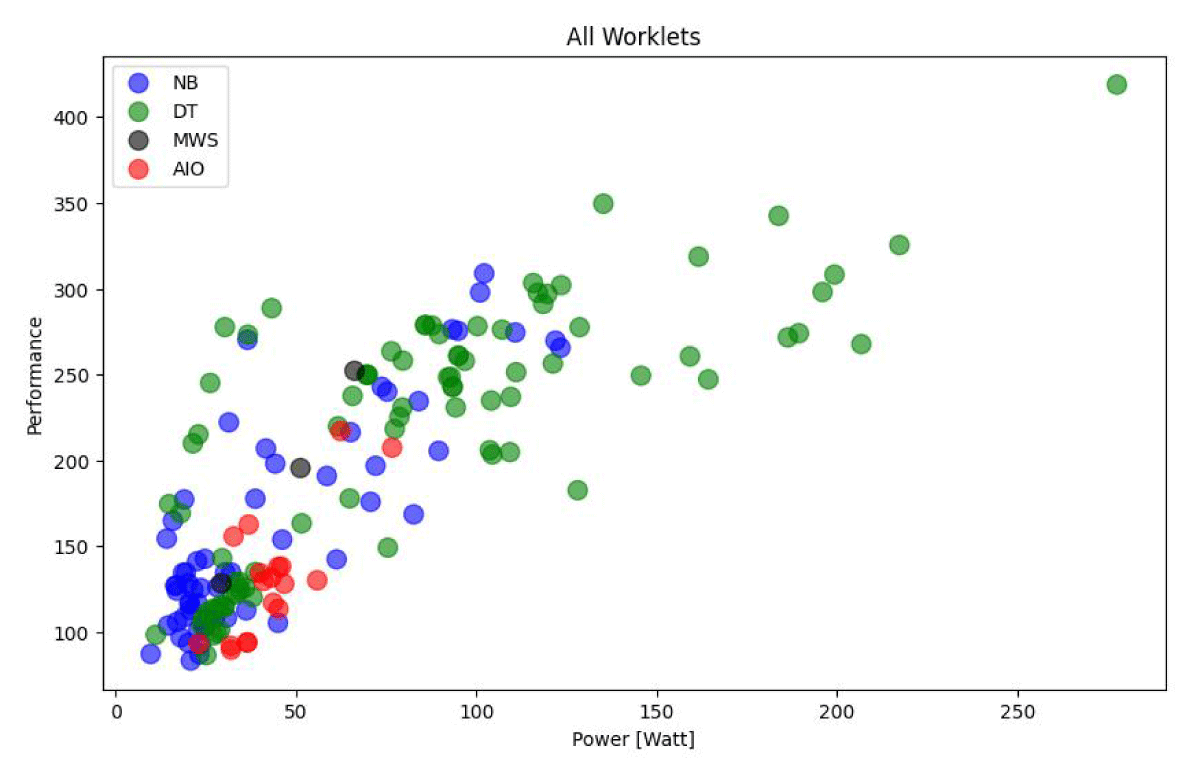
Figure 1
Scatter plot of test results for performance over watts.
User profiles
As explained in earlier sections, the point of the developed methodology is to be able to calculate the energy efficiency of the actual computer usage. To that end, the classification needs to be tied to the type of computer (or form factor). Beyond that, however, another relevant distinction is that of the user profile i.e. the expected usage patterns.
Each worklet represents a specific activity, as commented before, which allows for using them as building blocks to construct (i.e. to test) a specific use pattern. While representing every single possible user profile is neither possible nor useful, aggregating the values in a single score may produce metrics that are not indicative of the actual use that the consumer will have. As an example, the gaming market has experienced a noteworthy growth (Intel, 2019; Wes, 2022; Allied Market Research, 2021), which has meant the birth of computers that differ from conventional office-computers and include specific components and features such as better graphic processing and high-speed RAM (Wilson, 2022).
As a way to reach a balance between readability and granularity of the energy label, two user profiles are defined. On the basis of these user profiles, two meta energy efficiency metrics are developed using differing worklets depending on the expected tasks each user profile will make use of. On this basis the user profiles are defined as follows:
General computing. This profile represents common office and domestic use of computers. The activities included in the worklets relate to text processing, calculations, audio conversions, web browsing, etc. The meta energy efficiency metric for this one includes a total of 14 worklets.
High performance computing. This profile represents a more specialized and intensive use of a computer. It covers professional work, design and gaming. The worklets used for this metric are 8 in total and relate to activities such as graphics processing, AI work, coding, etc.
Before setting the worklet amount in 14 and 8 respectively, other options were considered; namely a more extensive option of 18 worklets and a reduced list of 4 worklets. These options were tested in terms of how well they would allow for the setting of the energy efficiency categories for the label.
Since the label development process takes long, developments in the computing sector demand adapting the method. With the recent increase on AI computing, a revision of the user profiles has been undertaken with a modified 7 worklet suite for the high performance computing. This replaces some worklets and adds a newly developed worklet focused on utilization of NPU (Neural Processing Unit). Table 1 shows a summary of all the worklets and in which suites (i.e. sets of worklets) they are utilized.
Table 1
Test suite software worklets and description: Gen14 for the general computing and the 7 and 8 worklet alternatives for the high performance computing.
| # | WORKLET NAME | GEN14 TEST | PERF7 TEST | PERF8 TEST |
|---|---|---|---|---|
| 1 | LibreOffice Writer | X | ||
| 2 | LibreOffice Impress | X | ||
| 3 | LibreOffice Calc | X | ||
| 4 | SQLite 1 thread | X | ||
| 5 | Encode MP3 | X | X | |
| 6 | Selenium Kraken Chrome | X | ||
| 7 | PyBench | X | ||
| 8 | TJBench | X | ||
| 9 | LibreOffice Convert | X | ||
| 10 | FreeCAD | X | ||
| 11 | Decompress ZSTD | X | X | |
| 12 | Compress ZSTD | X | X | |
| 13 | 7zip (integrated Benchmark) | X | X | |
| 13 | 7zip | X | X | |
| 14 | Stockfish | X | X | X |
| 15 | Blender | X | X | |
| 16 | 3DMark Wild Life Extreme | X | ||
| 17 | Unity Spaceship | X | ||
| 18 | Handbrake | X | X | |
| 19 | Gravitymark | X | ||
| 20 | 3DMark Steel Nomad | X | ||
| 21 | 3DMark Solar Bay | X | ||
| 22 | Procyon AI Computer Vision | X |
Depending on the amount of worklets chosen for the meta energy efficiency, the resulting Energy Efficiency Indicators (EEI, or the Energy Classes) would results in different ranges. In order to better visualize the test result distributions, all values have been normalised to the highest values of the dataset i.e. the general computing values.
To illustrate the development process, Figure 2 shows the spread of test results for different test suites (i.e. settings including different worklets). It showcases why the user profiles were built with the 14 and 8 worklet configurations. Both these options show many similarities in the test result distribution, which provides coherence between approaches but it also shows that in some cases, different energy classes can be obtained for different user profiles, which proves the usefulness of the split. Furthermore, the 4 worklet option showed to carry higher risk of uncertainty and incorrect measurements.
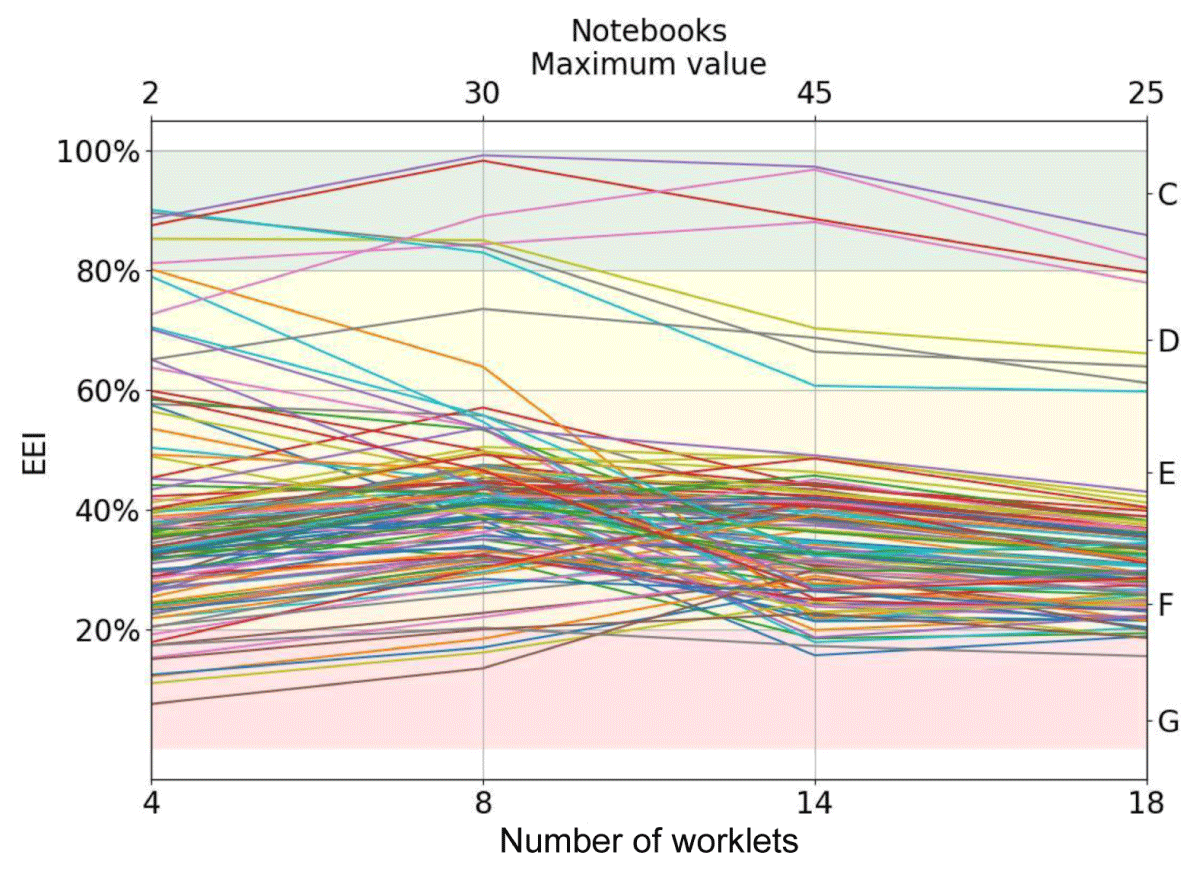
Figure 2
Distribution of energy efficiency indicators (EEI) for notebooks for the discussed sets of 4 and 8 worklets for the high performance computing user profile and the 14 and 18 worklets sets for general computing. Generated by Python.
Table 2 shows the resulting absolute values for the EEI limits of each energy class for the two user profiles for notebooks and desktops.
Table 2
EEI limits for each energy efficiency category (A to G) for each approach (4 to 18 worklets).
| GENERAL COMPUTING | HIGH PERFORMANCE COMPUTING | ||||
|---|---|---|---|---|---|
| CLASS | EEI RANGE NOTEBOOK & DESKTOP | % MODELS | CLASS | EEI RANGE NOTEBOOK & DESKTOP | % MODELS |
| A (highest class) | 38.40 ≤ EEI | 0.0% | A | 27.90 ≤ EEI | 0.0% |
| B | 26.50 ≤ EEI < 38.40 | 0.5% | B | 21.10 ≤ EEI < 27.90 | 0.7% |
| C | 18.30 ≤ EEI < 26.50 | 5.8% | C | 16.00 ≤ EEI < 21.10 | 9.1% |
| D | 12.60 ≤ EEI < 18.30 | 6.8% | D | 12.10 ≤ EEI < 16.00 | 13.3% |
| E | 8.70 ≤ EEI < 12.60 | 24.6% | E | 9.20 ≤ EEI < 12.10 | 31.5% |
| F | 6.00 ≤ EEI < 8.70 | 18.3% | F | 7.00 ≤ EEI < 9.20 | 29.4% |
| G (lowest class) | EEI < 6.00 | 44.0% | G | EEI < 7.00 | 16.1% |
Discussion on product families
During the development process, OEMs raised a major concern regarding the practicability of the label, namely the issue of product families. While in the case of household appliances each product model has very few configurations or even just one; for computers it is typical to have a high degree of flexibility in terms of specs and components for each model. In certain segments of the market, for example in gaming, system configurability is a key aspect of consumer expectations. Although typically OEMs select only a handful of variations to be displayed on their website (Lenovo Deutschland, 2024; Dell, 2022), the range of potential variations can be much higher. Table 3 below shows an example of how this can quickly escalate.
Table 3
Illustrative example on options on different system configurations.
| COMPONENT PART | NUMBER OF OPTIONS |
|---|---|
| Central processing unit (CPU) | 5–12 |
| Graphics processing unit (GPU) | 7–15 |
| Memory (different brands, speeds, quantity) | 40–60 |
| Storage (SSD – brands, speed, quantity) | 40–60 |
| Power supply | 30–60 |
| Total combinations | 1 680 000–38 880 000 |
This obviously presents a challenge since each configuration would have a different performance rating and hence potentially yield different energy efficiency results. Furthermore, testing every single configuration would impose huge logistical and cost barriers to producers and consumers alike. As part of the label development work thus it was proposed to create the product families as clusters of configurations to allow for testing less units in order to make the testing feasible.
In the following section, an analysis of the test results for different configurations within the same families will be presented and the different options for clustering criteria will be discussed.
Within the full dataset available, 27 group families were identified. For this analysis, the working criteria for setting product families was models sharing the same model name but with different technical specs. In order to check how different the test results for these could be, a spread of these was plotted over the efficiency classes limits. See Figure 3 for the result. Units of the same family share colours and the families are separated vertically. Company and model names have been removed in order to preserve anonymity. The results are mixed: some families seem to remain within the same efficiency class while many others spill over to another one. In any case, the maximum range observed covers two adjacent energy classes at maximum. Although not a big disparity, this still highlights the problem stated in the previous section of balancing the feasibility of the testing for the OEMs while ensuring that the information in the label remains accurate and useful for consumers. In practice, it is conceivable that OEMs will organize the grouping of individual devices into families in such a way that all devices meet the energy efficiency standards corresponding to their label.
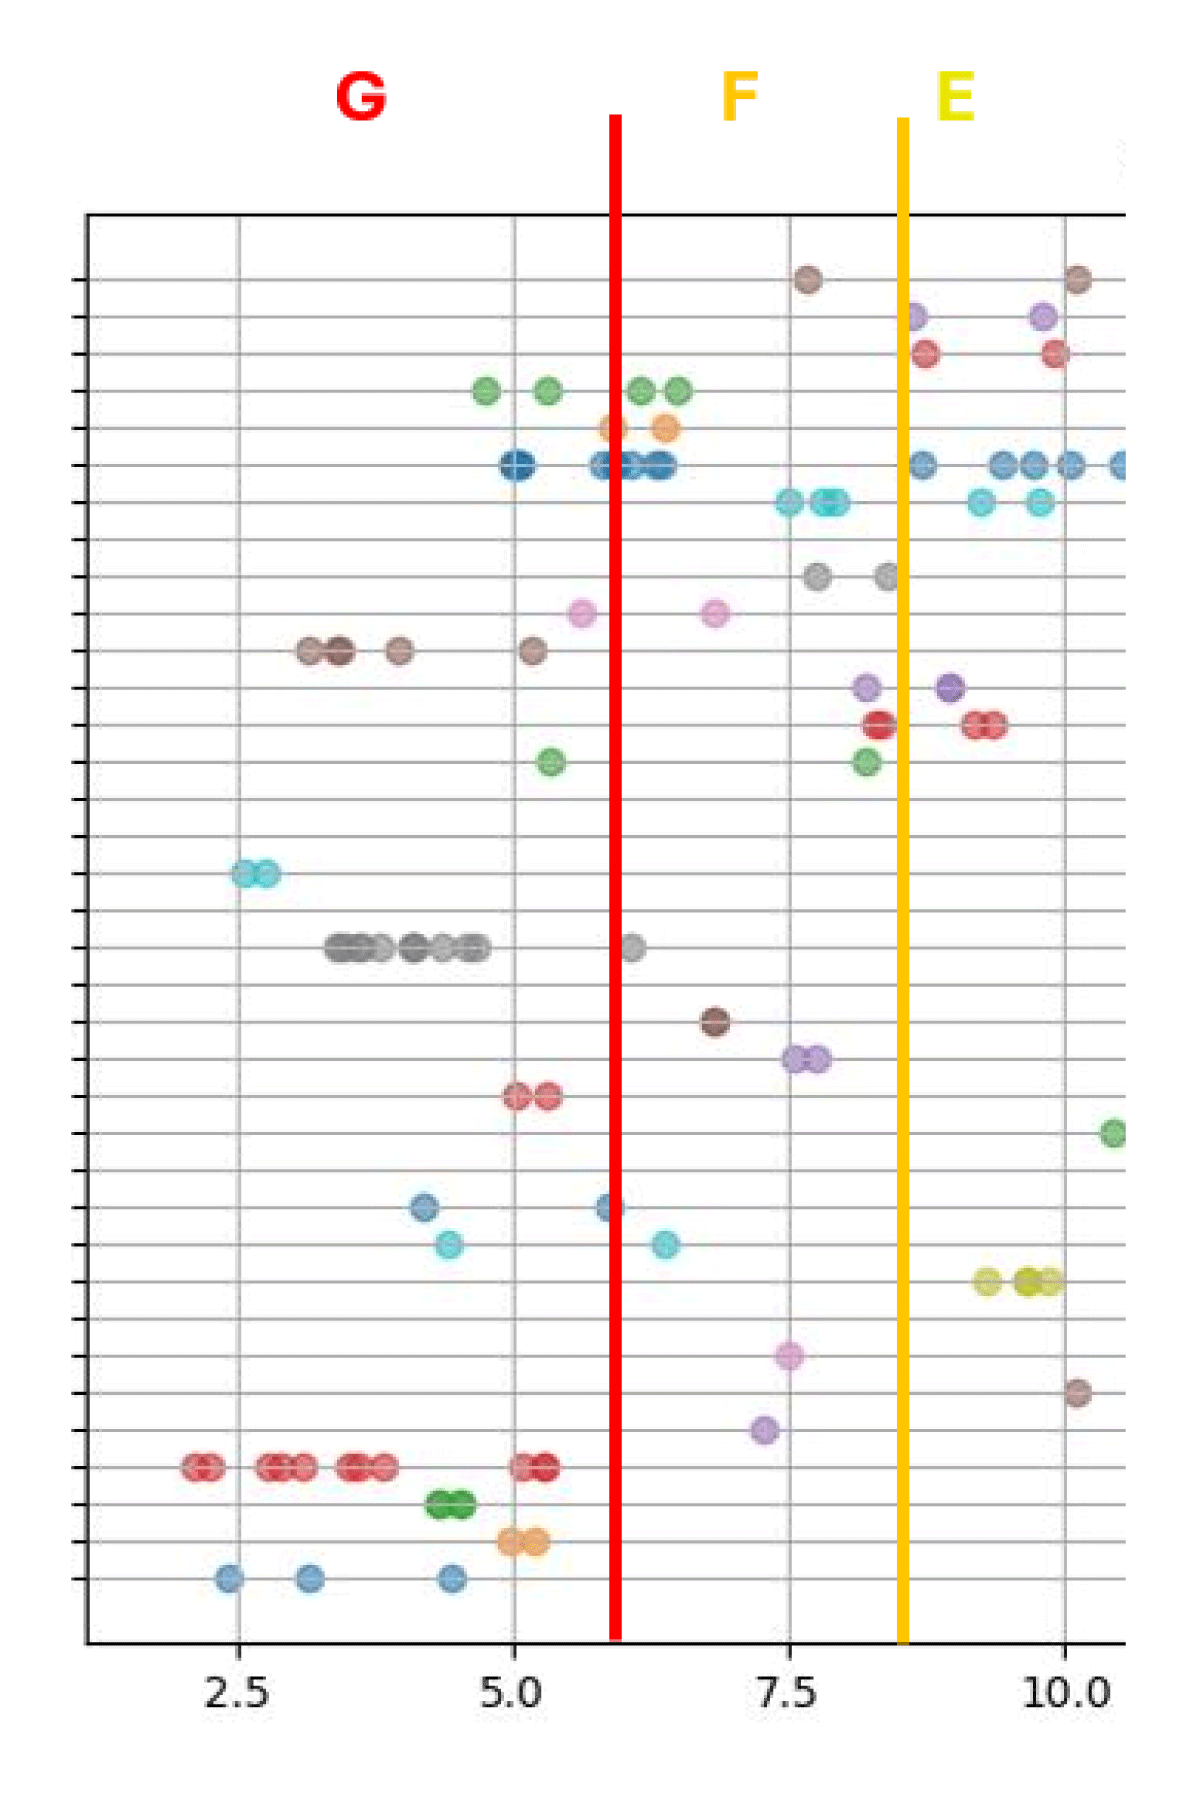
Figure 3
Distribution of meta energy efficiency for tested product families.
Since this high variation in potential configurations is fairly exclusive to computers, existing definitions for product families in a legal context are scarce. Apart from that, marketing considerations also tend to play a role in defining these from the OEM side and, as seen earlier, the specs are not a reliable criteria for market surveillance authorities to identify models of a same family.
During the development, several options have been considered. One possibility was to designate a typical configuration for each family and have all models share its label. What constitutes a common configuration, however, would be for the OEM to decide. It was then suggested that the best-selling configuration could be used as a reference. This however still poses similar challenges in particular regarding the representativeness of the resulting label. The risk would be that poorly performing configurations would display higher efficiency values than it actually has. Therefore, it was settled that whatever the final definition of a family was, the worst performing configuration shall be used as reference for the labelling. This approach is also followed by some existing standards like ENERGY STAR (Energy Star, 2020).
With regards to the question of what exactly constitutes a product family for the energy labelling, the initial proposition was to leave this decision up to the OEMs. This would ensure enough flexibility, but since the worst performance is to be displayed in the label, there would still be the incentive to subdivide families for better label accuracy. However, this still opens up the risk of introducing bias in the label via selection of the family or test pool. Having a set of objective criteria for family definition also shall ensure that the label results are accurate and can serve the consumers for informative comparison between models. It was proposed that, in order to include products in the same family, the following need to be shared:
Chassis/Casing
Mainboard/Motherboard
Operating System
Battery (only for mobile computers)
Screen (only for laptops, tablet computers and AiOs)
Same class in other label aspects (reparability, free-fall and spill)
This definition would allow for systems to differ in several internal components, connections and configurations while retaining enough objective coherence. In any case, the worst performing configuration would still be the reference. The whole product family would, in this case, share the same EPREL registration number. The discussion on this topic is still ongoing, since the proposed set of criteria significantly reduces the flexibility on the OEM side which may eventually hinder practicability and not match well with varying naming conventions used by different manufacturers.
Conclusions
Unlike products like household appliances, labelling energy efficiency of computers during active use is a complex issue with many challenges. Furthermore, the energy label as a consumer information tool imposes high accuracy and usability requirements on the displayed measurements. In this paper, an overview of the development of such a label has been presented. The tool developed by GTD allows for measurement of energy efficiency during several common tasks, offering the worklets as discrete building blocks to create user profiles that reflect real world computing. After much work, a balance between representativeness and simplification has been reached by the three test suites developed for both general computing and high performance computing (out of which two sets will be finally used, one per user profile). Furthermore, these allow for setting ranges and appropriate energy efficiency categories to be displayed in the label. An open question remains on how the different model configurations shall be clustered. In this paper, a set of criteria has been proposed. Work is still ahead to ensure that the final product family definition ensures result accuracy and representativeness without posing too high a bar for OEMs and allowing some flexibility, with aim to making the energy label useful but also feasible.
Additional File
The additional file for this article can be found as follows:
PowerPoint Slides
PowerPoint slides relating to this article. DOI: https://doi.org/10.66506/essp.3-144-26.s1
Note
eceee Paper ID
3-144-26