
Table 1
Summary of studies on the drivers of residential energy and electricity consumption.
| REFERENCE | GEOGRAPHY AND POPULATION | METHOD | KEY DRIVERS |
|---|---|---|---|
| (Tsemekidi Tzeiranaki et al. 2019) | EU (28 countries), Eurostat data | Linear regression | Economic growth, climate, dwelling size, behaviour |
| (Brounen et al. 2012) | Netherlands, 300,000 households | Statistical analysis | For gas: building’s physical characteristics For electricity: household characteristics like size and income |
| (Lévy and Belaïd 2018) | France, ≈30,000 households | Logistic regression | Life cycle of households, housing type and demographic characteristics |
| (Borozan 2018) | Europe (64 regions) | Regression analysis | Income, unemployment, and education |
| (Huebner et al. 2015) | UK, 924 households | Lasso regression | Building characteristics, socio-demographic and behaviour |
| (Millar et al. 2025) | UK, 7 homes | Empirical monitoring and quantitative analysis | Building type, heating technology, occupant behaviour |
Table 2
Summary of the key characteristics of both subpopulations.
| CHARACTERISTICS | SERL | PANEL PARTICULIERS |
|---|---|---|
| Sample size used in the study | 6,815 gas and 8,485 electric smart meters | 1,336 electric smart meters |
| Temporal coverage | 2023 & 2024 | 2024 |
| Time resolution | 30 minutes | 30 minutes |
| Dominant heating technology | Gas | Electric |
| Tariff structure | Mostly flat-rate tariffs | ~95% time-of-use pricing |
| Key limitations | Pre-aggregated data for this study; limits analysis of diversity | Not nationally representative for this study |
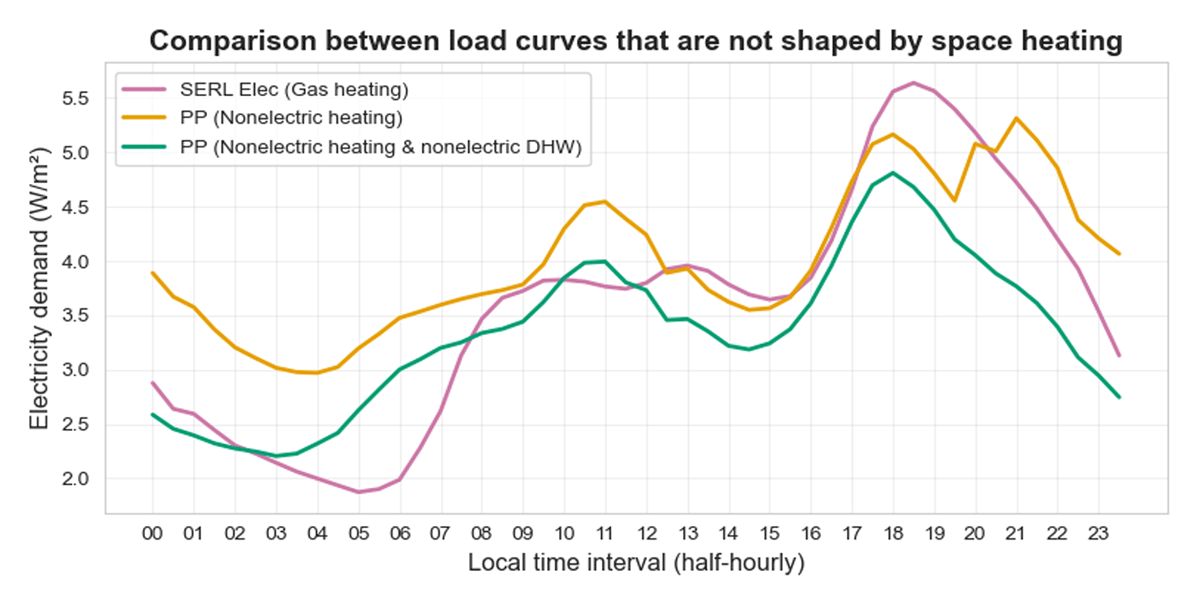
Figure 1
Normalised daily non-heating residential load curves (SERL: 6,779 households; PP: 723 and 435 households).
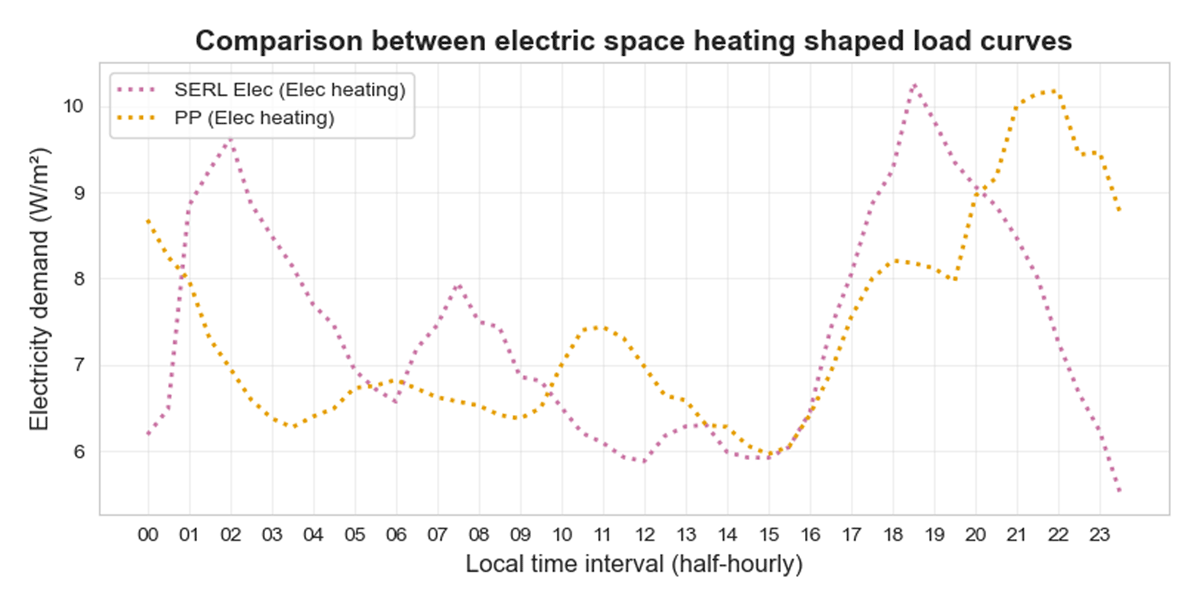
Figure 2
Normalised daily equipped with electric-heating residential load curves (SERL: 460; PP: 613 households).
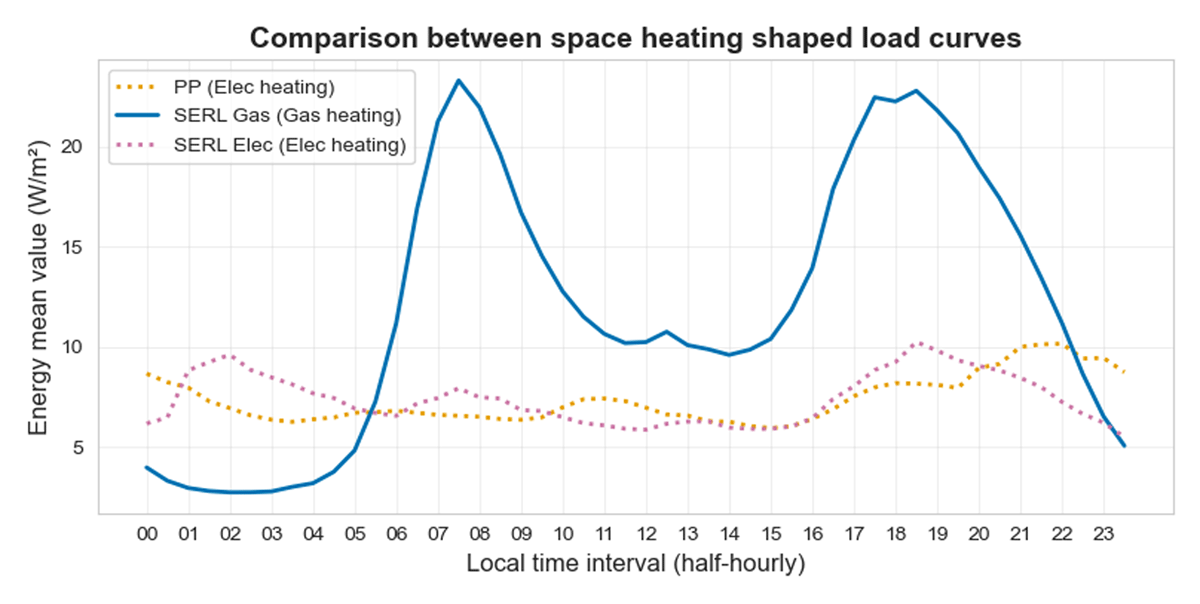
Figure 3
Normalised daily residential load curves for different space heating source (SERL gas: 6,092; SERL electric: 460; PP: 613 households).
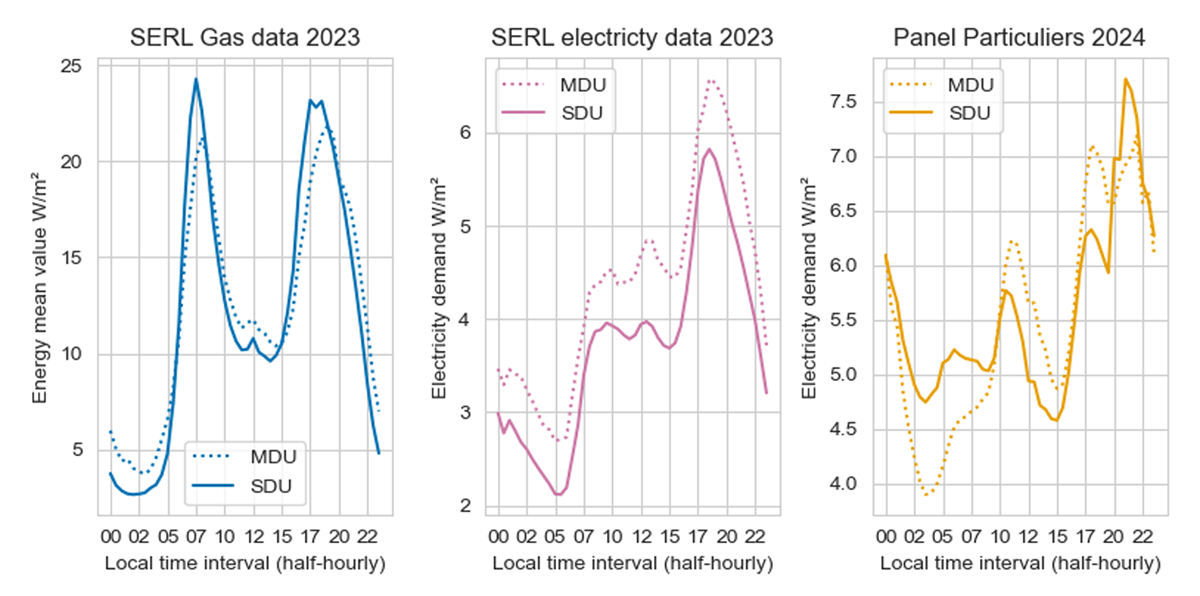
Figure 4
Normalised daily residential load curves for different building type (SERL vs PP).
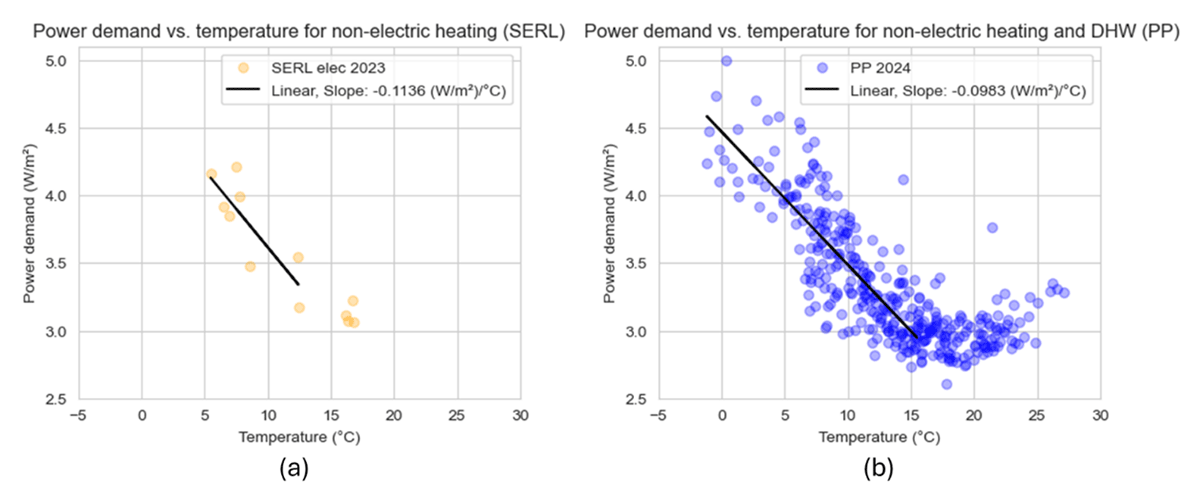
Figure 5
Temperature gradient analysis of non-electrically heated homes (a) SERL vs (b) Panel Particuliers, (W/m2)/°C.
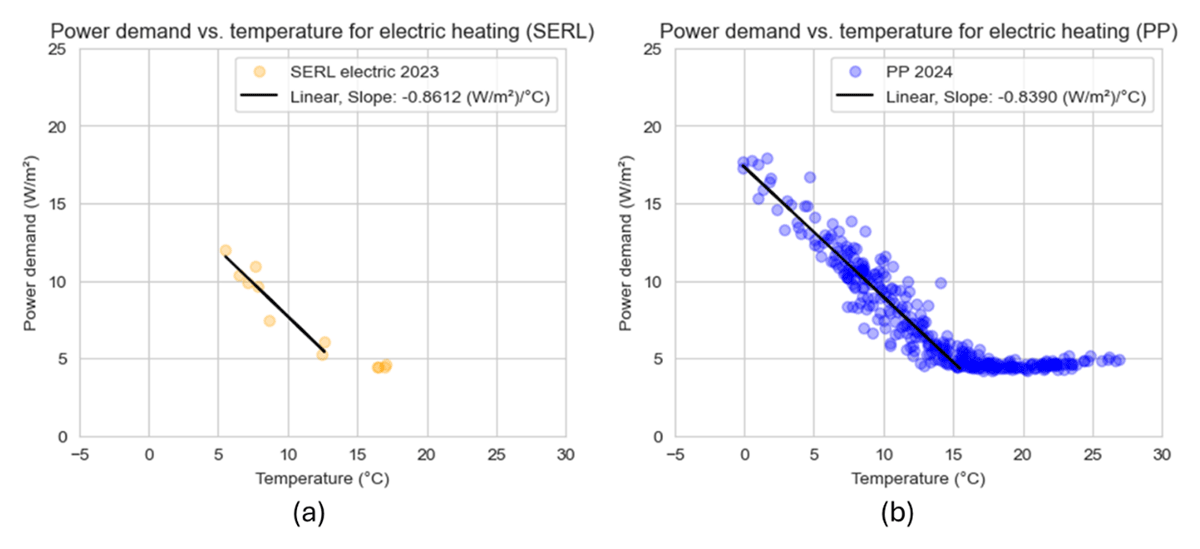
Figure 6
Temperature gradient analysis of electrically heated homes (a) SERL vs (b) Panel Particuliers, (W/m2)/°C.
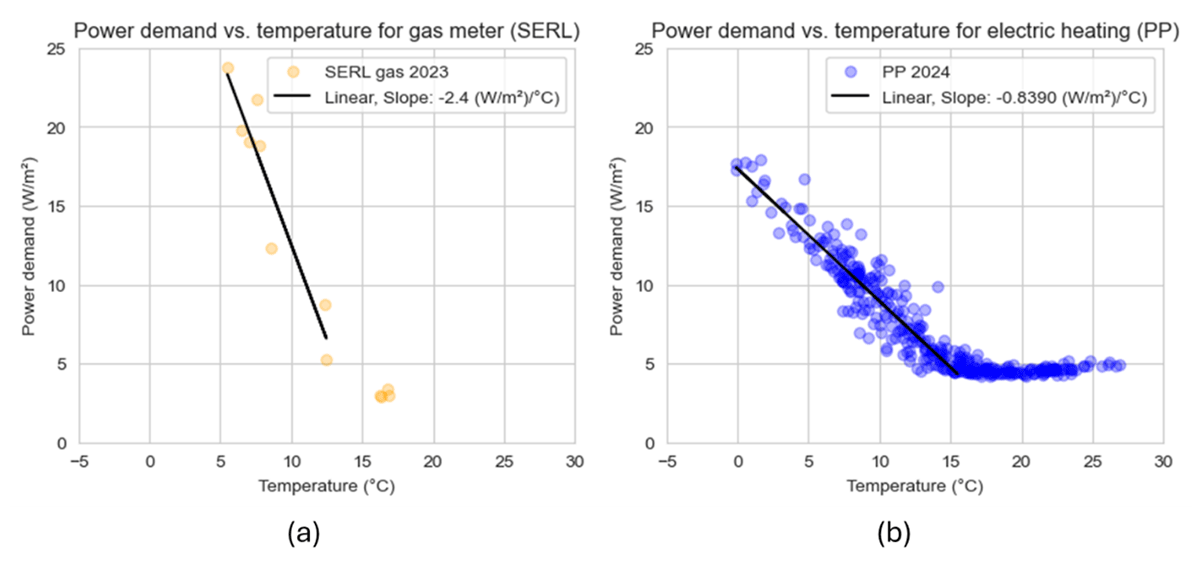
Figure 7
Temperature gradient analysis from (a) gas meter SERL vs (b) electric meter Panel Particuliers for electric heated, (W/m2)/°C.