
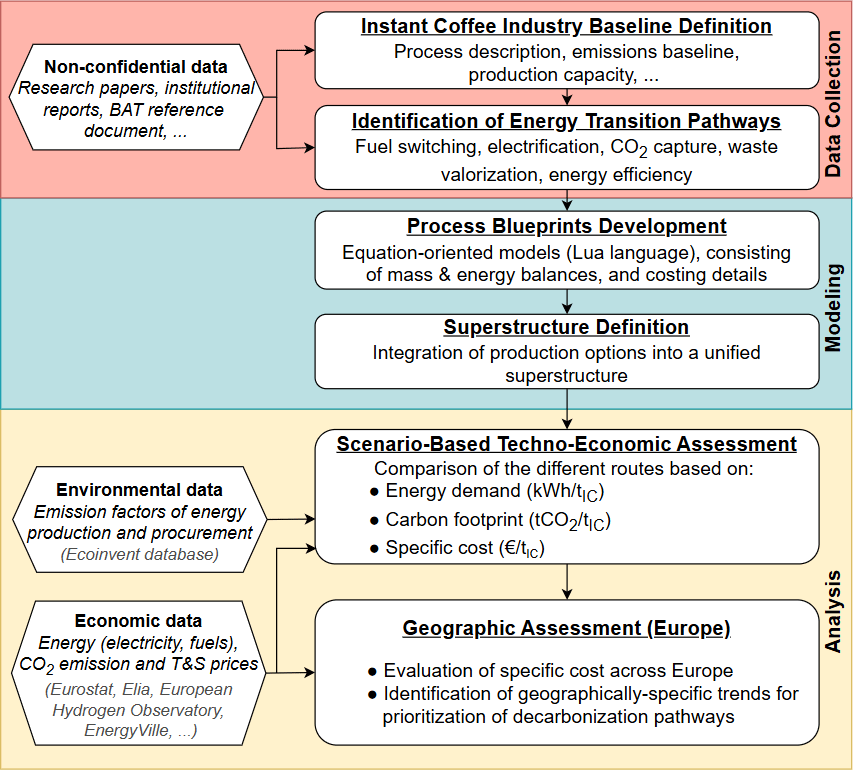
Figure 1
Methodological workflow.
Table 1
Model parameters for instant coffee production.
| PARAMETER | VALUE |
|---|---|
| Roasting | |
| Green coffee beans | 2.4 tGCB/tIC (Gosalvitr et al., 2023) |
| Silverskin removed | 18 kgSS/tIC (Chemat et al., 2024) |
| Heat demand for roasting | 3.73 GJ/tIC (Ladha-Sabur et al., 2019) |
| Heat demand for afterburner | 10.37 GJ/tIC (Brinkmann et al., 2016; Kekes et al., 2025) |
| Brewing | |
| Heat demand | 8.50 GJ/tIC (Ladha-Sabur et al., 2019) |
| Spent coffee grounds generated | 1.56 tSCG/tIC (Sidło and Latosińska, 2025) |
| Concentration | |
| Heat demand | 7.45 GJ/tIC (Ladha-Sabur et al., 2019) |
| Freeze-drying | |
| Electricity demand | 3,000 kWh/tIC (VNT, 2025) |
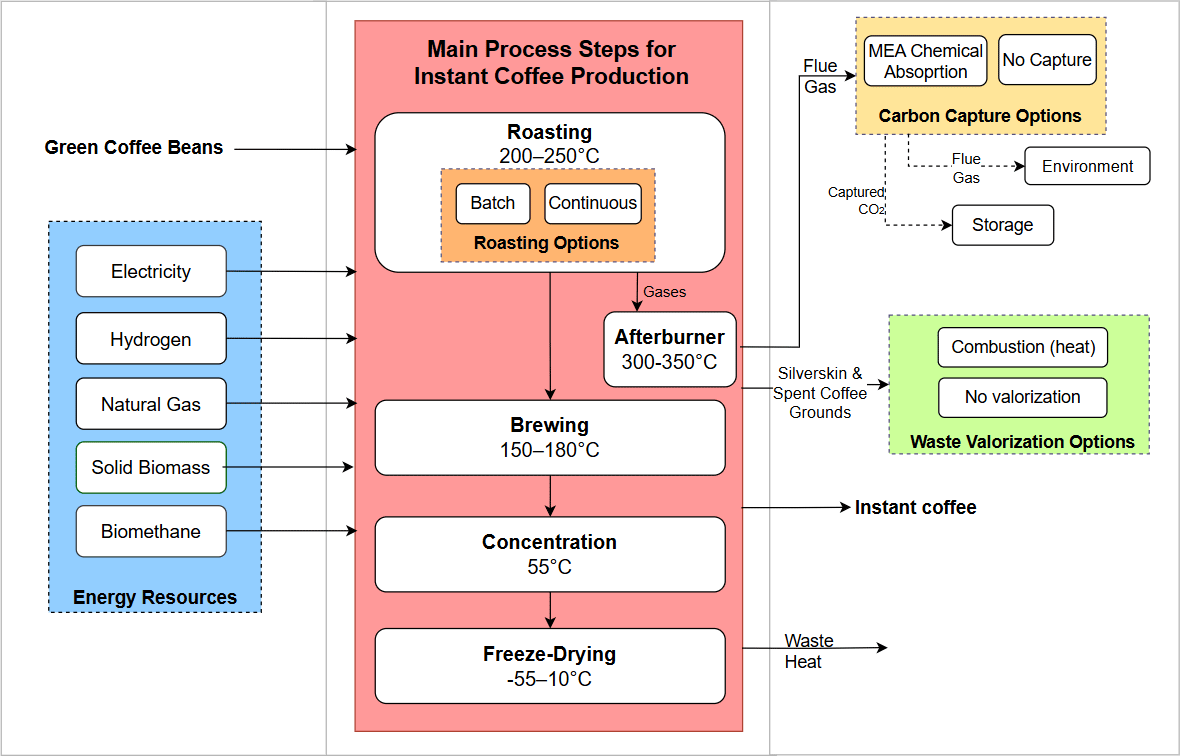
Figure 2
Superstructure of instant coffee production encompassing fuel switching, electrification, CO2 capture, waste valorization, and energy efficiency.
Table 2
Proposed configurations for the decarbonization of instant coffee production.
| ABBREVIATION | CONFIGURATION DETAILS |
|---|---|
| NG | Natural gas combustion |
| NG-CC | Natural gas combustion with CC |
| BioCH4 | Biomethane combustion |
| BioCH4-CC | Biomethane combustion with CC |
| EL | Electrically-powered heat supply |
| Green H2 | Green hydrogen combustion |
| Grey H2 | Grey hydrogen combustion |
| BM | 100% biomass substitution: process waste + wooda |
| BM-CC | 100% biomass substitution with CCa |
| BM/NG | Partial biomass substitution: process waste + natural gasb |
| BM/NG-CC | Partial biomass substitution with CCb |
| Eff | Energy demand reduction through continuous roasting (natural gas combustion) |
[i] a Biomethane is used in the afterburner.
b Natural gas is used in the afterburner.
Table 3
Emission factors of different energy commodities.
| COMMODITY | EMISSION FACTOR (KGCO2/KWH) |
|---|---|
| Natural gasa | 0.039 |
| Biomethaneb | 0.036 |
| Biomassc | 0.016 |
| Electricityd | 0.138 (2025)–0.057 (2050) |
| Hydrogene | 0.045 (green)–0.312 (grey) |
[i] a (ecoQuery, 2022b).
b (ecoQuery, 2022a).
c (ecoQuery, 2020).
d The value for 2025 is retrieved from Statista (2025), whereas the 2050 value is estimated using the methodology described in Supplementary Material Section S4.
e (IEA, 2023).
Table 4
Commodities costs adopted for different scenarios.
| COSTS | PRESENT | IDEAL | COMPETITION |
|---|---|---|---|
| Electricity (€/MWh) | 194a | 95b | 111b |
| Hydrogen (€/MWh) | 269c | 100d | 135d |
| Natural gas (€/MWh) | 50e | 55 | 55 |
| Biomethane (€/MWh) | 84f | 54f | 120 |
| Biomass (€/MWh) | 31g | 20d | 80d |
| CO2 emission (€/t) | 75h | 200d | 200d |
| CO2 T&S (€/t)i | 50 | 50 | 50 |
[i] a (Eurostat, 2025a).
b (Elia, 2024).
c (European Hydrogen Observatory, 2025).
d (EnergyVille, 2025).
e (Eurostat, 2025b).
f (BIP Europe, 2023).
g (Argus, 2026).
Table 5
Price variation ranges across Europe for electricity, electrolytic hydrogen, natural gas, biomethane, and biomass (2025).
| COSTS | MIN | MAX |
|---|---|---|
| Electricity (€/MWh) | 79 | 270 |
| Hydrogen (€/MWh) | 130 | 283 |
| Natural gas (€/MWh) | 47 | 106 |
| Biomethane (€/MWh) | 75 | 105 |
| Biomass (€/MWh) | 21 | 37 |
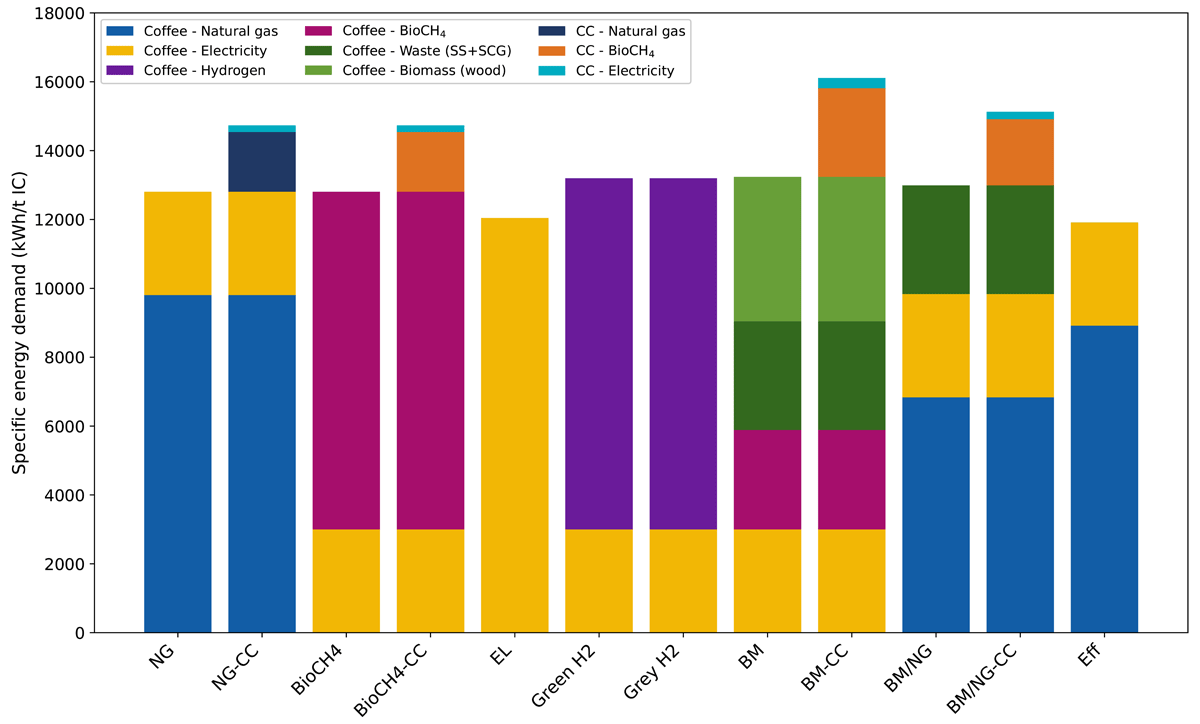
Figure 3
Specific energy demand for different instant coffee production routes.
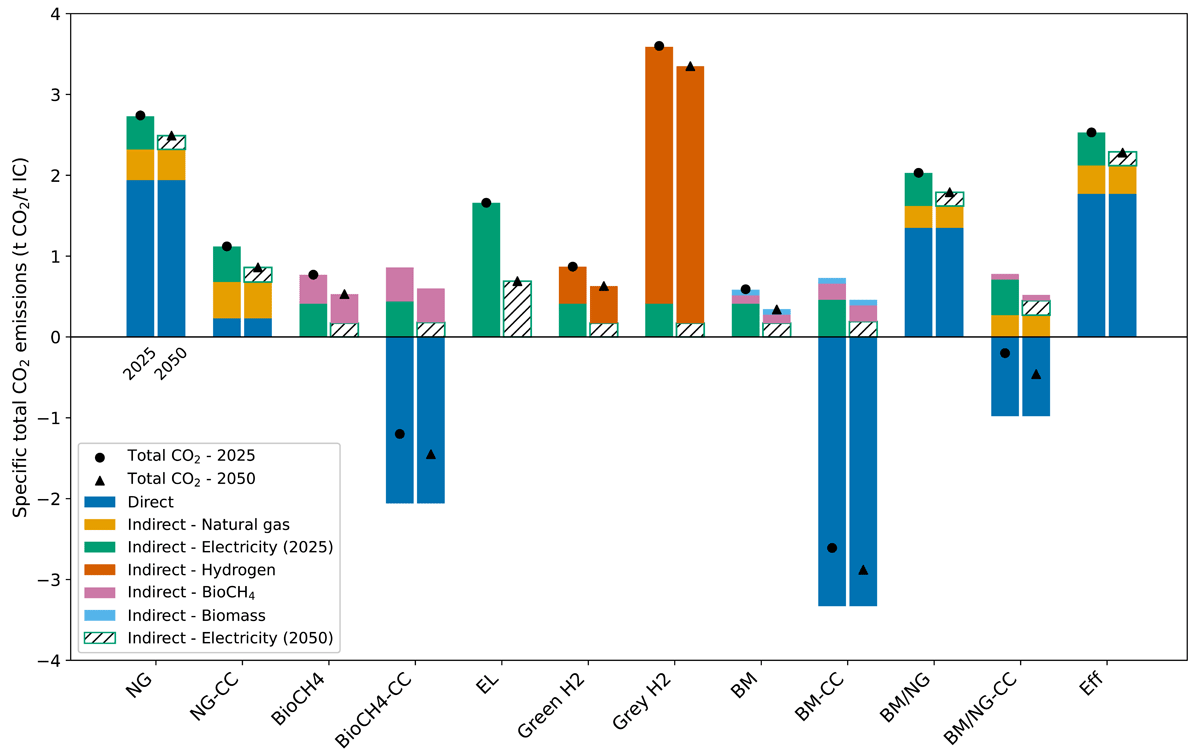
Figure 4
Specific total CO2 emissions breakdown for different instant coffee production routes in the 2025 (left) and 2050 (right) scenarios.
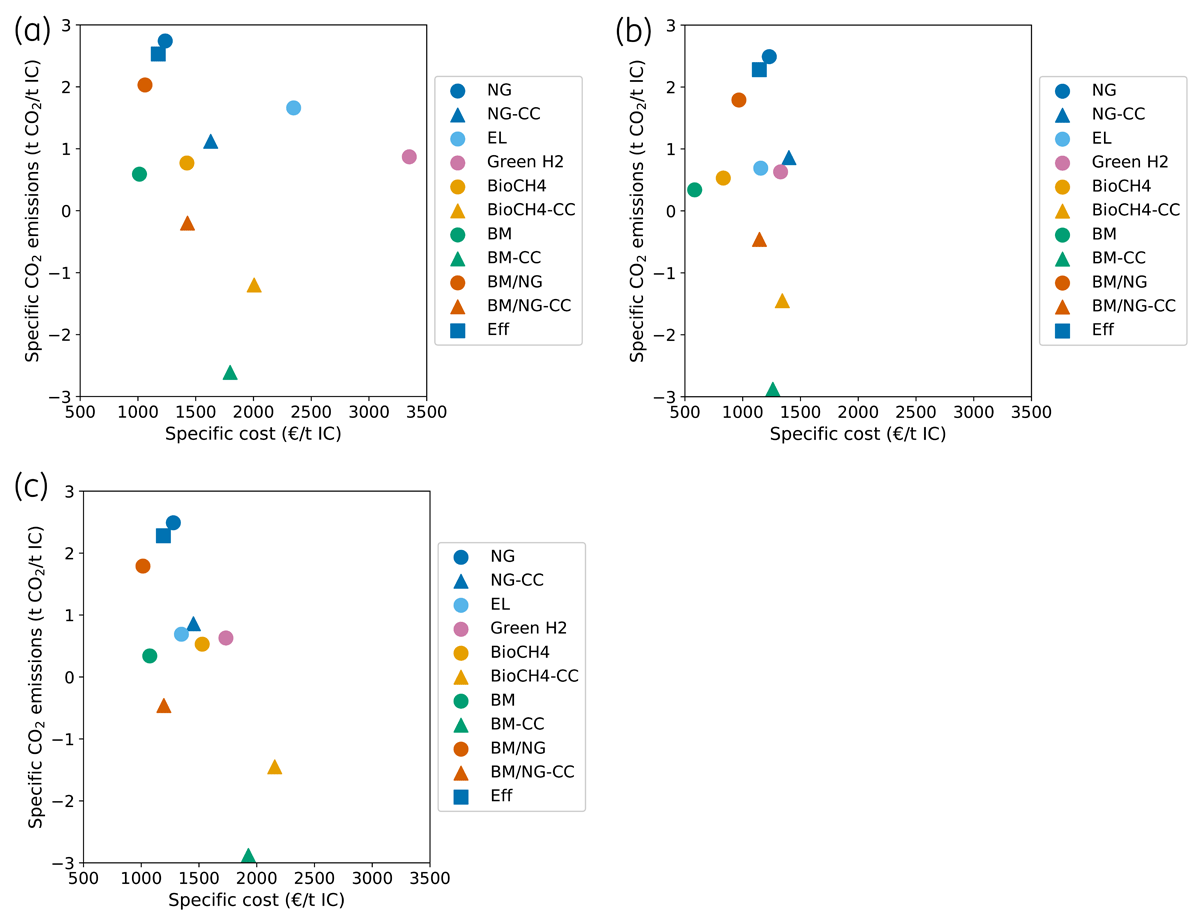
Figure 5
Specific total cost vs. specific total CO2 emissions for each production configuration in the (a) Present, (b) Ideal, and (c) Competition scenarios.
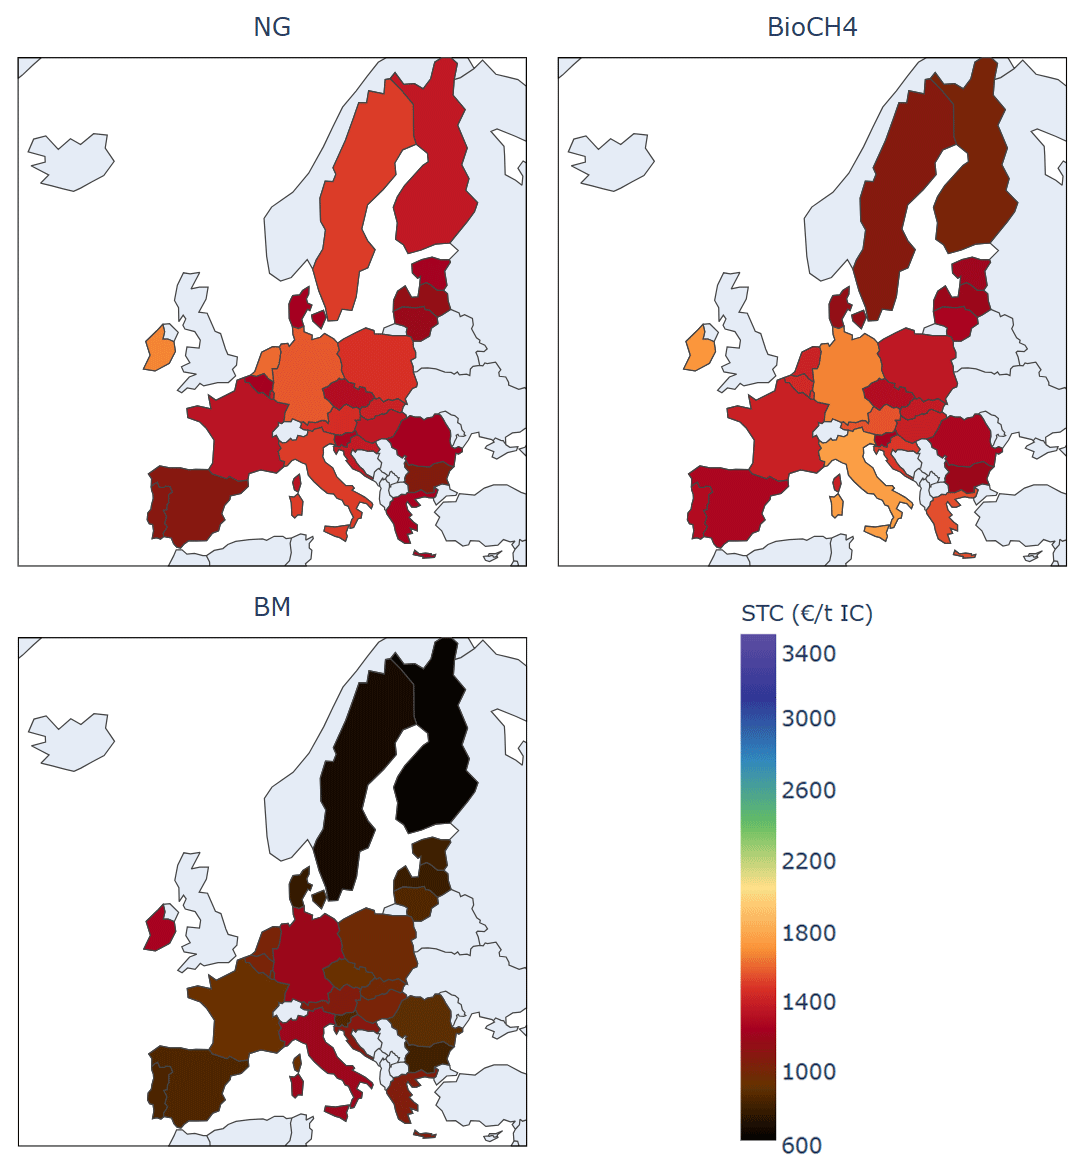
Figure 6
Fuel switching (‘NG’, ‘BioCH4’, ‘BM’) – specific total cost across Europe (2025).
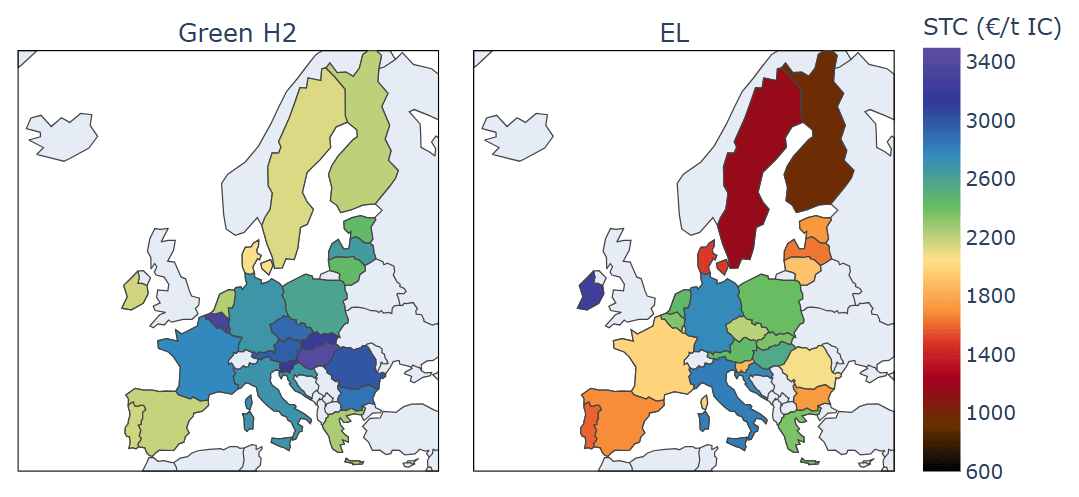
Figure 7
Indirect (‘Green H2’) and direct electrification (‘EL’) – specific total cost across Europe (2025).
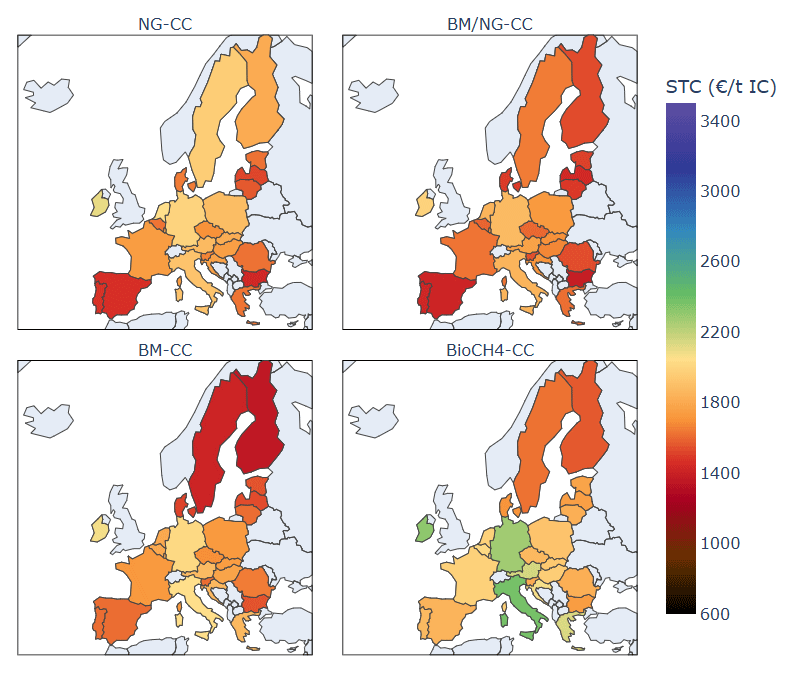
Figure 8
CO2 capture (‘NG-CC’, ‘BM/NG-CC’, ‘BM-CC’, ‘BioCH4-CC’) – specific total cost across Europe (2025).
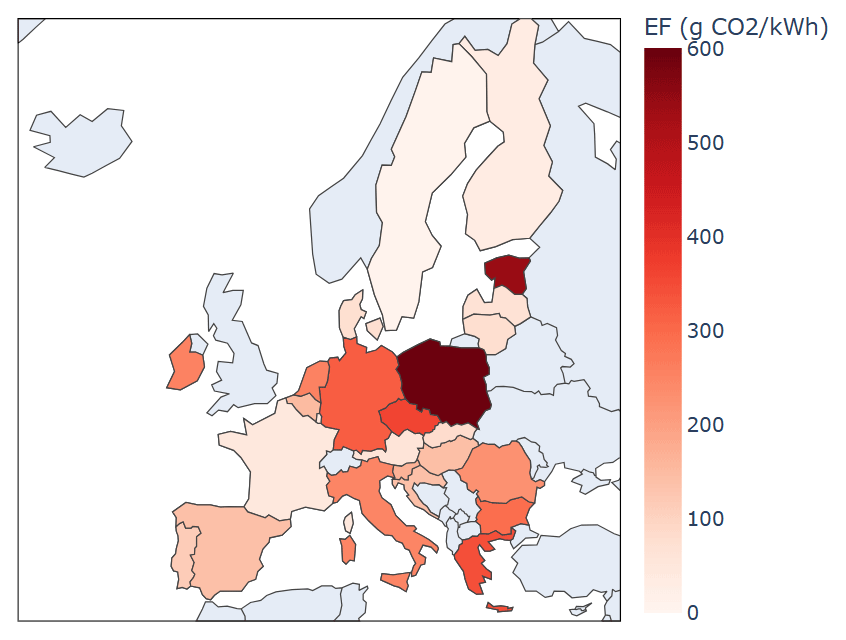
Figure 9
Emission factor of European electricity grids in 2023 (based on EEA (2025)).