
Introduction
Industrial activities are substantial contributors to CO2 emissions. On a global scale, the industrial sector accounted for approximately 22% of greenhouse gases (GHGs) emissions in 2023 (UNIDO, 2024). In Belgium, when accounting for emissions stemming from heat supply and chemical reactions, the industrial sector’s share of total emissions amounted to 29% in 2024 (Climat.be, 2025), highlighting its critical role in national decarbonization strategies. While energy transition studies focus mainly on hard-to-abate sectors—i.e., industries characterized by high-temperature heat requirements or CO2 emissions intrinsic to the implemented chemical reactions—such as glass, cement, or steel production, low-to-medium-temperature heat requirements represent half of the industrial heat demand (IEA, 2022). Hence, decarbonization strategies targeting exclusively high-temperature operations or reaction-inherent CO2 emissions are insufficient. Low-to-moderate temperature heat applications must also be addressed to reach net-zero targets.
A variety of sectors fall into this category, including the agri-food industry, whose heavy reliance on fossil fuels, combined with the projected increase in food demand due to global population growth, makes it a key sector for decarbonization (Ladha-Sabur et al., 2019). Hence, instant coffee (IC) manufacturing is selected as a representative case study for decarbonization pathways exploration. IC production involves several steps: roasting, extraction, concentration, and drying. Although each production stage operates at low to moderate temperatures, IC production is classified among the most energy-demanding processes within the food and beverage industry, primarily due to the roasting and drying steps representing a major share of the total energy consumption (Gosalvitr et al., 2023; Ladha-Sabur et al., 2019). A description of each step is provided below.
First, roasting develops the characteristic aroma, flavor, and brown color of roasted coffee beans (RB) through Maillard reactions and caramelization (Fernandes, 2019; Manzocco et al., 2019). Hot-air roasting is the predominant industrial coffee roasting technology and is implemented in either batch or continuous mode, with batch operation generally preferred for quality reasons (Schenker and Rothgeb, 2017). Green coffee beans (GCB) are typically roasted for 3–20 minutes at 200–250°C, commonly achieved by natural gas combustion (Schenker and Rothgeb, 2017; Schwartzberg, 2013). The process also generates approximately 7.5 kg of coffee silverskin (SS) per ton of GCB (Chemat et al., 2024). Exhaust gases are sent to an afterburner to reduce volatile organic compounds (VOC) emissions. Catalytic afterburners typically operate at 200–500°C, while thermal ones operate at higher temperatures (750–1,000°C) (Brinkmann et al., 2016; Schwartzberg, 2013).
After roasting, the RB are cooled using cold air or water spraying (Fadai et al., 2017), ground, and subjected to a solid-liquid extraction step, also referred to as brewing. During this process, hot water (100–180°C (Clarke, 2003)) is used to extract flavor compounds from the ground coffee in multi-stage countercurrent percolation systems operated under elevated pressures (Bassoli, 2019). The extraction process yields 2.1–2.3 kg of extract per kilogram of coffee beans processed (VNT, 2023). This stage also generates the main by-product of the coffee industry: approximately 650 kg of spent coffee grounds (SCG) are generated per ton of GCB processed (Sidło and Latosińska, 2025).
The coffee extract, containing 10–25% solids, is cooled (<15°C), clarified through centrifugation or filtration (Bassoli 2019; Clarke 1987), and concentrated (up to 60% solid content) by evaporation using steam. Concentration is typically implemented at around 55°C and under reduced pressure, resulting in energy savings and reduced flavor losses during the subsequent drying stage (Brennan, 2003; Neoh et al., 2016; Okada et al., 1980).
The final step is drying to a moisture content below 5% (Bassoli, 2019). Two drying methods are commonly employed. Spray-drying atomizes the concentrated extract into fine droplets, which are dried by a stream of hot air (up to 300°C), enabling the recovery of solid particles at the bottom of the drying chamber (Bassoli, 2019; Brennan, 2003; Owusu-Apenten and Vieira, 2023). Freeze-drying consists of three steps: (i) freezing of the concentrated coffee extract on temperature-controlled plates (≤40°C) (Shofinita et al., 2023); (ii) primary drying under vacuum (~100 Pa), i.e., water removal via sublimation of ice (Anandharamakrishnan, 2019); and (iii) secondary drying, i.e., removal of residual bound water under high vacuum (40 Pa) and increased temperature (~10°C) (Bassoli, 2019; Stratta et al., 2020). Although freeze-drying is highly effective at preserving aroma and flavor, it is energy-intensive due to refrigeration and vacuum pump operation (Ratti, 2001).
While the agri-food industry has begun investigating long-term strategies, such as fuel switching and investments in low-carbon technologies, to reduce energy and water demand (Ladha-Sabur et al., 2019), research in the coffee sector has primarily focused on improving energy efficiency of roasting and valorizing coffee waste within a circular economy.
Several studies have explored opportunities to recover heat from the roasting process, whose batch operation remains a significant challenge. Pantaleo et al. (2018) investigated the integration of intermittent thermal energy storage systems combined with Organic Rankine Cycles (ORC) or micro gas-turbines to recover heat from the gases leaving the afterburner. Similarly, Kljajić, Andjelković and Gvozdenac (2016) demonstrated that waste heat from the afterburner can be repurposed to preheat GCB prior roasting, reducing fuel consumption and shortening the roasting cycle. Recently, Kekes et al. (2025) reported an 18.2% reduction in fossil fuel use during coffee roasting through hot air recirculation from the thermal afterburner back into the roasting chamber. Alternatively, hot gases can be used for electricity generation in an ORC, which offers greater environmental benefits but involves higher technical complexity and upfront capital than air recirculation.
Beyond process optimization, SCG and SS offer strong valorization potential within a circular economy owing to their diverse composition of valuable compounds (Franca and Oliveira, 2022). Kougioumtzis et al. (2024) demonstrated that blending SCG with residual biomass improved pellet properties, confirming their suitability for renewable energy applications. Del Pozo et al. (2021) explored the valorization of SS through a slow pyrolysis-based biorefinery process, producing solid biochar (for pollutant adsorption or energy use), a caffeine-rich liquid fraction, and a gas stream reused for drying prior to pyrolysis, thereby improving energy efficiency. Similarly, Chemat et al. (2024) showed that water-based extraction of SS enables recovery of caffeine-rich extracts and insoluble fibers for use in beverages, materials, food, and feed applications. Moreover, Overturf et al. (2021) highlighted the potential of SS as substitute for virgin pulp in paper production, reducing GHG emissions by 13% without production cost increase.
As previously mentioned, IC manufacturing is highly energy intensive. Despite recent advances in heat recovery and waste valorization, there is still a lack of techno-economic assessments that systematically compare competing decarbonization options. To address this gap, the present study offers a techno-economic comparison across multiple emissions mitigation options for the IC industry—including energy efficiency improvement, fuel switching, electrification, and CO2 capture—based on performance indicators such as energy demand, CO2 emissions, and production costs. Unlike previous studies, which typically evaluated individual technologies, this work applies the superstructure methodology developed by Salman et al. (2025) to provide a comprehensive and robust assessment of alternative production pathways under several scenarios.
The objectives of this study are therefore to: (i) evaluate and compare fuel switching, electrification, CO2 capture, and energy efficiency options for the IC industry based on technical, environmental, and economic indicators; (ii) identify economically viable decarbonization pathways for IC production in Belgium and Europe; and (iii) contribute to the development of INDECATE, a web-based decision-support tool for industrial decarbonization.
Methodology
This study focuses on IC production, with the objective of identifying cost-effective CO2 emission mitigation strategies adapted to its specific constraints. The methodological workflow is represented in Figure 1.
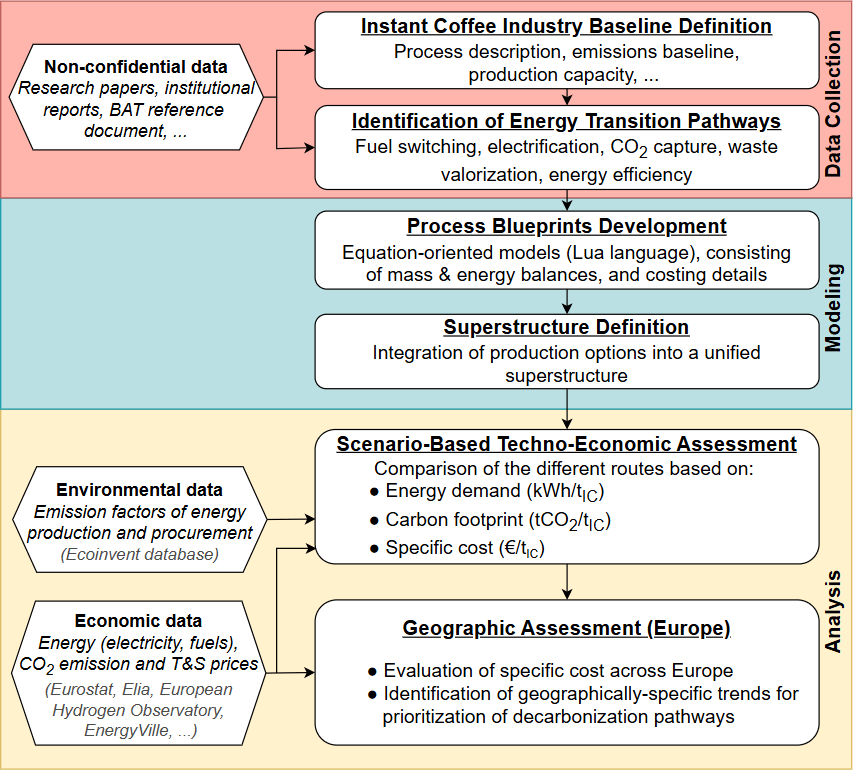
Figure 1
Methodological workflow.
First, a literature review aims at identifying applicable energy transition pathways and collect data for model development using academic papers, institutional reports, and Best Available Techniques (BAT) reference documents. The decarbonization pathways include fuel switching, electrification, CO2 capture and storage (CCS), bioenergy with CO2 capture and storage (BECCS), and energy efficiency improvement. Then, process blueprints (BP) for IC production are developed based on the collected data. BPs are formulated as equation-oriented models written in Lua language, incorporating steady-state mass and energy balances along with economic considerations such as annualized investment and operating costs. The superstructure encompassing all identified decarbonization pathways is evaluated using the OSMOSE tool, which is an optimization framework developed by the École Polytechnique Fédérale de Lausanne (Flórez-Orrego, Ribeiro Domingos and Maréchal, 2022). Its working principle is described in the Supplementary Material Section S1. The various IC production configurations are systematically compared based on technical, economic, and environmental criteria, which include specific energy demand, CO2 emissions, and specific cost. Finally, an economic assessment is performed under Belgian and European pricing scenarios to rank decarbonization pathways according to their economic and environmental performance.
Superstructure development
The present study focuses on a facility producing 5,000 tIC/y. This production process includes (i) GCB roasting and VOCs degradation in a catalytic afterburner; (ii) brewing of RB with hot water; (iii) coffee extract concentration; and (iv) freeze-drying. The energy demand corresponding to each step is listed in Table 1.
Table 1
Model parameters for instant coffee production.
| PARAMETER | VALUE |
|---|---|
| Roasting | |
| Green coffee beans | 2.4 tGCB/tIC (Gosalvitr et al., 2023) |
| Silverskin removed | 18 kgSS/tIC (Chemat et al., 2024) |
| Heat demand for roasting | 3.73 GJ/tIC (Ladha-Sabur et al., 2019) |
| Heat demand for afterburner | 10.37 GJ/tIC (Brinkmann et al., 2016; Kekes et al., 2025) |
| Brewing | |
| Heat demand | 8.50 GJ/tIC (Ladha-Sabur et al., 2019) |
| Spent coffee grounds generated | 1.56 tSCG/tIC (Sidło and Latosińska, 2025) |
| Concentration | |
| Heat demand | 7.45 GJ/tIC (Ladha-Sabur et al., 2019) |
| Freeze-drying | |
| Electricity demand | 3,000 kWh/tIC (VNT, 2025) |
Available decarbonization options include fuel switching towards low-carbon alternatives, process electrification, CCS, BECCS, and energy efficiency improvement. To systematically evaluate these alternatives, a superstructure approach is adopted, in which all feasible technology options and their combinations are represented within a unified framework. This enables the consistent generation and comparison of multiple process configurations. The resulting superstructure is depicted in Figure 2, where dotted boxes represent decision points. These include (i) energy resource used for heat supply; (ii) CO2 capture (CC) implementation; (iii) process waste valorization; and (iv) roasting technology.
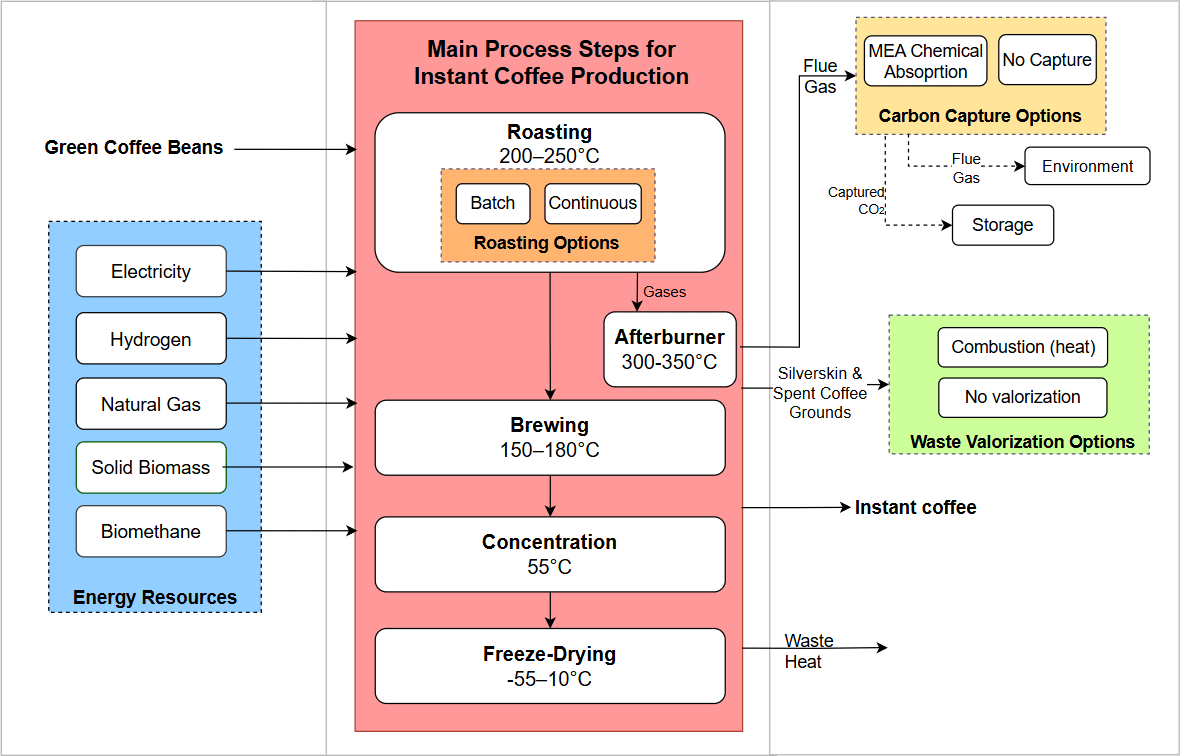
Figure 2
Superstructure of instant coffee production encompassing fuel switching, electrification, CO2 capture, waste valorization, and energy efficiency.
In the base case, the process heat requirement is fulfilled by natural gas combustion. Natural gas can be replaced, fully or partially, by non-fossil resources such as biomethane or biomass. Hydrogen combustion and electrification are also included. The corresponding efficiencies can be found in the Supplementary Material Section S2.
Moreover, the process waste generated during IC production (SS and SCG) may be valorized for heating purposes, to partially replace natural gas (QU4TRE, 2013).
The next decision point deals with CC implementation, considering the most mature technology, i.e., chemical absorption using monoethanolamine (MEA). This technology relies on an absorption column, where CO2 contained in the flue gas is selectively dissolved in the MEA solution, leaving an almost CO2-free gas stream at the top of the column. The CO2-rich MEA stream enters the desorption column in which the MEA solvent is regenerated through a temperature increase, while the captured CO2 is retrieved at the top prior to compression. Energy requirements and investment costs for CC (90% capture efficiency) and subsequent CO2 compression are retrieved from Kim and Léonard (2025). Details can be found in the Supplementary Material Section S3.
Finally, although batch coffee roasting is typically implemented, continuous roasters offer significant energy savings, decreasing heat demand from 1.84 MJ/kgGCB to approximately 0.5 MJ/kgGCB (Ladha-Sabur et al., 2019).
The 12 resulting configurations for IC production are listed in Table 2. The afterburner operates using the same heating method as the main process, except in the ‘BM’ and ‘BM/NG’ configurations for which, respectively, biomethane and natural gas combustion is implemented. Heat requirements for CC are fulfilled by biomethane combustion, except for ‘NG-CC’ where natural gas is used. Batch roasting is assumed for all configurations, except for ‘Eff’, which implements continuous roasting.
Table 2
Proposed configurations for the decarbonization of instant coffee production.
| ABBREVIATION | CONFIGURATION DETAILS |
|---|---|
| NG | Natural gas combustion |
| NG-CC | Natural gas combustion with CC |
| BioCH4 | Biomethane combustion |
| BioCH4-CC | Biomethane combustion with CC |
| EL | Electrically-powered heat supply |
| Green H2 | Green hydrogen combustion |
| Grey H2 | Grey hydrogen combustion |
| BM | 100% biomass substitution: process waste + wooda |
| BM-CC | 100% biomass substitution with CCa |
| BM/NG | Partial biomass substitution: process waste + natural gasb |
| BM/NG-CC | Partial biomass substitution with CCb |
| Eff | Energy demand reduction through continuous roasting (natural gas combustion) |
[i] a Biomethane is used in the afterburner.
b Natural gas is used in the afterburner.
Key performance indicators
In order to rank the decarbonization pathways for IC production, the configurations are compared based on various key performance indicators (KPIs). These include total energy demand, CO2 emissions, and specific cost.
The specific energy demand (SED, kWh/tIC) represents the total energy required for the production of one ton of IC. This KPI aggregates fuel and electricity requirements for easier comparison across different configurations. However, the exact share of each energy vector is clearly represented in all figures. The SED is calculated according to Equation (1).
Where Qu and Pu represent, respectively, the fuel and electricity requirements of unit u, and mIC represents the IC production.
Each production route is associated with direct emissions, arising from onsite fossil fuel combustion for heat supply. Direct CO2 emissions accounting considers no contributions for captured fossil CO2 and emitted biogenic CO2 (e.g., from biomass or biomethane combustion), whereas captured and stored biogenic CO2 is accounted as negative emissions. Hence, direct emissions are calculated according to Equation (2).
Where m ̇NCF,u represents fossil CO2 emitted by unit u and m ̇CB,u represents biogenic CO2 that has been captured by unit u and stored.
On the other hand, specific total CO2 emissions are estimated as the sum of direct and indirect emissions (Equation (3)). The latter account for additional emissions arising from fuel extraction, low-carbon fuel or electricity production, and procurement. Indirect emissions are calculated according to Equation (4).
Where ei,u represents the amount of commodity i (natural gas, biomethane, biomass, electricity, hydrogen) required by unit u and EFi denotes the corresponding emission factor (see Table 3).
Table 3
Emission factors of different energy commodities.
| COMMODITY | EMISSION FACTOR (KGCO2/KWH) |
|---|---|
| Natural gasa | 0.039 |
| Biomethaneb | 0.036 |
| Biomassc | 0.016 |
| Electricityd | 0.138 (2025)–0.057 (2050) |
| Hydrogene | 0.045 (green)–0.312 (grey) |
[i] a (ecoQuery, 2022b).
b (ecoQuery, 2022a).
c (ecoQuery, 2020).
d The value for 2025 is retrieved from Statista (2025), whereas the 2050 value is estimated using the methodology described in Supplementary Material Section S4.
e (IEA, 2023).
Finally, the specific total cost (STC, €/tIC) of the different production routes, encompassing both Capital Expenditure (CAPEX) and Operational Expenditure (OPEX) contributions, is introduced as in Salman et al. (2025). The metrics is used for a qualitative comparison, rather than serving as a quantitative cost forecast.
Considering a greenfield scenario, the specific CAPEX is calculated according to Equation (6). Reference values are scaled up to the desired production capacity and updated to 2024 values through the Chemical Engineering Plant Cost Index (CEPCI), before being annualized and normalized with respect to annual IC production. Details about the economic parameters can be found in the Supplementary Material Section S5.
Where CAPEX(uref) is the reference cost of the unit, i is the discount rate, n is the project lifetime, and and Su are, respectively, the reference and actual sizes of the unit.
On the other hand, the specific OPEX includes electricity, fuel, CO2 emission allowances, as well as CO2 transport and storage (T&S), as can be seen in Equation (7). It should be noted that, since the amount of required GCB is assumed identical for all configurations, the corresponding cost is excluded. Moreover, no free emission allowances, nor additional revenue when negative emissions are achieved, are taken into account.
where Ce, , and CT&S represent, respectively, the energy resources costs, the European Union Emissions Trading System (EU ETS) cost, and the CO2 T&S cost. Moreover, represents the energy demand of unit u, represents the direct emissions of unit u, m ̇CC represents the captured CO2 flow, and Δt represents the number of operating hours.
Energy and CO2 costs
In the context of the energy transition, it is essential to identify technologies that are economically competitive under current market conditions and remain viable in the long term. To this end, a scenario-based analysis is conducted under present and future energy price and CO2 cost assumptions to assess their impact on the cost-competitiveness and ranking of the decarbonization pathways.
Three different scenarios are explored: (i) Present scenario, considering current energy and CO2 costs in Belgium, (ii) Ideal scenario, representing the ideal incentive for industrial decarbonization, i.e., low energy prices combined with high CO2 emission cost, and (iii) Competition scenario, assuming high CO2 costs combined with favorable electricity prices and increased bioenergy costs, reflecting the competition for bio-based energy vectors (Material Economics, 2021). The scenario-specific costs can be found in Table 4. In the Present scenario, the electricity emission factor is based on 2025 data. By contrast, the Ideal and the Competition scenarios adopt 2050 projections for the electricity grid (see Table 3), reflecting potential future economic and technical conditions.
Table 4
Commodities costs adopted for different scenarios.
| COSTS | PRESENT | IDEAL | COMPETITION |
|---|---|---|---|
| Electricity (€/MWh) | 194a | 95b | 111b |
| Hydrogen (€/MWh) | 269c | 100d | 135d |
| Natural gas (€/MWh) | 50e | 55 | 55 |
| Biomethane (€/MWh) | 84f | 54f | 120 |
| Biomass (€/MWh) | 31g | 20d | 80d |
| CO2 emission (€/t) | 75h | 200d | 200d |
| CO2 T&S (€/t)i | 50 | 50 | 50 |
[i] a (Eurostat, 2025a).
b (Elia, 2024).
c (European Hydrogen Observatory, 2025).
d (EnergyVille, 2025).
e (Eurostat, 2025b).
f (BIP Europe, 2023).
g (Argus, 2026).
As can be seen in Table 4, high green hydrogen prices, reflecting current levels, are assumed in the Present scenario, while the lowest and conservative 2050 estimates by EnergyVille are adopted for the Ideal and Competition scenarios, respectively. Moreover, relatively stable natural gas prices are assumed, with a slight increase in the Ideal and Competition scenarios to reflect incentives for phasing out fossil fuels. Biomethane prices are based on current values for the Present scenario, while the lowest estimate is adopted in the Ideal scenario (BIP Europe, 2023). On the other hand, the Competition scenario assumes a sharp biomethane cost increase reflecting future competition for bio-based resources (Material Economics, 2021). Finally, biomass prices are based on Argus (2026) in the Present scenario, and on 2050 estimates for local and imported biomass in Ideal and Competition scenarios, respectively (EnergyVille, 2025).
An economic assessment is further performed across Europe using current energy prices to rank the decarbonization pathways and determine whether similar trends emerge across different countries. The energy commodities prices for each country are reported in the Supplementary Material Section S6, while the corresponding price variation ranges are reported in Table 5.
Results
In this section, a comprehensive comparison of multiple IC production configurations is performed from technical, environmental, and economic perspectives. A ranking of the most suitable production routes is established for different pricing scenarios, while an economic assessment across Europe aims to identify geographically-specific trends in the ranking of CO2 emissions mitigation strategies.
Specific energy demand and CO2 emissions accounting
Figure 3 shows the energy demand breakdown by energy vector and process (coffee production vs. CC) for all production configurations. The contributions of direct and indirect emissions are depicted in Figure 4.
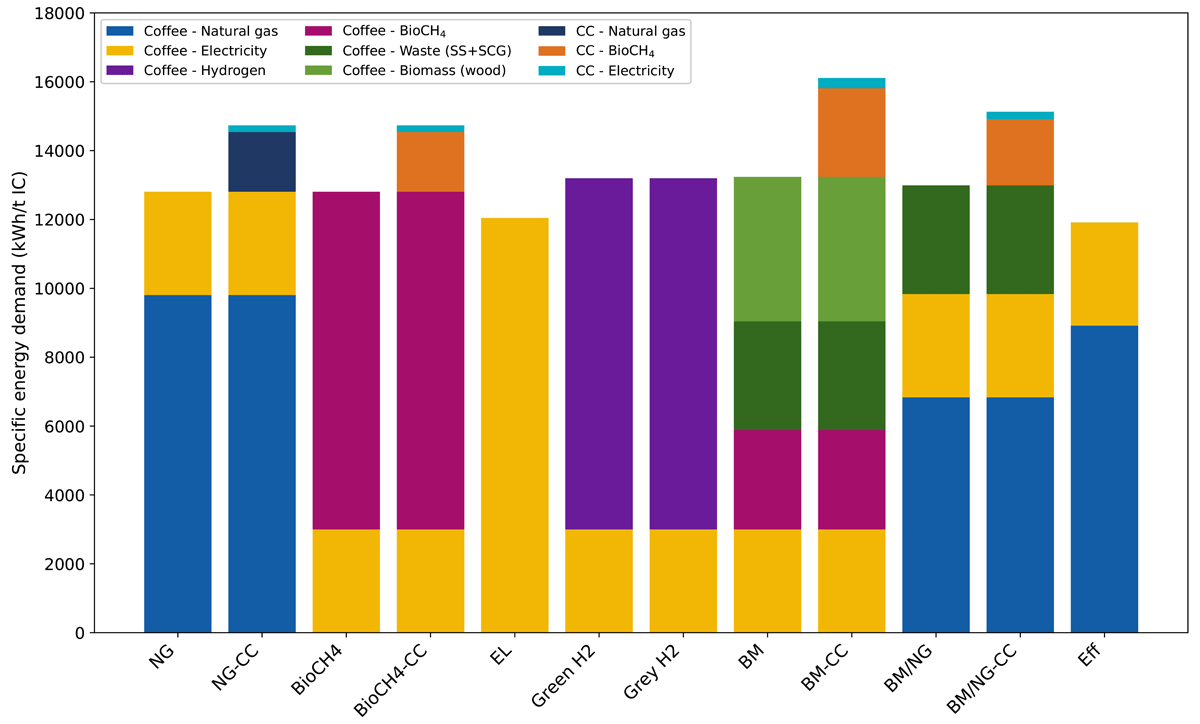
Figure 3
Specific energy demand for different instant coffee production routes.
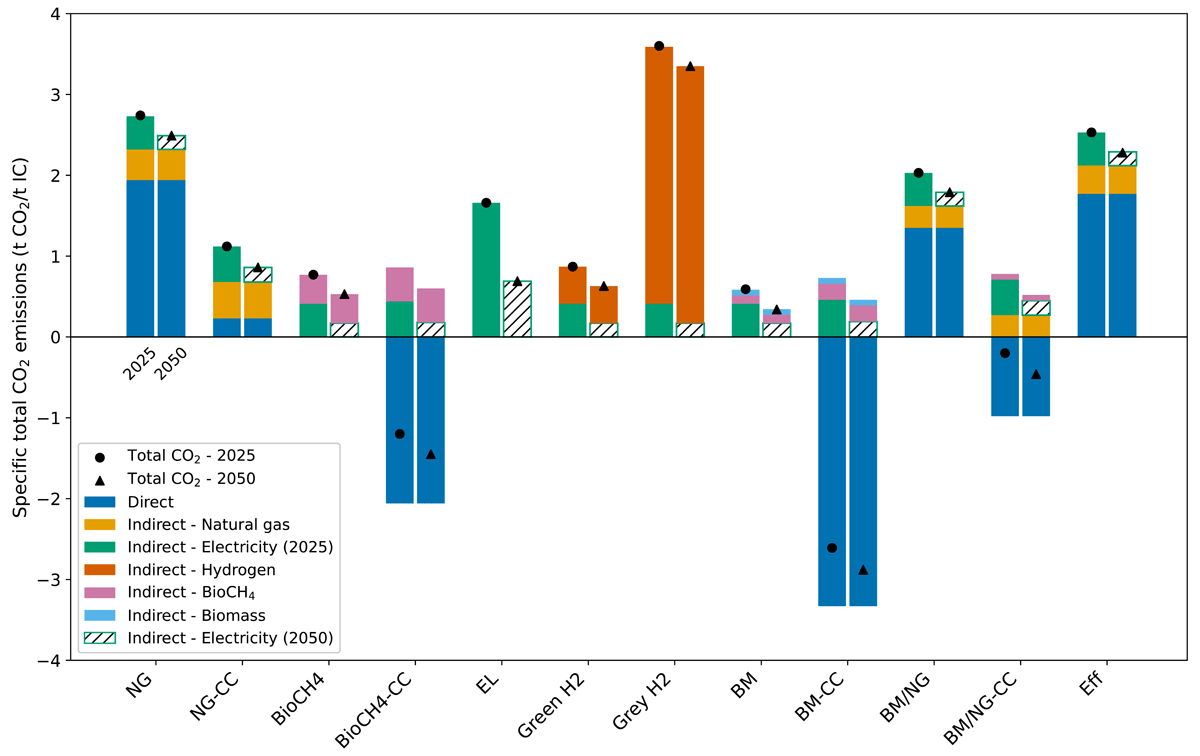
Figure 4
Specific total CO2 emissions breakdown for different instant coffee production routes in the 2025 (left) and 2050 (right) scenarios.
In the base case, implementing natural gas combustion (‘NG’), the SED amounts to 12,806 kWh/tIC. The main contribution (9,806 kWhNG/tIC) comes from natural gas combustion to fulfill heat requirements for roasting, brewing, and concentration steps. The remaining 3,000 kWhe/tIC correspond to the electricity demand associated with freeze-drying. The corresponding direct emissions amount to 1.9 tCO2/tIC. Depending on the carbon intensity of electricity, total emissions in the 2025 and 2050 scenarios exceed, respectively, 2.7 and 2.5 tCO2/tIC.
Natural gas substitution with biomethane (‘BioCH4’) can easily decrease total emissions by 72–79%, without technical modifications. Direct emissions are null since biomethane combustion emits biogenic CO2, whereas biomethane and electricity production and procurement represent 0.77 tCO2/tIC considering current emission factors. The latter drops to 0.53 tCO2/tIC when a decarbonized electricity grid mix (2050) is considered.
Although the ‘EL’ configuration reduces SED by 6% compared with the base case (owing to its higher efficiency: 95% for ‘EL’ vs. 85% for ‘NG’) and completely avoids direct emissions, total CO2 emissions are cut by only 39% when the emission factor of the current Belgian electricity mix is considered. Drastic emissions reduction up to 72% compared with ‘NG’ can be achieved with decarbonized electricity.
Hydrogen-based options exhibit a slightly increased energy demand: +3% relative to the base case, due to lower efficiency (85% for ‘NG’ vs. 80% for ‘H2’). Comparing ‘Green H2’ and ‘Grey H2’, it is clear that the origin of hydrogen is crucial for effective CO2 emissions mitigation. Indeed, the ‘Grey H2’ configuration—where hydrogen produced via steam methane reforming is combusted—results in a higher carbon footprint than the base case. CO2 emissions up to 3.60 tCO2/tIC are observed for ‘Grey H2’, representing an increase of over 31% compared with the ‘NG’ case, despite eliminating direct emissions. By contrast, using electrolytic hydrogen produced from wind-based electricity (‘Green H2’) lowers total emissions to 0.63–0.87 tCO2/tIC, representing a 68–75% reduction relative to the ‘NG’ baseline.
The coffee industry generates a large amount of biomass waste: approximately 1.56 tSCG/tIC and 18 kgSS/tIC. This process waste can be repurposed for heat supply. However, the amount of SCG and SS generated is insufficient to fully meet the process heat demand. If the remaining heat demand is supplied by natural gas combustion, CO2 emissions are reduced by 26–28% compared with ‘NG’. When heat is supplied by a combination of process waste and solid biomass (e.g., wood) combustion, emissions are reduced by 79–86%, despite a slightly higher energy demand (+3% relative to the base case).
CO2 emissions can be further decreased by implementing CC, at the expense of increased fuel and electricity demand for solvent regeneration and CO2 compression. The implementation of CC in natural gas-fired facilities results in a 59–66% decrease in total emissions, depending on the CO2 intensity of electricity. Net negative emissions (between 0.20 and 2.61 tCO2/tIC in the 2025 scenario and between 0.46 and 2.88 tCO2/tIC in the 2050 scenario) can be achieved by combining CC with bioenergy, at the expense of an energy penalty ranging from 15% (‘BioCH4-CC’) to 26% (‘BM-CC’) relative to the base case. These low emissions are attributable to the capture of CO2 released during the combustion of biogenic fuels.
Finally, the impact of energy efficiency improvement is evaluated through the ‘Eff’ configuration. As roasting represents only 12% of the total heat demand, implementing continuous roasting reduces overall fuel demand by 9%. Consequently, direct CO2 emissions decrease from 1.94 to 1.77 tCO2/tIC, while lower natural gas consumption also reduces indirect emissions (0.52–0.76 tCO2/tIC), resulting in total emissions reduction of 8% compared with ‘NG’.
Scenario-based analysis
This section presents, for different scenarios, a comparison of the economic performance of energy transition pathways for the IC industry. Three different scenarios are explored:
Present: current energy and CO2 emission allowance costs are considered;
Ideal: reduced energy prices are combined with high CO2 emission costs;
Competition: high CO2 emission cost is combined with favorable electricity prices and high bioenergy costs.
The economic assessment of the various decarbonization pathways in the Present, Ideal, and Competition scenarios are presented in Figure 5a, 5b, and 5c, respectively.
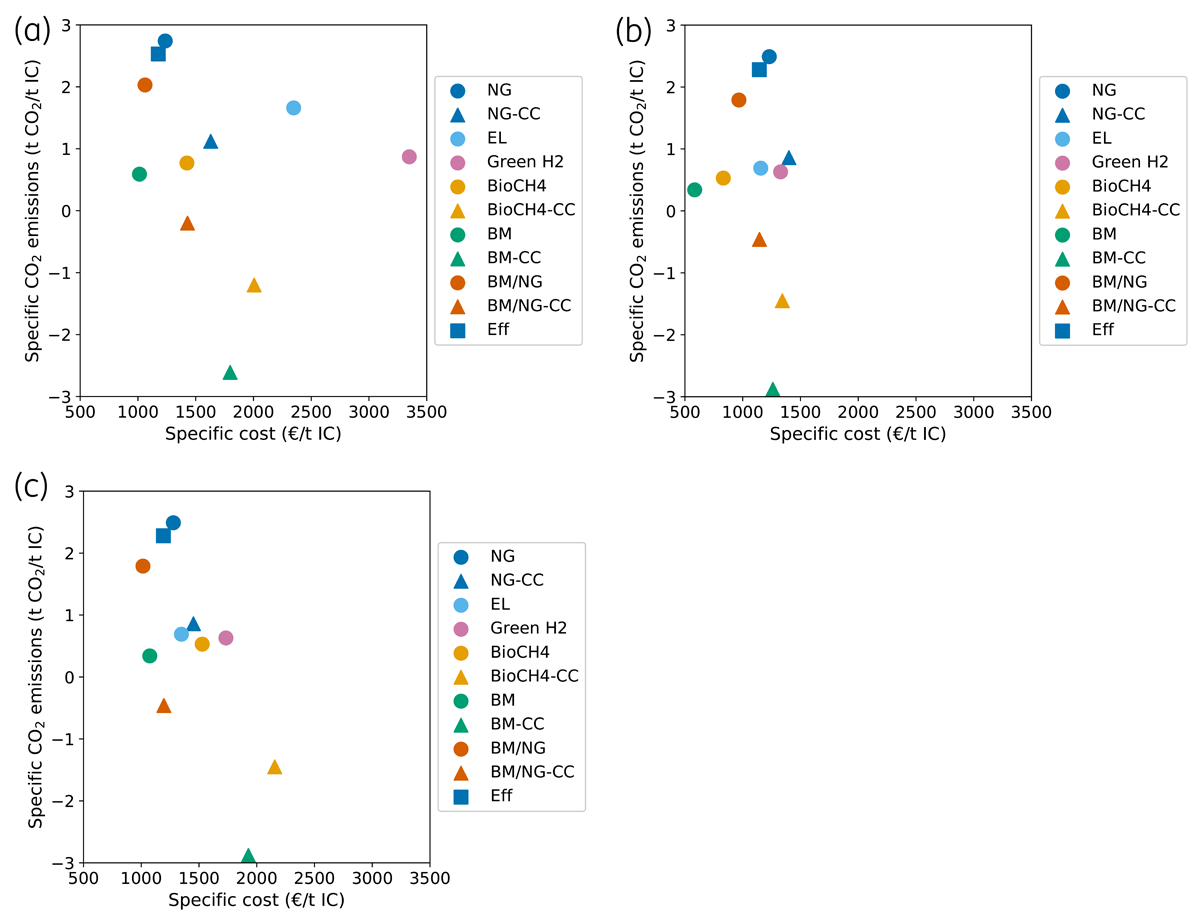
Figure 5
Specific total cost vs. specific total CO2 emissions for each production configuration in the (a) Present, (b) Ideal, and (c) Competition scenarios.
Figure 5a shows that, under the Present scenario, the lowest STCs are achieved through biomass use, either via complete substitution (‘BM’) or the combined use of process waste—SS and SCG—and natural gas (‘BM/NG’). The ‘BM’ and ‘BM/NG’ configurations are associated with STCs of, respectively, €1,013/tIC and €1,061/tIC. These values correspond to a reduction of 14–18% compared with ‘NG’ (€1,236/tIC). These biomass-based options are closely followed by ‘Eff’ (€1,176/tIC), ‘NG’, and ‘BioCH4’, the latter being associated with 15% higher costs than the base case. After fuel switching, CC implementation is the most interesting emission mitigation solution. Despite the increased energy demand (+15–26% compared with ‘NG’), the associated cost penalty lies between 16–62%, corresponding to a STC of €1,429–2,006/tIC. Moreover, high electricity prices (€194/MWhe vs. €50/MWhNG) are detrimental for process electrification. Indeed, the STC in the ‘EL’ configuration (€2,348/tIC) is almost twice that of the ‘NG’ case. Finally, ‘Green H2’ is the most expensive decarbonization pathway with a STC reaching €3,349/tIC, i.e., nearly three times that of ‘NG’, owing to a green hydrogen price of €269/MWhH2.
In the Ideal scenario (Figure 5b), bio-based routes are the most cost-effective emission mitigation measures. Access to cheap bioenergy combined with elevated CO2 emission allowance cost results in bio-based configurations being between 7% (‘BM/NG-CC’) and 53% (‘BM’) cheaper than the base case. The ‘Eff’ configuration reduces total CO2 emissions by approximately 8% and STC by 7% compared with the base case (€1,230/tIC). Reduced electricity prices (€95/MWhe) lead to ‘EL’ closely following bio-based configurations. Besides reducing total emissions by 72%, the corresponding STC (€1,156/tIC) is 6% lower than that of ‘NG’. A reduction of more than 60% in hydrogen price compared with current levels (from €269/MWhH2 in the Present scenario to €100/MWhH2 in the Ideal scenario) renders the ‘H2’ configuration only 8% more expensive than ‘NG’, while decreasing total emissions by 75%. More interestingly, combining cheap energy and high CO2 ETS price favors fuel switching and electrification measures over CC implementation. Indeed, with the exception of ‘BM/NG-CC’, CC-based options are more expensive than other alternative production pathways, exhibiting STCs that are 2–14% higher than the one observed for ‘NG’.
Finally, in the Competition scenario (Figure 5c), ‘BM/NG’ is the most cost-effective IC production pathway (€1,015/tIC, i.e., 21% reduction compared with ‘NG’), closely followed by ‘BM’ (16% lower STC). Due to high CO2 costs and expensive bio-based energy vectors, the ‘BM/NG-CC’ configuration enables effective CO2 emission mitigation at a reasonable cost. This production route achieves a carbon footprint of –0.46 tCO2/tIC at a STC of €1,196/tIC, which is 6% lower than that of the ‘NG’ configuration. This observation highlights once again the economic and environmental benefits of process waste valorization in the coffee industry. The ‘Eff’ configuration achieves similar economic performance but emits 2.7 tCO2/tIC more than ‘BM/NG-CC’. With electricity prices being approximately twice the price of natural gas (€111/MWhe vs. €55/MWhNG), ‘EL’ remains 5% more expensive than ‘NG’, despite reducing total emissions by 72%. Finally, hydrogen ranks among the most expensive production routes, while high biomethane prices (€120/MWh) render BECCS configurations the least cost-effective decarbonization options for the IC industry (STCs of €1,928–2,156/tIC, i.e., 51–69% higher than that of ‘NG’).
Economic assessment across Europe
To determine whether geographically-specific trends in the prioritization of decarbonization pathways exist within the IC industry, an economic assessment is performed across Europe. For each country, the STC of the different fuel switching, electrification, and CO2 capture options are depicted, respectively, in Figures 6, 7, and 8. These values are also reported in the Supplementary Material (Table S6).
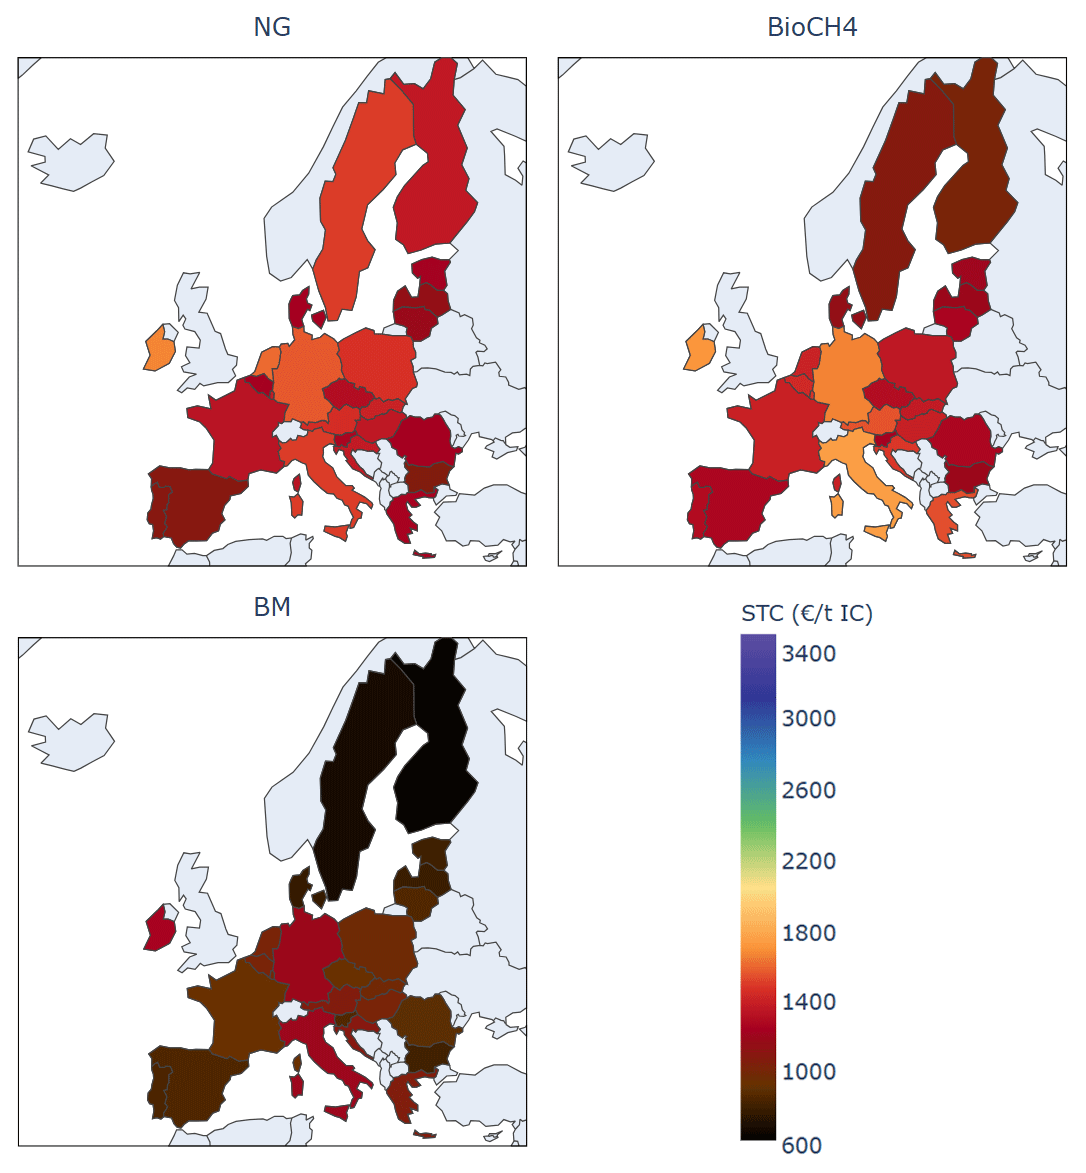
Figure 6
Fuel switching (‘NG’, ‘BioCH4’, ‘BM’) – specific total cost across Europe (2025).
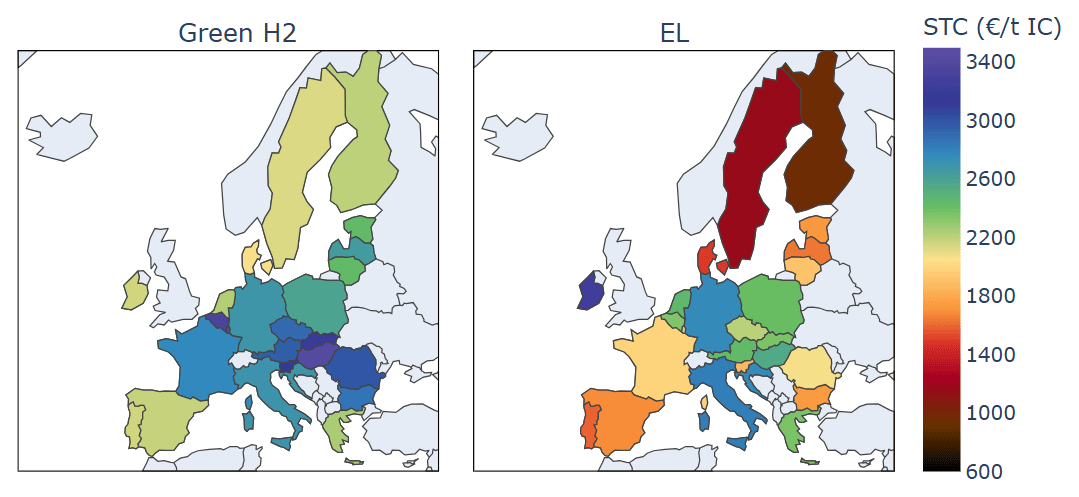
Figure 7
Indirect (‘Green H2’) and direct electrification (‘EL’) – specific total cost across Europe (2025).
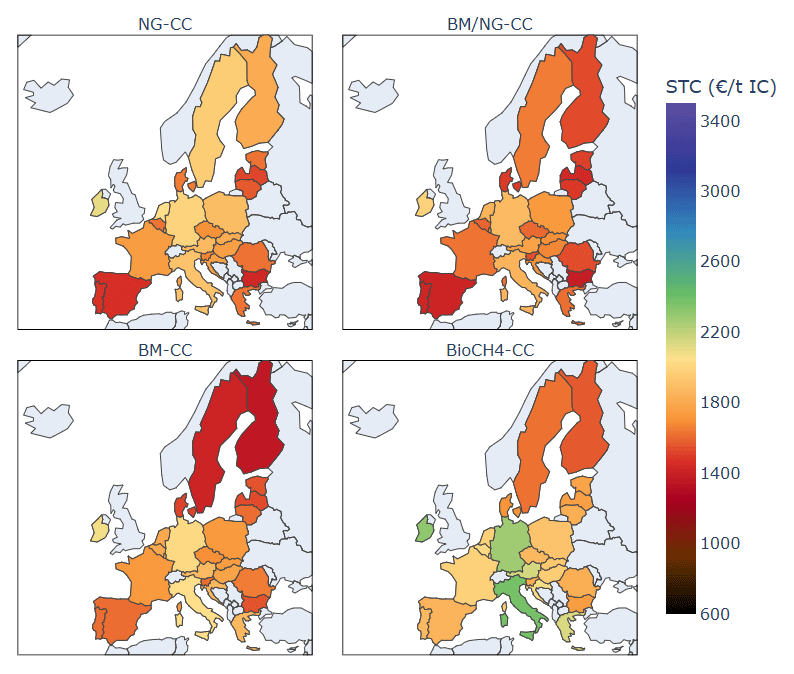
Figure 8
CO2 capture (‘NG-CC’, ‘BM/NG-CC’, ‘BM-CC’, ‘BioCH4-CC’) – specific total cost across Europe (2025).
According to Figure 6, replacing natural gas with biomass (‘BM’) consistently yields the lowest STC among all fuel-switching options across the European countries considered. It is also the most cost-effective decarbonization strategy across all configurations. Biomethane remains economically attractive in Nordic countries (e.g., Sweden, Finland, Denmark), the Netherlands, and Poland, with STCs 7–29% lower than for ‘NG’. On the contrary, ‘NG’ is economically preferred in Southern Europe (e.g., Portugal, Spain, Italy, Greece, Bulgaria) owing to lower fossil fuel prices in these countries.
Figure 7 shows that indirect process electrification (‘Green H2’) leads to prohibitively high costs across Europe (over €2,064/tIC up to €3,440/tIC), making it an unviable option for low-to-medium temperature heat applications under current market conditions. Similarly, direct electrification (‘EL’) is a more expensive decarbonization strategy than fuel switching and exhibits strong regional disparities. In Central Europe (e.g., Austria, Germany, Poland, Hungary), as well as in Italy, Croatia, and the Netherlands, ‘EL’ appears as economically challenging—with STCs exceeding €2,400/tIC, i.e., 53–102% higher than for ‘NG’—and should thus be avoided under current electricity prices to maintain economic competitiveness. In contrast, Nordic countries (Sweden, Finland, Denmark) benefit from favorable electricity prices, leading to STCs of €963–1,493/tIC. These represent economic benefits of 22–29% over ‘NG’ for Sweden and Finland. Moderate STCs (€1,589–1,987/tIC, 40–63% more expensive than ‘NG’) for electrified IC production are also observed in Portugal, Spain, France, Slovenia, and Baltic countries (Estonia, Latvia, Lithuania). These economic trends are also consistent with the environmental context. As shown in Figure 9, the most CO2-intensive electricity grids are mainly located in Central Europe (>250–594 gCO2/kWh), whereas Nordic electricity mixes are largely decarbonized (<76 gCO2/kWh).
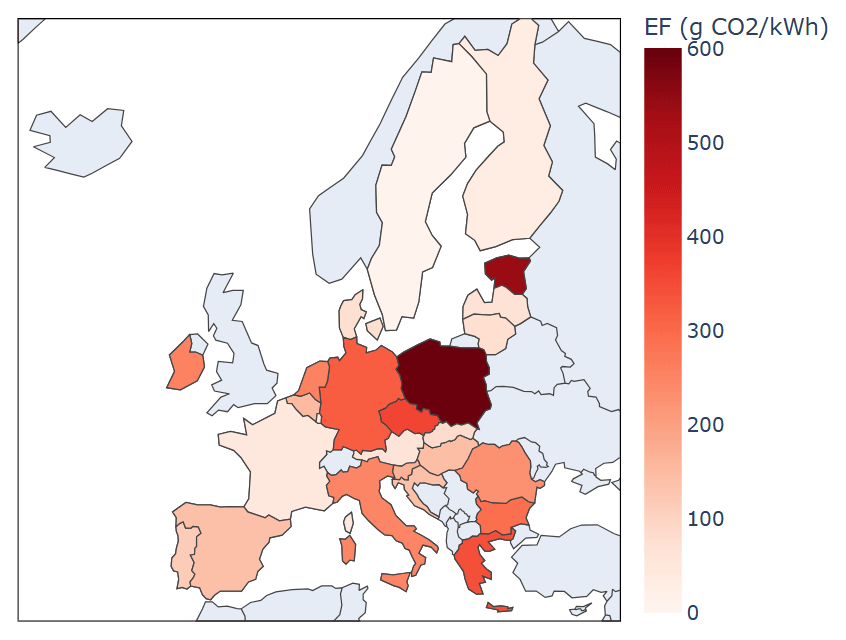
Figure 9
Emission factor of European electricity grids in 2023 (based on EEA (2025)).
Finally, the STC of CC implementation is depicted in Figure 8. Currently, CC-based configurations are generally more expensive than fuel switching, although they can, in some cases, lead to lower costs than process electrification. This is particularly the case in Central Europe, Italy, and Croatia. Among CC-based options, ‘BM/NG-CC’ usually emerges as the least-cost alternative, highlighting the importance of waste valorization within the coffee industry. From an economic perspective, Nordic countries tend to favor full biomass substitution. In methane-based pathways, as also observed for non-CC cases, ‘BioCH4-CC’ presents economic advantage over natural gas in Northern Europe. In contrast, Southern European countries continue to favor ‘NG-CC’ from a cost-minimization perspective, owing to lower fossil fuel costs.
Challenges for the energy transition
This study provides a comparative assessment of energy transition pathways for the IC industry, including fuel switching, electrification, CCS, BECCS, and energy efficiency. Each option faces key challenges, notably cost-competitiveness of alternative energy vectors, adequate ETS incentives, and limited availability of sustainable biomass and low-carbon electricity.
The scenario-based analysis showed that the competitiveness of decarbonization pathways is strongly influenced by energy prices and CO2 allowance costs. Lower energy prices and higher ETS costs improve the economic attractiveness of low-carbon technologies. However, low-carbon energy remains usually more expensive than natural gas. For instance, biomethane, electricity, and electrolytic hydrogen cost approximately 1.7–3.9 times more than natural gas. Moreover, current CO2 ETS prices (€63–88/tCO2 in 2025 (Trading Economics, 2026)) remain too low to provide a sufficient incentive for phasing out natural gas.
CO2 accounting also highlighted the importance of green hydrogen for indirect process electrification, as grey hydrogen results in a higher carbon footprint than the base case: 3.4–3.6 tCO2/tIC for ‘Grey H2’ vs. 2.5–2.7 tCO2/tIC for ‘NG’. However, global hydrogen production relies almost entirely on unabated fossil-based processes, with low-emissions production routes, such as electrolysis and fossil fuels combined with CCUS, accounting for less than 1% in 2025 (IEA, 2026).
Beyond environmental concerns, the hydrogen-based configuration is economically challenging, ranking among the most expensive decarbonization routes for the IC industry. This can be explained by the comparatively high global production costs of electrolytic hydrogen: €26–118/MWhH2 for fossil-based hydrogen vs. €92–395/MWhH2 with electrolysis1 (IEA, 2026). Economic competitiveness of the ‘Green H2’ configuration requires reduced electrolyzer CAPEX—currently amounting to €1,665–2,190/kW outside of China (IEA, 2026)—favorable electricity prices, or access to low-cost green hydrogen imported from renewable hubs; otherwise, hydrogen use for low-to-medium temperature applications seems unlikely.
Bioenergy emerged as one of the most attractive CO2 emission mitigation strategies, driven by low costs and its potential for net-negative emissions when combined with CC. However, large-scale deployment is constrained by limited feedstock availability. Future biomass demand in Europe is expected to exceed availability by 40–140% (Material Economics, 2021), highlighting the need for careful resource allocation. In Belgium, approximately 13.89 TWh/y of biomass are available (Correa Laguna et al., 2023), while European biomethane production amounts to approximately 38 TWh (IEA, 2025). For a 5,000 tIC/y facility, full biomass substitution would require 21 GWh/y of biomass to fulfill heat requirements, representing 0.2% of the Belgian biomass availability. Similarly, biomethane demand would range between 10 and 58 GWhBioCH4/y depending on the configuration, corresponding to 0.03–0.2% of current European production. As other industries also rely on biomethane as an energy source, expanding biomethane production capacity will be essential to meet future demand, as envisaged by the REPowerEU Plan (IEA, 2025).
Beyond resource availability, the climate benefits of biomass are highly feedstock-dependent and cannot be assumed universally (Brack, Birdsey and Walker, 2021). Agricultural residues and short-rotation crops generally provide favorable carbon balances owing to their rapid regeneration and limited impacts on land-use change (IRENA, 2014). In contrast, the benefits of woody biomass are more complex, as its climate performance depends on factors such as feedstock origin, forest management practices, changes in forest carbon stocks, and carbon payback period, i.e., the time required for carbon sequestration through biomass regrowth to offset the emissions associated with biomass harvesting and use (Brack, Birdsey and Walker, 2021). Although the use of forest residues can increase CO2 emissions, sustainable forest management practices, including thinning and residue removal at appropriate rates, may accelerate forest growth, reduce wildfire risk, and support long-term carbon sequestration (IRENA, 2014). Finally, replacing natural forests with plantations may reduce long-term forest carbon storage, since plantations are generally harvested more frequently and store less carbon than mature natural forests (Brack, Birdsey and Walker, 2021).
In addition to GHG emissions, expanding bioenergy production raises additional sustainability concerns, including increased water demand, soil degradation resulting from excessive extraction rates or fertilizer application, biodiversity loss associated with intensive biomass harvesting and land-use change, and competition with food production (IRENA, 2014).
Consequently, biomass should be regarded as a scarce and valuable resource whose use should be reserved for applications where it delivers the greatest decarbonization benefit. Since several industrial sectors rely on biomass for energy or as a feedstock (e.g., pulp and paper industry), its use must be prioritized in hard-to-electrify applications, such as hybrid solutions for high-temperature industrial heat (IRENA, 2014). Low-to-moderate temperature heat demand should instead be met through electrification whenever feasible.
Direct electrification can substantially reduce CO2 emissions, provided that electricity is supplied from a decarbonized grid. Using the projected 2050 European electricity mix (57 gCO2/kWhe), emissions are reduced by 72% compared with ‘NG’. France, Luxembourg, Finland, and Sweden already achieve better environmental performances owing to emission factors associated with their current electricity grids of, respectively, 48, 41, 33, and 8 gCO2/kWhe as can be seen in Figure 9. While the ‘EL’ configuration may appear as economically viable, adaptation of the electricity grid is required to meet the increased demand. For a 5,000 tIC/y facility, full electrification would increase electricity demand by 45.2 GWhe/y (+302% compared with ‘NG’), while large-scale CC implementation would add 1.0–1.5 GWhe/y (+6–10% compared with ‘NG’).
Limitations and perspectives
Although this study provides a systematic techno-economic comparison of decarbonization pathways for the IC industry, several limitations should be acknowledged. First, CAPEX is likely underestimated, as infrastructure modifications—e.g., electric grid capacity increase for large-scale electrification—were neglected.
Then, energy efficiency improvements were limited to the implementation of continuous roasting, which achieved moderate energy and emissions reductions. Future work should target energy savings during brewing, concentration, and drying (Ladha-Sabur et al., 2019). For example, waste heat recovery for hot water production or vapor absorption refrigeration (Mukherjee et al., 2020), as well as alternative drying technologies, such as spray-drying (Gosalvitr et al., 2023), have the potential to further reduce the energy demand and environmental impact of IC production. Combining such energy efficiency measures with fuel switching or electrification may enable deeper decarbonization than the pathways evaluated in this work.
Furthermore, the pathway ranking is scenario-dependent and therefore valid only for the energy and CO2 prices considered. Exploring a wider range of future market and policy scenarios would improve the robustness of the results.
Similarly, CO2 accounting is limited to 2025 and 2050, which are adopted as representative years for contextualizing the current and prospective decarbonized industrial landscapes, respectively. A more extensive temporal analysis should be considered in future work.
Finally, biomass combustion was assumed carbon neutral. Future assessments should incorporate life-cycle aspects through feedstock-specific carbon payback periods and changes in carbon stocks.
Despite these limitations, the methodological framework of this study provides a systematic approach for comparing alternative decarbonization pathways that is readily transferable to other industries. By integrating technical, environmental, and economic assessments, it enables a consistent evaluation of competing technologies, provides insights into infrastructure requirements, and identifies cost-effective decarbonization pathways.
Conclusion
This study evaluated the techno-economic and environmental performance of different decarbonization pathways in the European IC industry. No single decarbonization pathway is universally optimal across Europe, as the same technology can shift from being economically unattractive to highly competitive depending on market conditions, electricity carbon intensity, and biomass availability.
Among the investigated options, biomass consistently emerged as one of the most attractive alternatives due to its relatively low cost and potential for net-negative emissions when combined with CCS (between 0.2 and 2.88 tCO2/tIC). While solid biomass combustion was generally identified as the least-cost pathway across Europe, biomethane also proved economically competitive in regions with favorable energy markets, such as the Nordic countries and the Netherlands. However, limited availability of sustainable biomass renders it a scarce strategic resource, whose use should be prioritized for applications where it delivers the highest benefit, particularly for high-temperature heat production.
For low-to-medium temperature applications, electrification should be prioritized where economically feasible. For example, electrification is already environmentally and economically attractive in regions characterized by abundant low-carbon electricity, such as the Nordic countries, where it can simultaneously reduce emissions by more than 72% and lower costs by up to 29% compared with ‘NG’. Conversely, countries with carbon-intensive electricity mixes and high electricity prices, including parts of Central Europe, Italy, and the Netherlands, currently offer limited incentives for industrial electrification. Hence, it is crucial to accelerate the decarbonization and expansion of European electricity grids to enable widespread process electrification.
The IC industry’s waste streams represent an additional strategic opportunity, addressing simultaneously waste management, resource efficiency, and emissions reduction. Replacing part of the natural gas demand with SCG and SS reduced CO2 emissions by 26–28% relative to the ‘NG’ baseline. When combined with CCS, waste valorization delivers significant CO2 emissions reductions (107–118%) at a reasonable cost, particularly in regions with high electricity prices.
On the contrary, hydrogen showed limited potential as a near-term large-scale decarbonization option for the IC industry under the conditions considered. Although green hydrogen may substantially reduce CO2 emissions (68–75%), current hydrogen production remains almost entirely fossil-based. Moreover, ‘Green H2’ was consistently identified as the most expensive decarbonization pathway, owing to the high cost of electrolytic hydrogen limiting its competitiveness under current market conditions.
Finally, the investigated energy efficiency measure, i.e., continuous instead of batch roasting, provided only modest environmental and economic benefits, reducing fuel consumption and CO2 emissions by approximately 8%.
Overall, electrification should be prioritized where low-carbon electricity is available and economically competitive. Process waste should be valorized as a locally available energy source and, when coupled with CC, a potential source of negative emissions. Green hydrogen should be considered as a longer-term option, while bioenergy use should be limited due to increasing cross-sectoral competition for sustainable biomass. Finally, these measures should be complemented by energy efficiency improvements to achieve deeper decarbonization.
Supplementary material
The process integration and optimization framework, as well as the process descriptions and modeling details can be accessed in the Supplementary Material file. DOI: https://doi.org/10.66506/ed.52.s1
Notes
Acknowledgements
This paper is supported by the Belgian Fund for Scientific Research (FRS-FNRS) through a FRIA grant and the European Regional Development Fund (FEDER). The authors also acknowledge the IETS Task XXIV Process integration for industry decarbonization by International Energy Agency.