
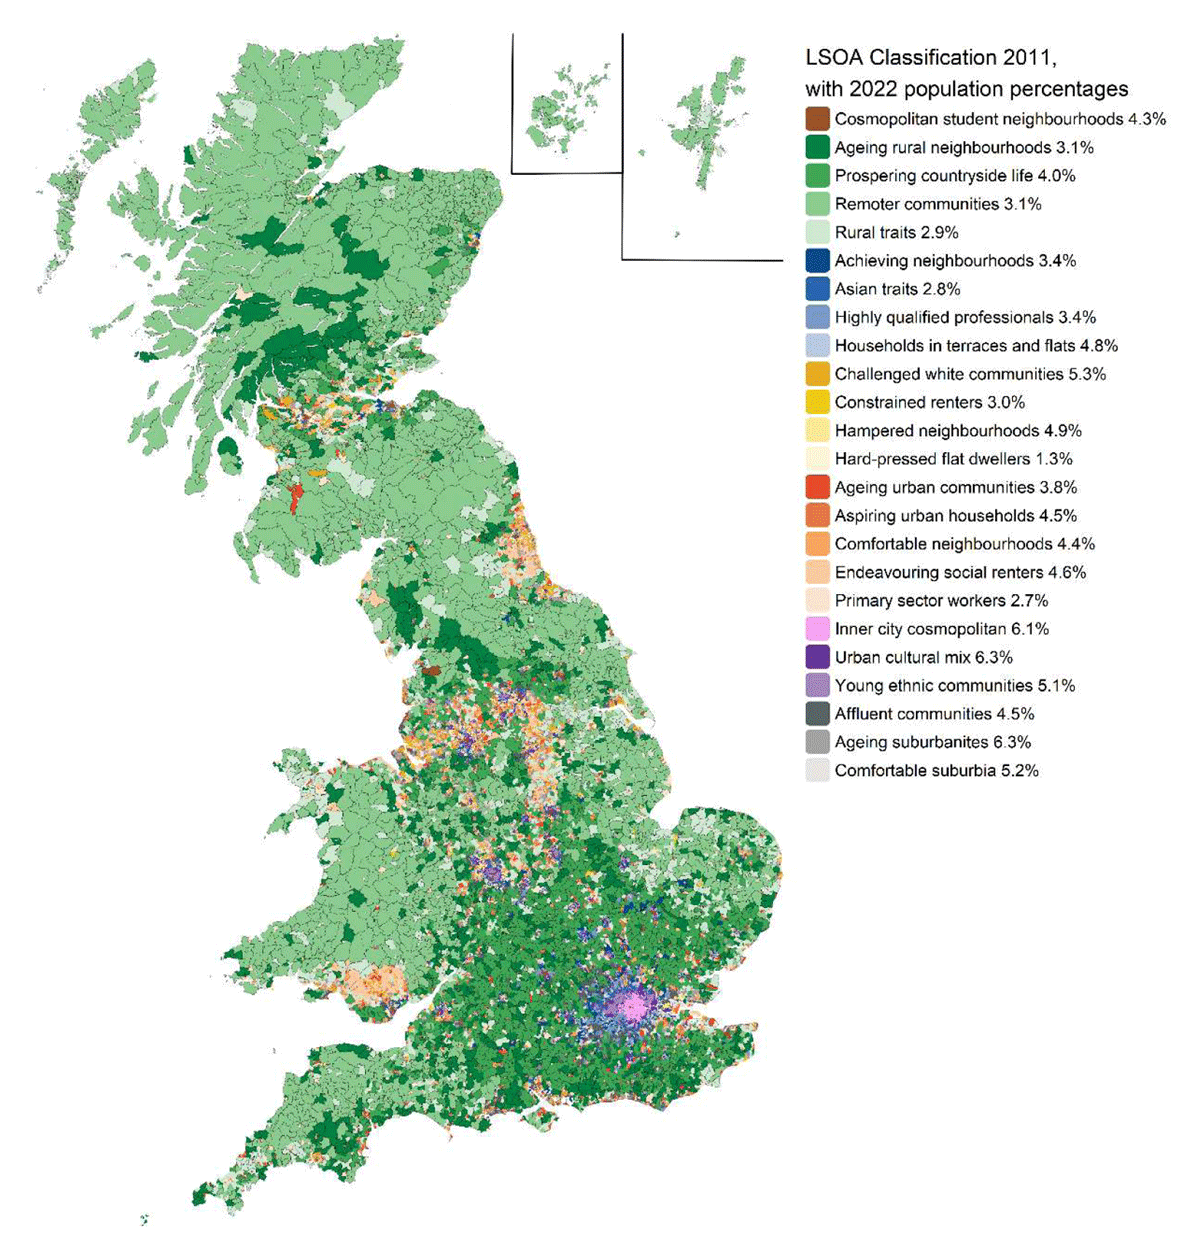
Figure 1
Map of 2011 LSOA area classifications adjusted to the 2021/22 boundaries used throughout this paper.
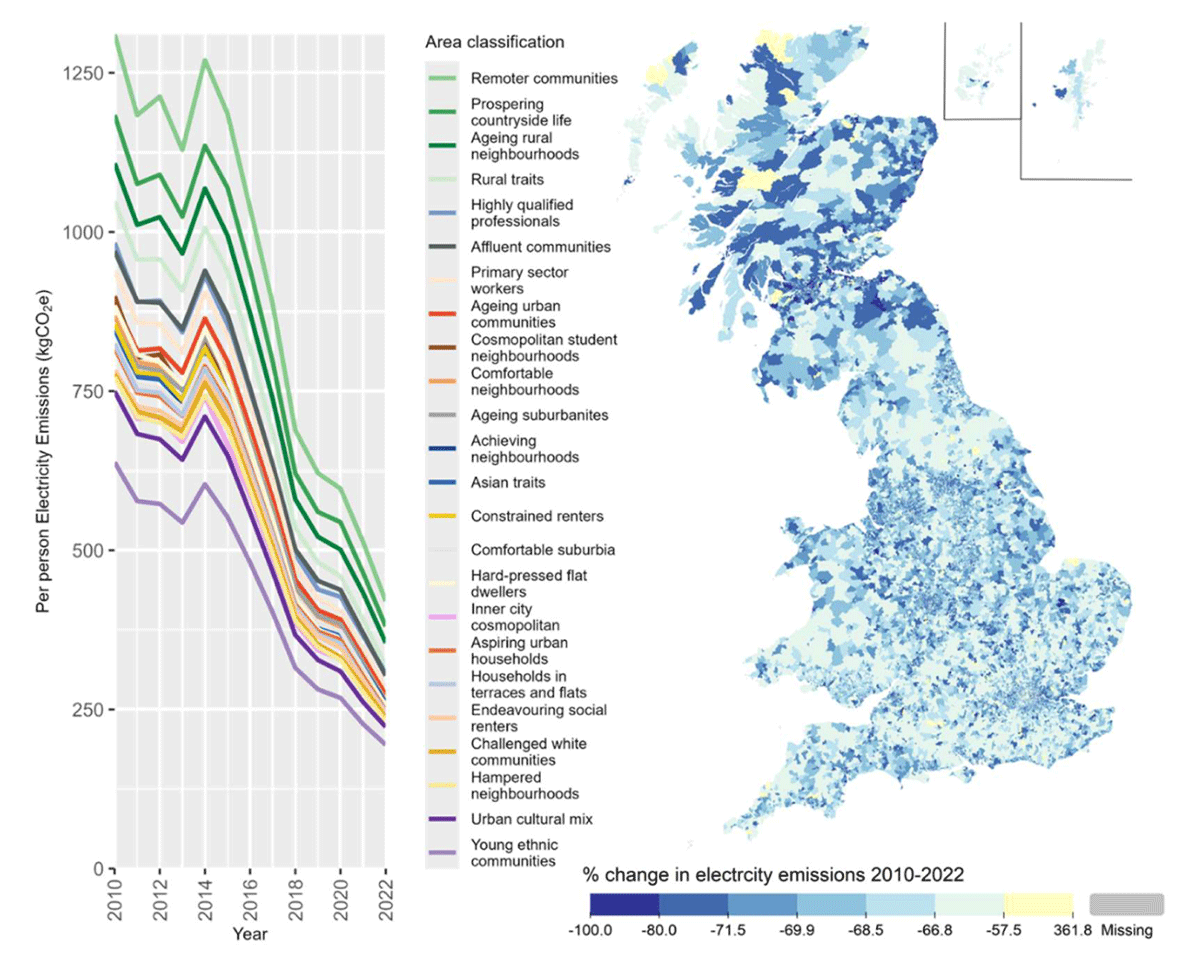
Figure 2
Median electricity emissions per person for different area classifications (left) and percentage change in LSOA emissions between 2010 and 2022 (right).
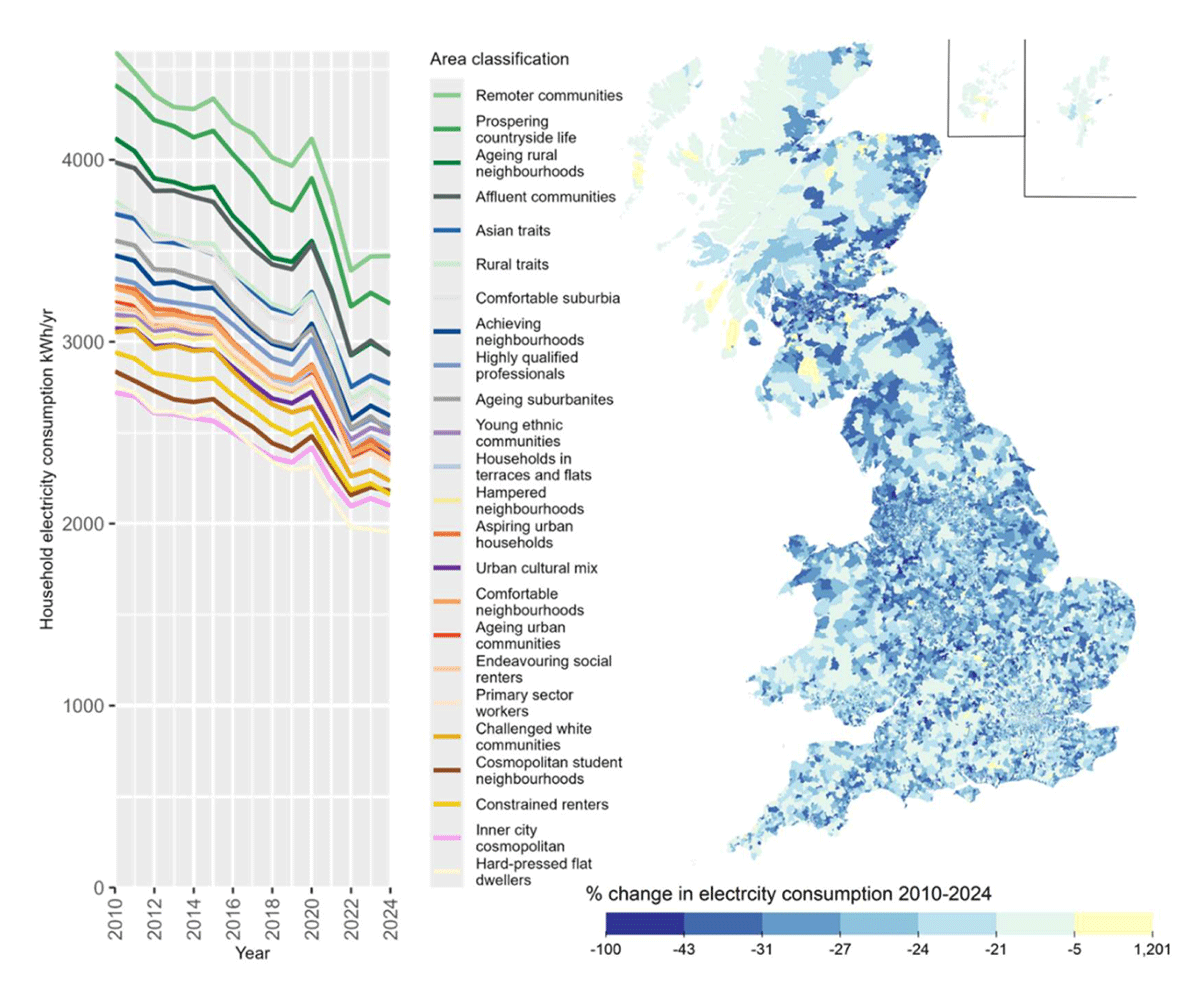
Figure 3
Median household electricity consumption per year for different area classifications (left) and percentage change in LSOA electricity consumption between 2010 and 2024 (right).
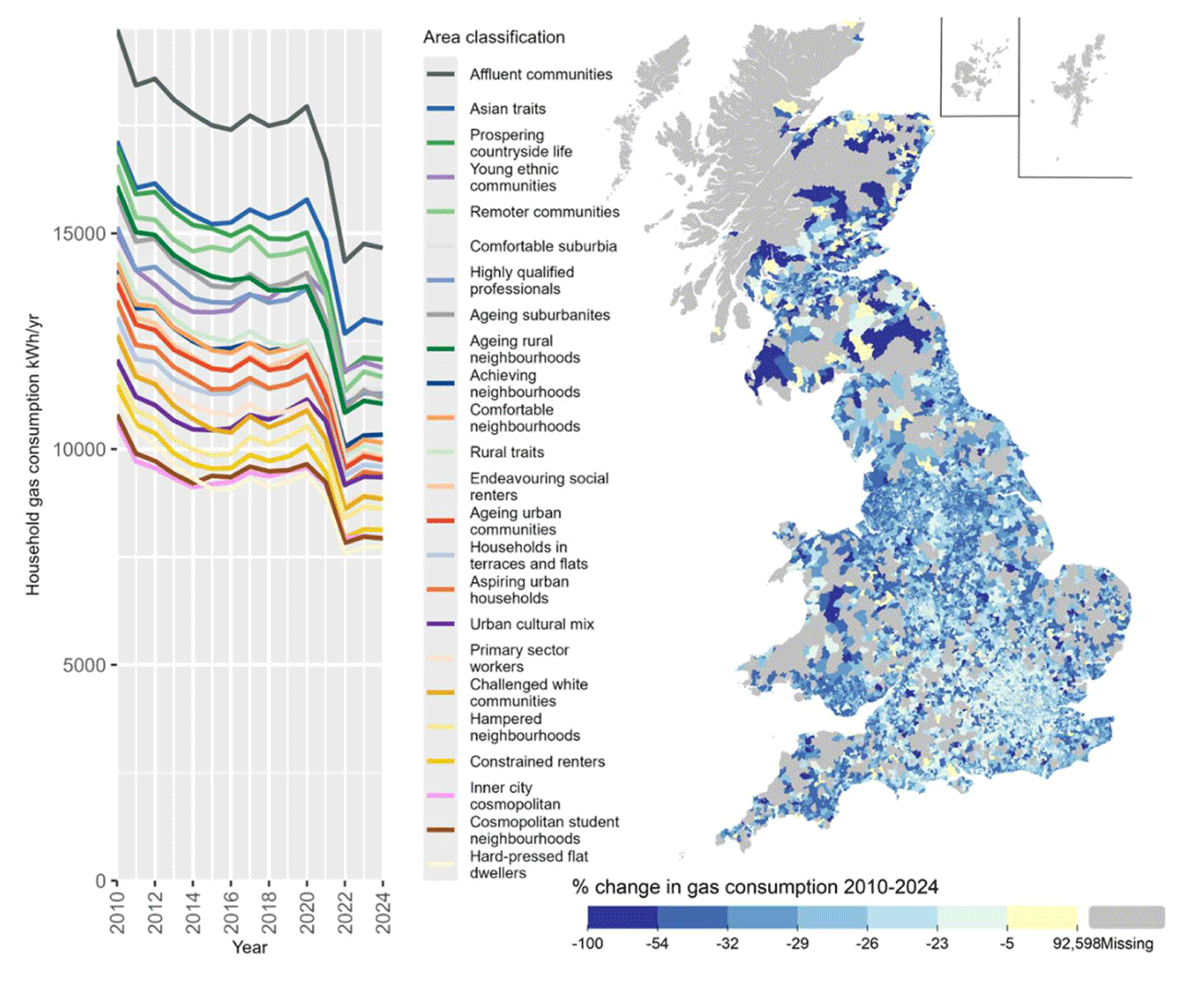
Figure 4
Median per household gas consumption for different area classifications (left) and percentage change in LSOA gas consumption between 2010 and 2024 (right). Note that areas of the map in grey are off the gas grid and so have no data.
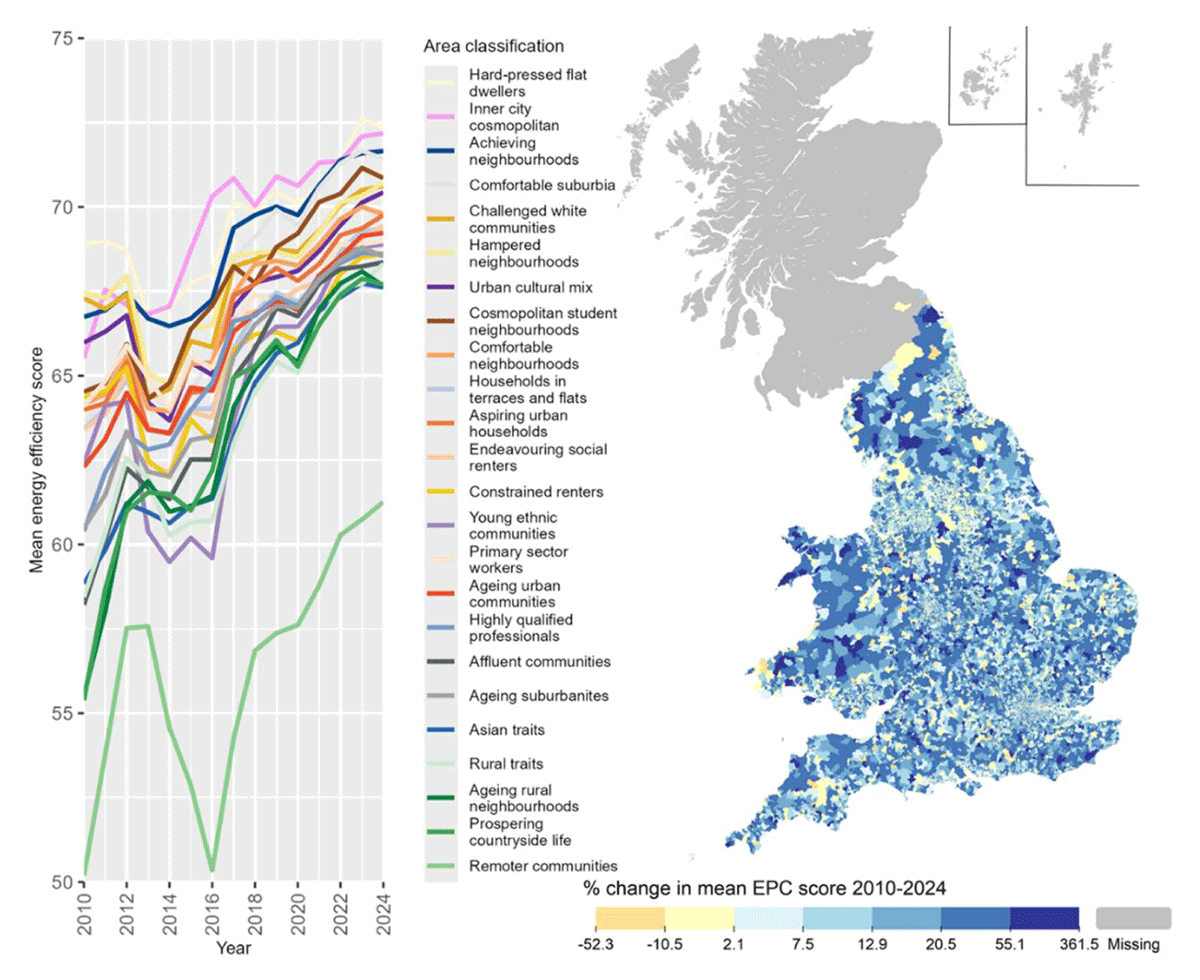
Figure 5
Average SAP energy efficiency rating out of 100 (higher means more efficient) of domestic buildings assessed per year in different area classifications (left) and percentage change in the LSOA average energy efficiency score from 2010 to 2024 (right). Note that historic EPC data is unavailable in Scotland before 2018 and therefore has been excluded from this map.
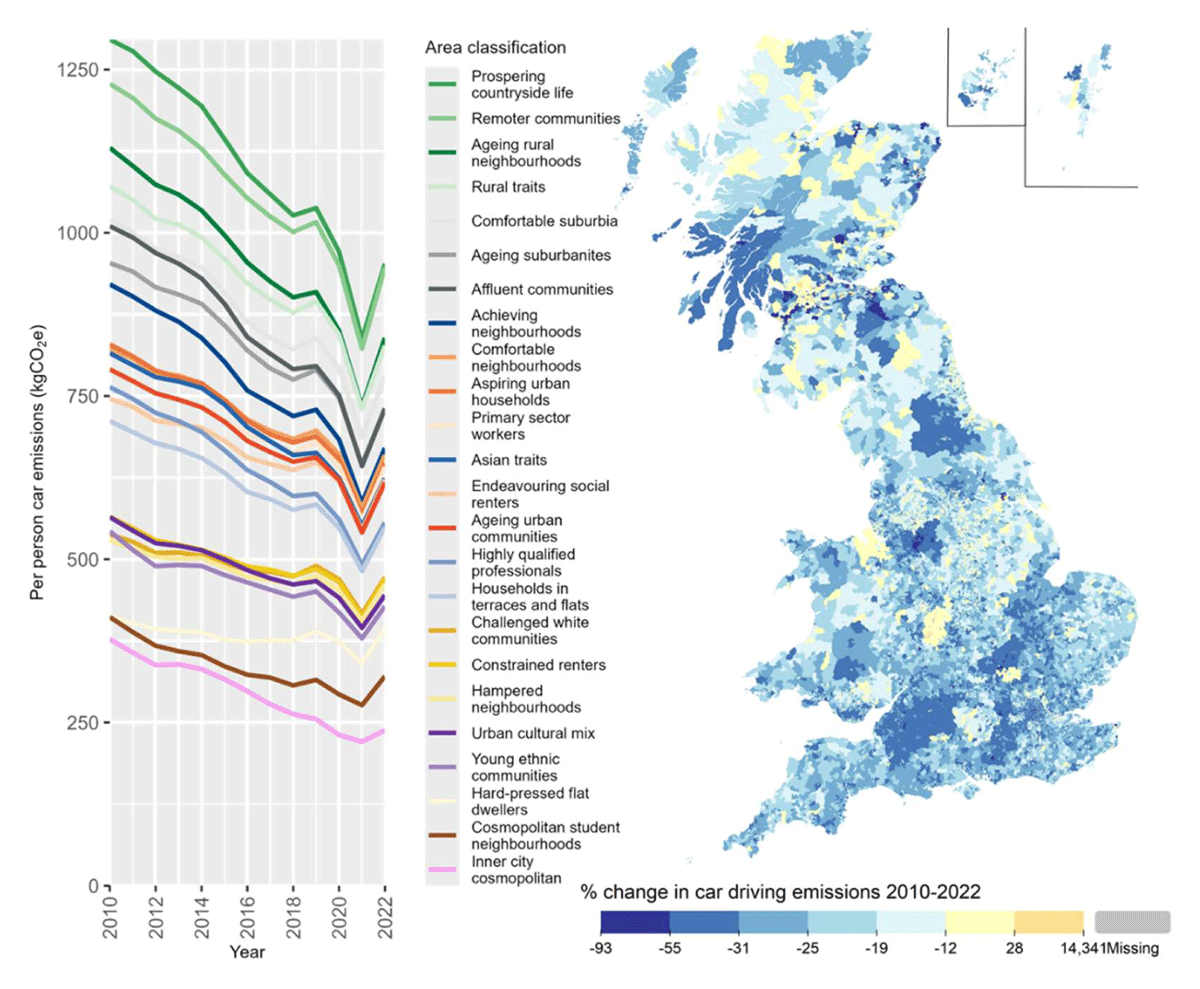
Figure 6
Per person car driving emissions from private cars year in different area classifications (left) and percentage change in the LSOA emissions from 2010 to 2022 (right).
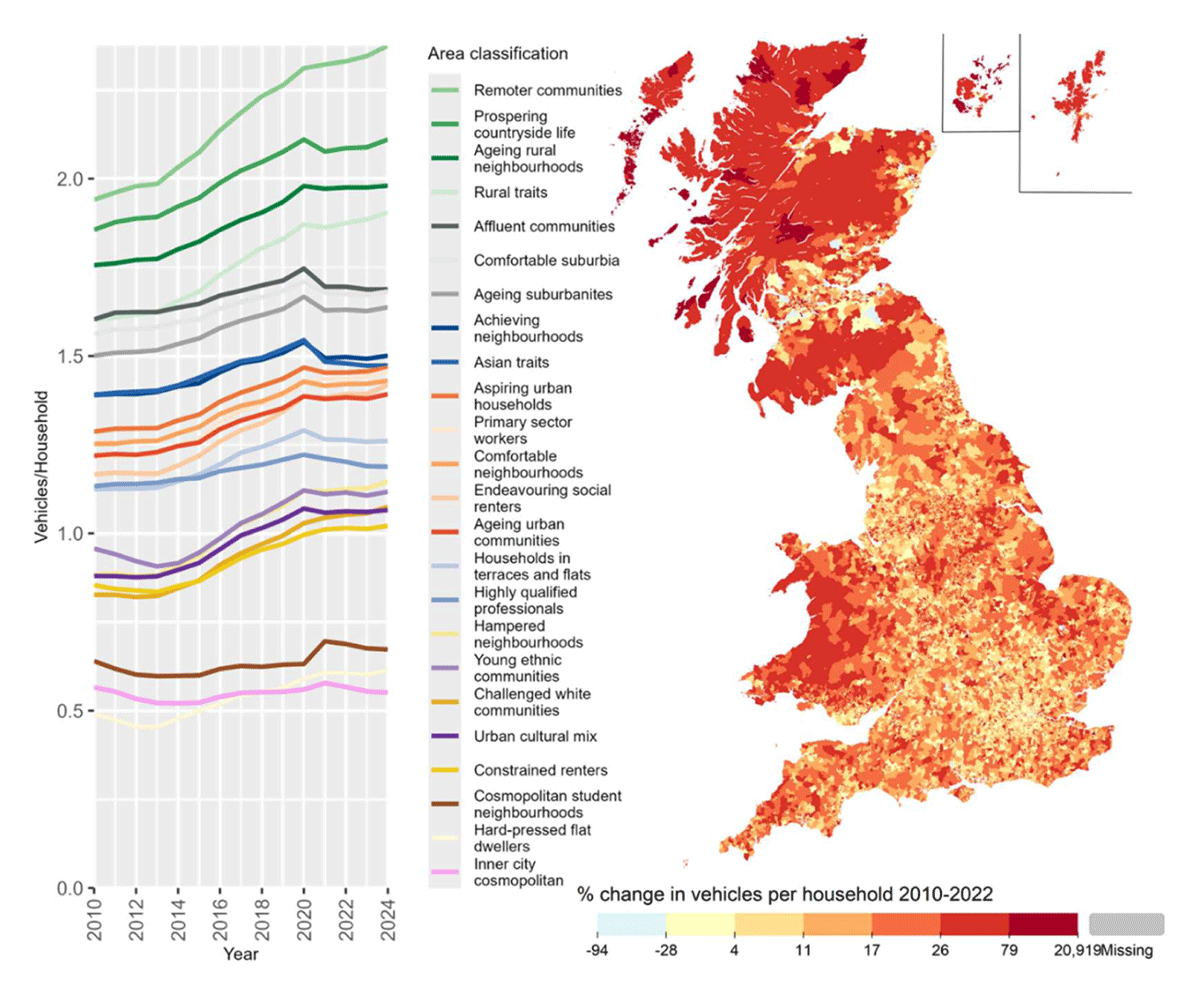
Figure 7
Number of privately registered vehicles per household year in different area classifications (left) and percentage change in the LSOA average vehicle per household from 2010 to 2022 (right). Note that data is missing for Scotland after 2022, so the map and graph show slightly different time periods.
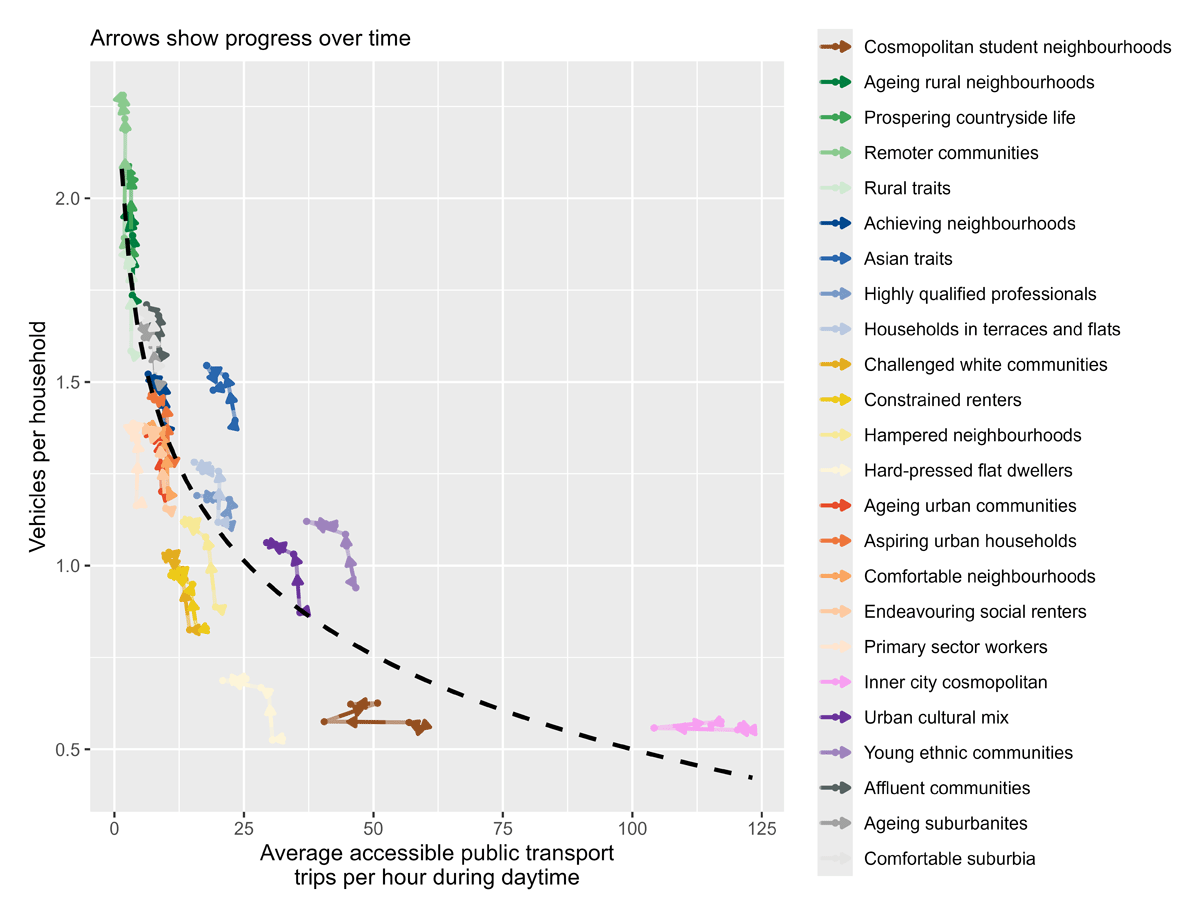
Figure 8
Frequency of public transport (x-axis) and vehicles per household (y-axis) for different area classifications between 2010 and 2023. Arrows on the coloured lines show progression through time. The dashed line shows the overall inverse log relationship between public transport frequency and car ownership across all years and locations. The public transport frequency metric is derived from a one-month timetable snapshot for each year of data and presents the hourly average number of boardable public transport vehicles passing through or close to an LSOA between 6 am and 10 pm.
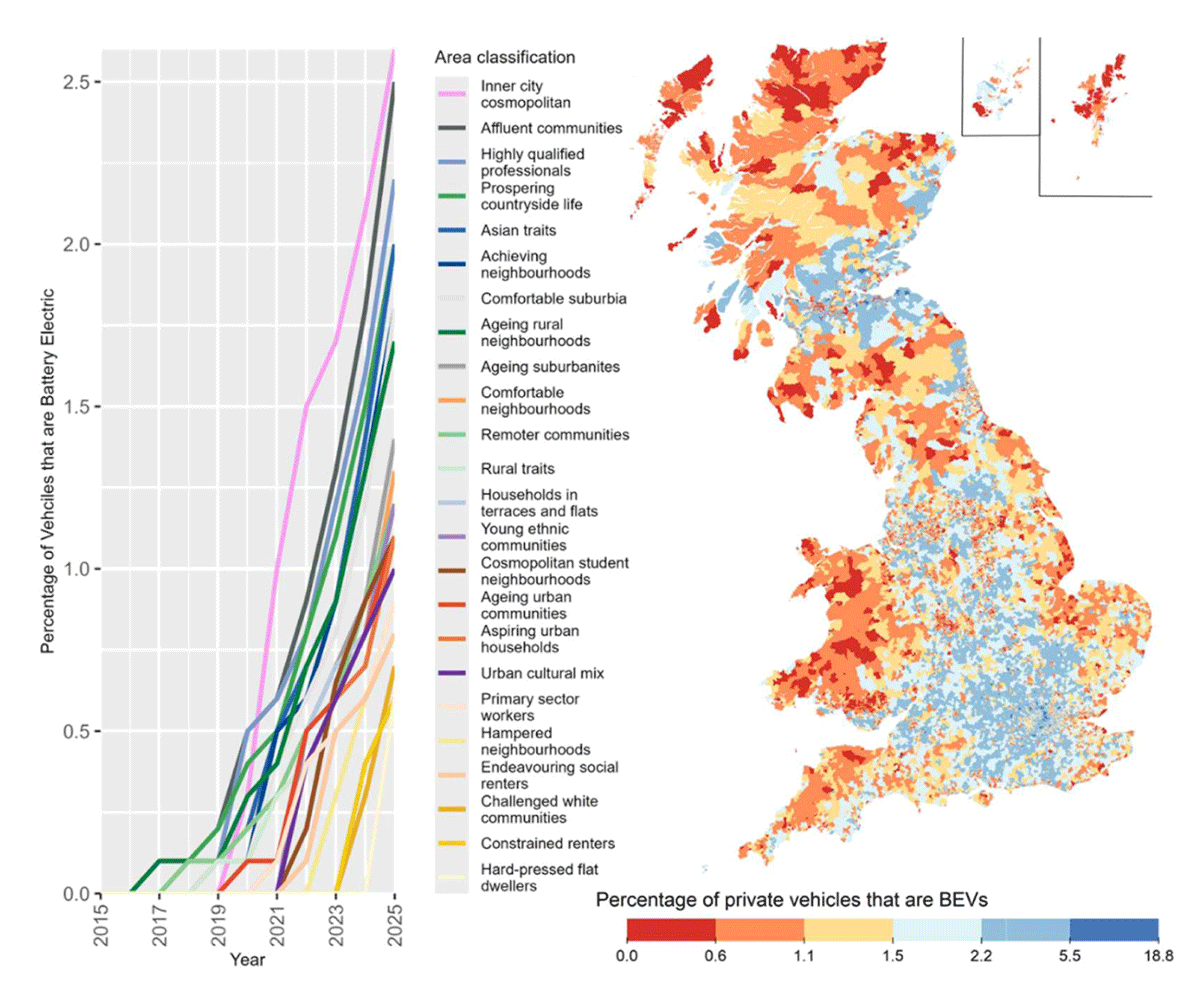
Figure 9
Adoption of Battery Electric Vehicles (BEVs) by area classification (left) and the percentage of private vehicles that are BEVs in 2025 (right).
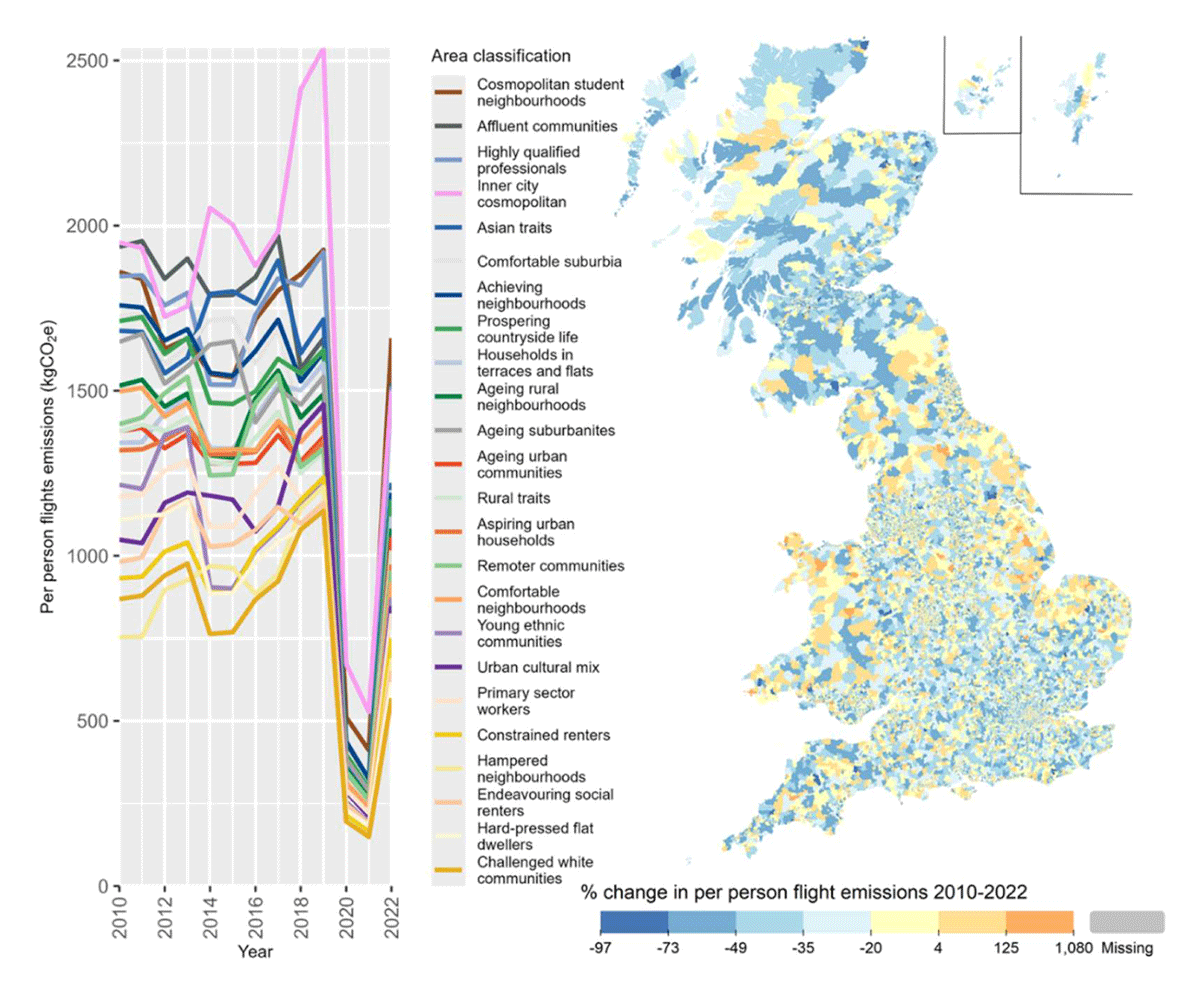
Figure 10
Per person flight emissions in different area classifications (left) and percentage change in the LSOA average flight emissions from 2010 to 2022 (right).
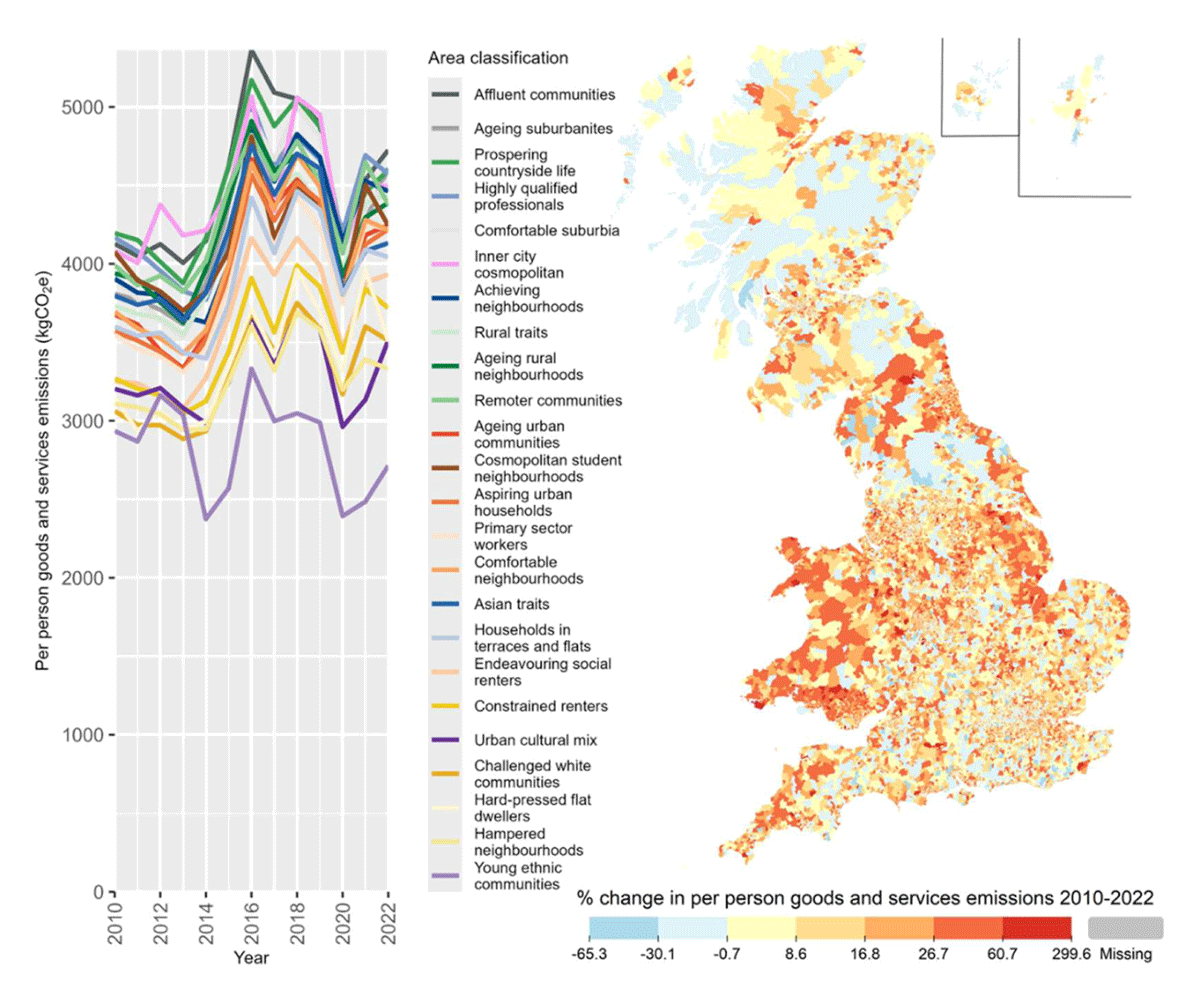
Figure 11
Per-person carbon footprints for the consumption of goods and services in different area classifications (left) and percentage change in the LSOA average goods and services emissions from 2010 to 2022 (right).
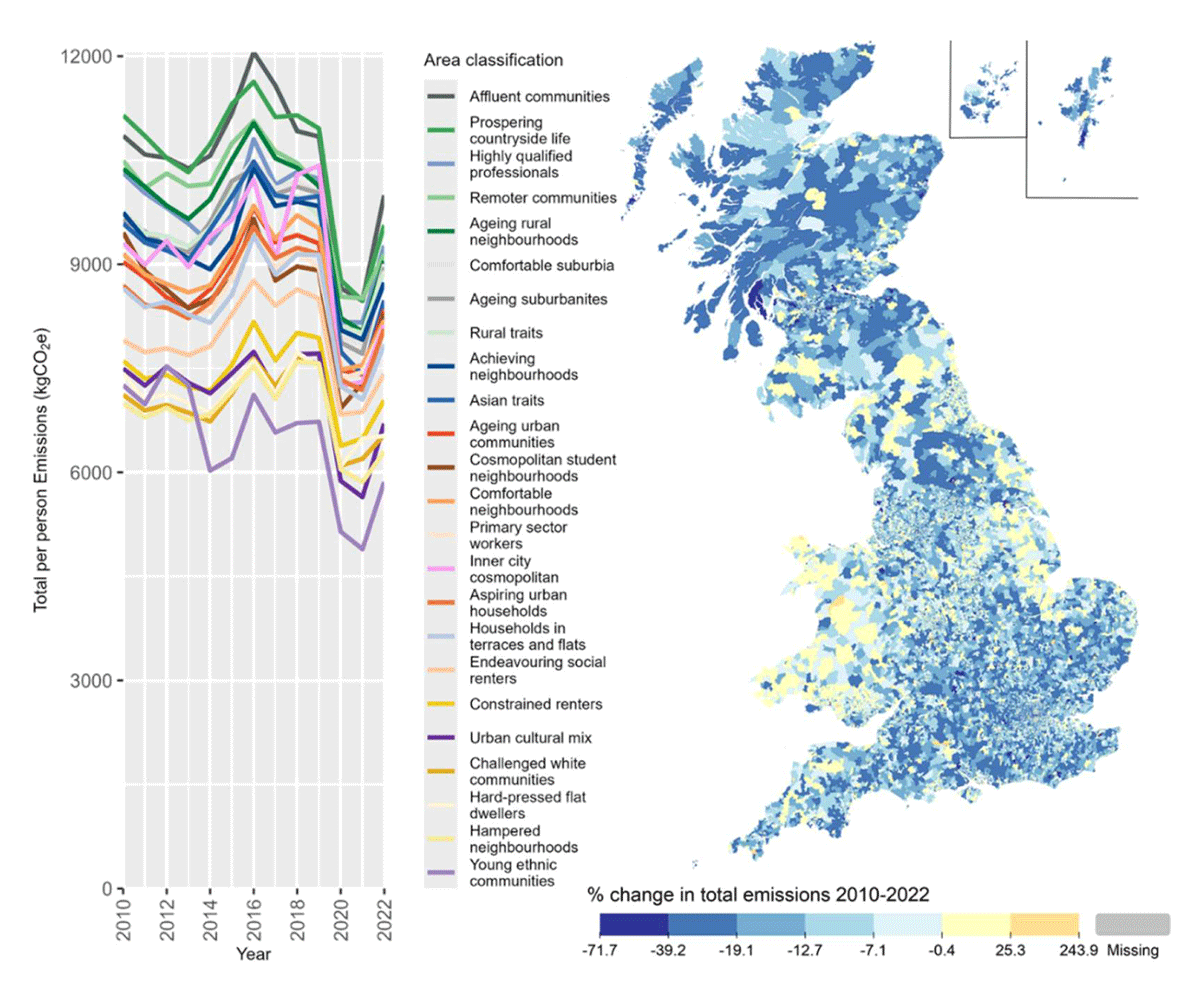
Figure 12
Total per person emissions in different area classifications (left) and percentage change in the LSOA average emissions from 2010 to 2022 (right).
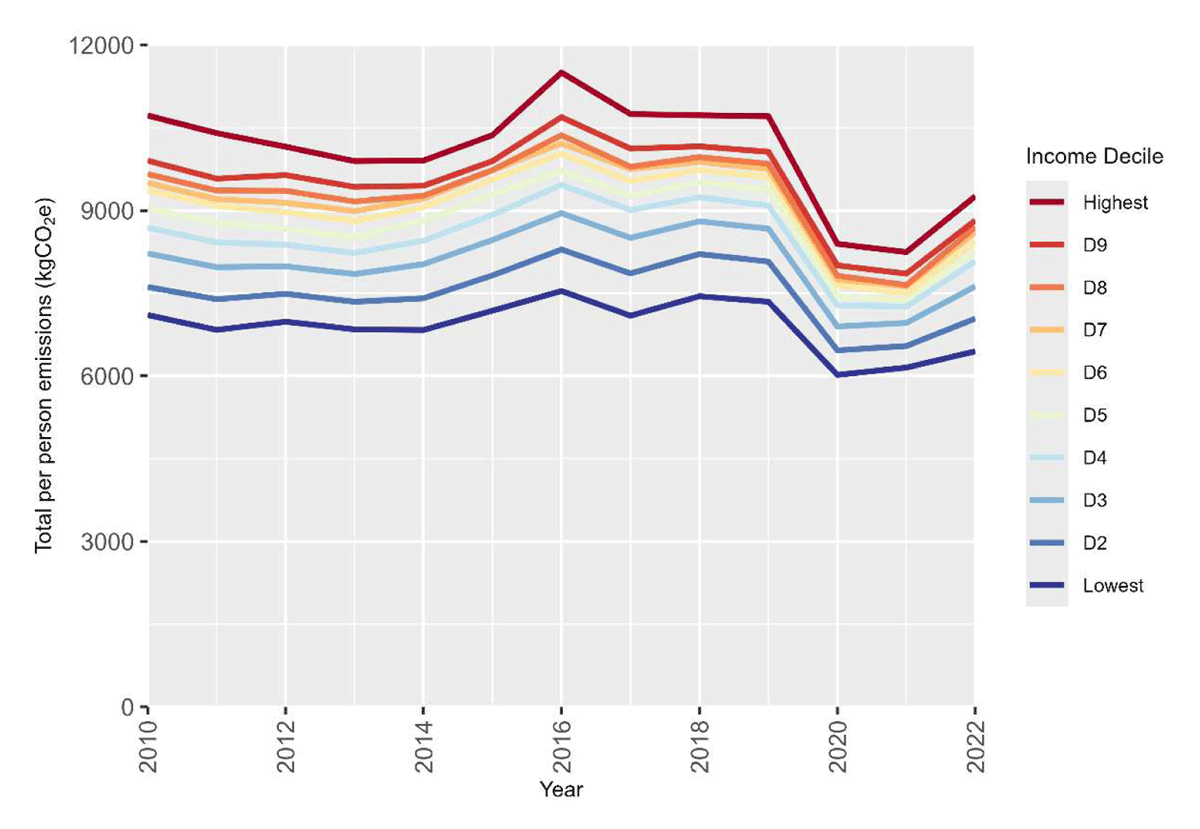
Figure 13
Average total per person emissions for LSOAs by household income decile, based on 2020 income distribution.