
Introduction
Decarbonisation is often framed as a national or global challenge due to the worldwide effects of greenhouse gases. However, many of the actions to reduce carbon emissions need to take place at the local or individual scale. This is especially true when considering energy efficiency or behavioural changes. For example, in the United Kingdom, the government has set a target to retrofit five million homes by 2030 (DESNEZ, 2026), which is intended to reduce carbon emissions and address related issues such as fuel poverty. However, such a policy overlooks important local nuances, such as which homes should be insulated and whether poorer households in need of assistance or richer households with the highest consumption and emissions should be targeted. What about targeting the easiest or cheapest homes first? To answer these kinds of questions, it can be helpful to have spatially disaggregated data, which can enable place-based or local policy decisions.
Neighbourhood data sits at a useful middle ground between the national and individual scales. While in some ways individual or household data would be ideal, practical and privacy constraints make it impossible to have both national coverage and individual detail across the full gamut of topics that connect to the issues of energy demand and decarbonisation.
Similarly, we should also make a distinction between local or regional data, which may be more analogous to small-nation data and truly neighbourhood-level data, which will clearly distinguish between different parts of the same town or city and separate urban cores, suburbs, and rural areas. At this neighbourhood scale, privacy issues are almost eliminated as we are still aggregating data over hundreds or thousands of households, but we still have significant disaggregation across geographical, socioeconomic, and demographic characteristics. This disaggregation is important as it allows research to capture how various kinds of people in different circumstances interact with the energy system in different ways, and thus, allow an exploration of how different policies and technologies may help or hinder the transition to energy-efficient and decarbonised lifestyles.
Carbon & Place (www.carbon.place) is a research project and web tool that attempts to calculate neighbourhood carbon footprints across Great Britain.1 The purpose of the project is to shed light on the differing rates of adoption of decarbonisation technologies and practices and highlight the significant spatial variation in household carbon emissions across the country. This suggests that policy could be more effective if particular areas and groups of people were targeted more effectively.
Last year, the Carbon & Place tool completed the first phase of a major upgrade, replacing the original tool, which presented data from 2018, with a new tool that presented annual data from 2010 to 2020. At the same time, the data and modelling behind the tool were significantly updated (Morgan, 2025). This paper briefly discusses the next round of updates, adding the years 2021 and 2022, but more importantly reflects on what thirteen years of neighbourhood carbon footprints can tell us about the UK’s decarbonisation journey. While previous studies have demonstrated substantial spatial variation in household carbon footprints (Cohen & Ummel, 2019; C. Jones & Kammen, 2014a; C. M. Jones et al., 2018; Mori & Ferrante, 2026), no research has examined how neighbourhood carbon footprints evolve through time and whether different types of neighbourhoods are decarbonising at similar rates. This represents an important evidence gap because many net-zero policies increasingly rely on household-level technology adoption and behavioural change, both of which are strongly influenced by place-specific circumstances.
Accordingly, this paper addresses the following research question: To what extent have different neighbourhood types in Great Britain experienced different decarbonisation trajectories between 2010 and 2022, and what do these trajectories reveal about the relative importance of supply-side decarbonisation, technology adoption and behavioural change?
Using thirteen years of neighbourhood carbon footprint data covering more than 43,000 neighbourhoods across Great Britain, the paper compares trends across 24 geo-demographic clusters. The analysis seeks to identify where emissions reductions have been widespread, where progress remains limited, and what these patterns imply for place-based net-zero policy.
Literature review
The UK has set an ambitious climate target of achieving Net Zero by 2050 (Climate Change Act 2008, 2008). These targets are supported with interim carbon budgets set by the Climate Change Committee. Since the Climate Change Act was introduced in 2008, the UK has met each of its carbon budget targets and currently appears to be on track to meet the fourth carbon budget target, which runs from 2023 to 2027. This means the UK has roughly halved its territorial greenhouse gas emissions since 1990 (CCC, 2025).
While this progress is welcome, much of it has been made through a small number of changes, such as the phase-out of coal for electricity generation and the continued de-industrialisation of the UK economy. Conversely, some sectors have made limited progress on decarbonisation, such as surface transport, agriculture, and housing, or have experienced increases in emissions in recent years, such as residential buildings and aviation (CCC, 2025).
Thus, the UK is at a challenging point in its decarbonisation journey, with both an acceleration and broadening in decarbonisation required (CCC, 2025). While the first phase of decarbonisation was somewhat removed from most people’s day-to-day lives, as it was largely delivered by large businesses such as electricity generators, the next phase of decarbonisation will be much closer to home as it requires households to adopt new technologies such as electric vehicles and heat pumps, and change behaviours such as switching to active and public transport or changing diets.
As the focus of decarbonisation shifts from the national/industrial realm to the local/household realm, it becomes more important to understand the local context and how that can affect the behaviour of residents. Local realities often constrain households’ ability to adopt new technologies (Smith & Sharmina, 2025), such as the strong links between retrofit, heat pump adoption and building type or age (Ahmad, 2023). For example, the UK has the oldest building stock in Europe (Marchant & Wentworth, 2025), making energy efficiency retrofits harder and more expensive (Gao et al., 2026; Jager et al., 2025), but also more cost-effective. While dense urban design, public transport, and active travel infrastructure enable low-carbon lifestyles (Kondratenko et al., 2024; Marzolla et al., 2026), their absence in many areas keeps households car-dependent (Lucas et al., 2019; Wood et al., 2026), and low and stagnant wages make new electric vehicles (EVs) unaffordable (Kennedy et al., 2023; Yiu et al., 2025). While higher rates of EV adoption have been seen in less deprived areas (Khader et al., 2025; Kondratenko et al., 2024). Thus, while many of the energy efficiency measures required for decarbonisation would, in the long run, save money and deliver significant co-benefits, such as better public health, many households will struggle to adopt these solutions (Fylan et al., 2016).
Such a view of the UK can paint a picture of despair where no progress is possible. But the UK is a nation of contradictions. While some are still struggling with the cost-of-living crisis (Clarke, 2025), others are prospering, and overall household debt is at its lowest levels in 20 years (Francis-Devine, 2026), suggesting room for long-term investments. Therefore, there is a need to move away from the singular national narrative and embrace the local nuances. Such an approach can help identify specific blockers that prevent the uptake of energy efficiency and help foster early adopters who can pave the way for mass adoption in the future (Balta-Ozkan et al., 2021).
While carbon footprint studies are common at national and regional scales, few studies examine neighbourhood-level variation (C. Jones & Kammen, 2014a; Morgan, 2025; Mori & Ferrante, 2026), and none look at how neighbourhood carbon footprints change over time. Previous research has established that household emissions vary according to income (Buchs & Schnepf, 2013; Chen et al., 2023; Druckman & Jackson, 2016; Lévay et al., 2023; Liu et al., 2023), housing (Ahmad, 2023; Buchs & Schnepf, 2013; Büchs & Schnepf, 2013; Few et al., 2023; C. Jones & Kammen, 2014a), transport accessibility (C. Jones & Kammen, 2014b; Kondratenko et al., 2024; Lucas et al., 2019; Marzolla et al., 2026; Morgan et al., 2022; Wood et al., 2026) and urban form (C. M. Jones et al., 2018), but little evidence exists regarding whether these differences are narrowing, widening or remaining stable during the transition to net zero. This paper contributes to this nascent field by examining change in neighbourhood carbon footprints over time.
Methods
A detailed explanation of how the neighbourhood carbon footprints are calculated is provided in (Morgan, 2025), and so is not presented here, as the focus of this paper is on analysing the results. However, a brief recap is necessary to understand the choices made in analysing the results. This paper also includes preliminary results updating the time series data from 2020 to 2022. While some of the results presented are more up to date (2025), the complete analysis depends on many input datasets, each with its own update schedule; thus, a 3–4-year lag is inevitable for many parts of the analysis.
The statistical neighbourhood
The neighbourhood unit of analysis in this paper is the Lower Super Output Area (LSOA) in England and Wales or the analogous Data Zone (DZ) in Scotland. These areas were created for the 2001 Census and have undergone revisions in 2011 and 2021/22. As well as being one of the main ways in which small area statistics are disseminated from the Census, they are also widely used by the government and academia to share other types of data. LSOAs are designed to have populations of around 1,500–3,000 and typically remain unchanged between Censuses unless there has been significant local population change. In contrast, administrative areas change frequently and have wide variation in population. Thus, LSOAs provide a convenient unit for spatial and temporal analysis within Great Britain. For simplicity, this paper will use LSOA to refer to the 2021 Lower Super Output Areas and the 2022 Data Zones; any historical data has been remapped to these boundaries.
When good local data is available
In some cases, such as the consumption of gas and electricity, the Government already publishes good-quality data at the LSOA scale. Thus, very little modelling is required, and any analysis can be considered reflective of local realities. In some cases, such as the Energy Performance Certificates (EPC) of domestic buildings, data is available at a smaller scale (e.g. building) but not always comprehensive. For example, in the UK, a building only requires an EPC when it is sold or rented, and so some buildings do not have an EPC. In these cases, data can be aggregated to the LSOA scale, but some caution is required as it may be a biased sample.2
As we can have reasonably high confidence in the results based on good quality local data, this paper will focus on what these results tell us about the recent history and future trajectory of energy demand and decarbonisation in Great Britain.
When local data is unavailable
A more challenging aspect of calculating neighbourhood carbon footprints is when locally specific data is unavailable. In these cases, a synthetic population method is used, which combines national survey data with local demographic data. A common example of this method is that in Great Britain, there is no neighbourhood data on the purchase of goods and services, such as food or electronics. However, there are detailed household surveys (ONS, 2024) and national consumption and emissions data (DEFRA, 2021). Thus, the challenge is to construct a sub-sample of the national surveys that is more representative of any given neighbourhood than the national average. This was done by producing a synthetic population of each neighbourhood to convert aggregated LSOA data into a list of households with individual characteristics. These synthetic households could then be paired with the closest matching real households in the survey data (Morgan, 2025). Matching of households was performed based on household size (e.g. 1, 2, 3, 4 or more people), household composition (e.g. couple with children), housing tenure (e.g. private rent), number of cars/vans (e.g. 0, 1, 2, 3 or more), area classification (e.g. prosperous semi-rural), and income. Thus, for each LSOA, it was possible to take from a national survey of around 10,000 households a sub-sample of typically 600-700 households that were demographically representative of the LSOA. Morgan (2025) showed that these sub-samples were strongly correlated with the demographics used in the matching process (R2 = 0.96) and correlated with a range of other demographic and socioeconomic variables not used in the matching process, with R2 from 0.16 to 0.72 depending on the variable tested.
As the data in these cases are modelled, there is lower confidence in the quality of the results, and so this paper will discuss both the level of confidence we can have in the models and what the results can tell us about decarbonisation.
Approach to analysing the neighbourhood carbon footprints
This paper is attempting to present the results of 43,064 local analyses and argue for a local approach to decarbonisation, which is challenging to summarise in a short paper. Therefore, we have summarised the analysis by groups of areas to provide a sense of the spatial variation in outcomes. To provide a consistent set of groups across the analysis, we have opted to use the official 2011 LSOA Classifications (ONS, 2018). These classifications cluster neighbourhoods into twenty-four groups based on a mix of 60 geo-demographic indicators such as demographic structure, household composition, housing, socio-economic character, and employment. The clusters are shown in Figure 1 and are useful as they group similar types of households and neighbourhoods regardless of where in the country they are. This can be more informative than region-based groupings, where each group has a diverse mix of people and neighbourhood types.
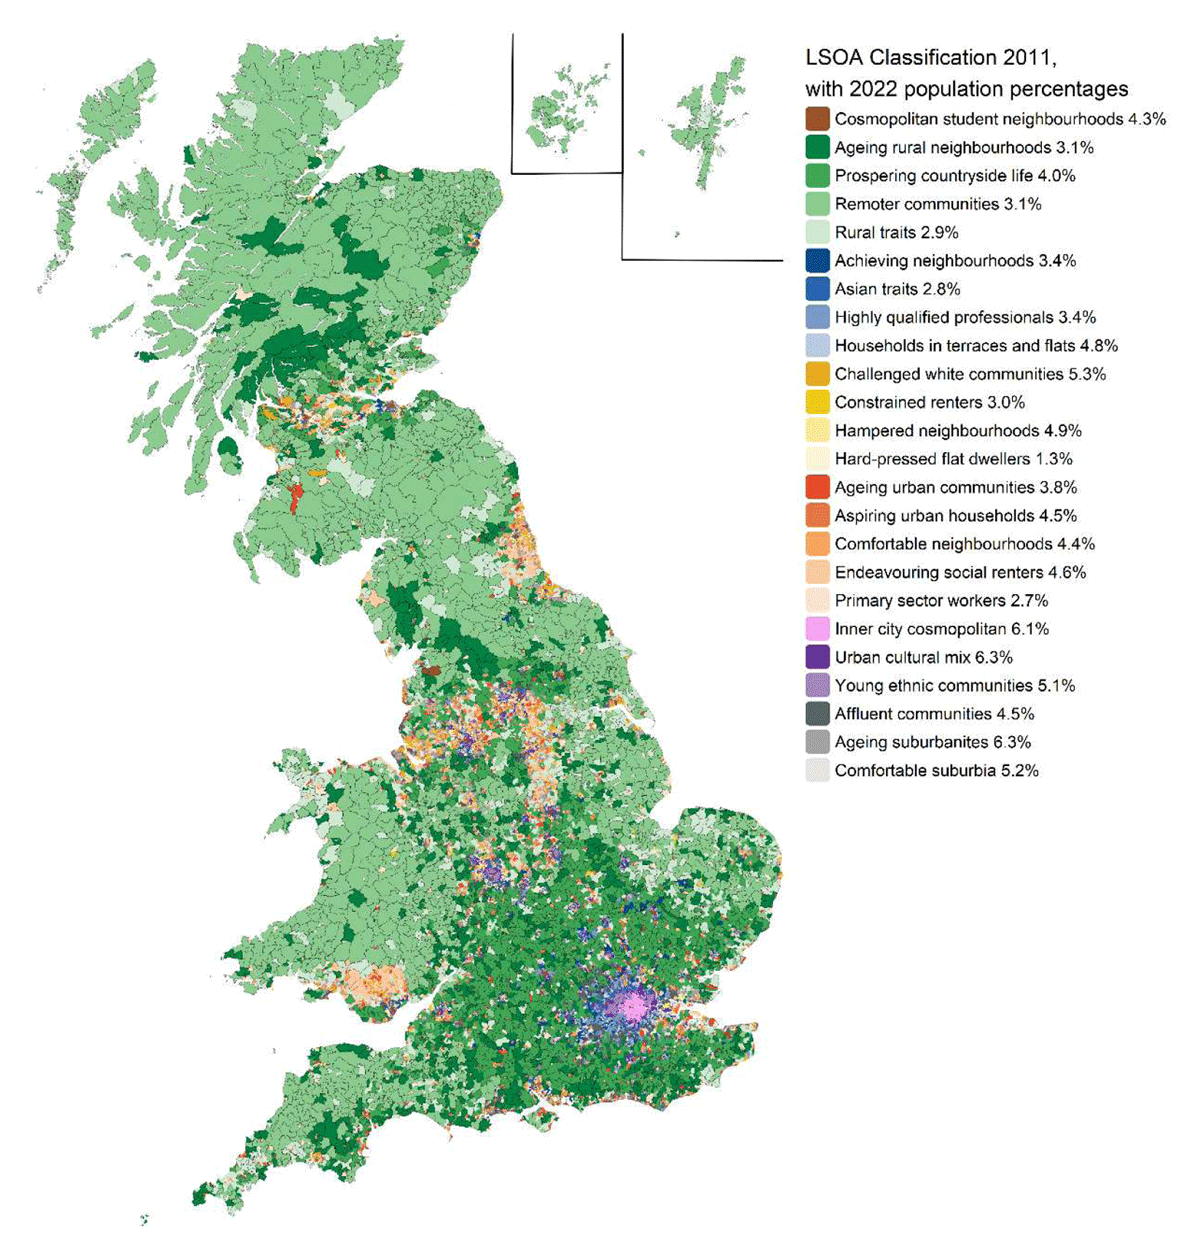
Figure 1
Map of 2011 LSOA area classifications adjusted to the 2021/22 boundaries used throughout this paper.
For each part of the carbon footprint, three pathways to decarbonisation are investigated. Supply-side decarbonisation, where emissions fall because of changes in the wider energy system rather than local changes. Technology adoption, where emissions reductions depend on households adopting new technologies (e.g. building retrofit). Behavioural and consumption change, where households change the amount or type of consumption leading to reductions in carbon emissions.
Figure 1 also highlights that the 24 clusters exist within larger super-clusters illustrated by similar colours; for example, all the rural clusters are green, while the poorer inner-city clusters are in yellow. Some super-clusters contain only a single cluster, such as “cosmopolitan student neighbourhoods” (brown) and “inner city cosmopolitan” (pink).3
The analysis focuses on a range of topics where local variation is especially important to decarbonisation, such as transport and housing and presents the recent history (2010–present) of decarbonisation across Great Britain and, where possible, attempts to explain the spatial variation in per-capita carbon emissions and the progress (or lack thereof) in decarbonisation.
Uncertainty and limitations in the data
Different parts of the carbon footprint had different levels of uncertainty. Gas consumption, electricity consumption and vehicle registration data are derived directly from administrative datasets and therefore provide relatively high confidence in observed spatial patterns and long-term trends (Figures 2, 3, 4, 7,8, 9). Building-level data (such as EPCs) provide broad insight into housing quality and efficiency but are affected by incomplete building coverage and potential sampling biases. However, data coverage in most neighbourhoods is usually well over 50% and very rarely less than 30%, so even a biased sample will be somewhat representative (Figure 5).
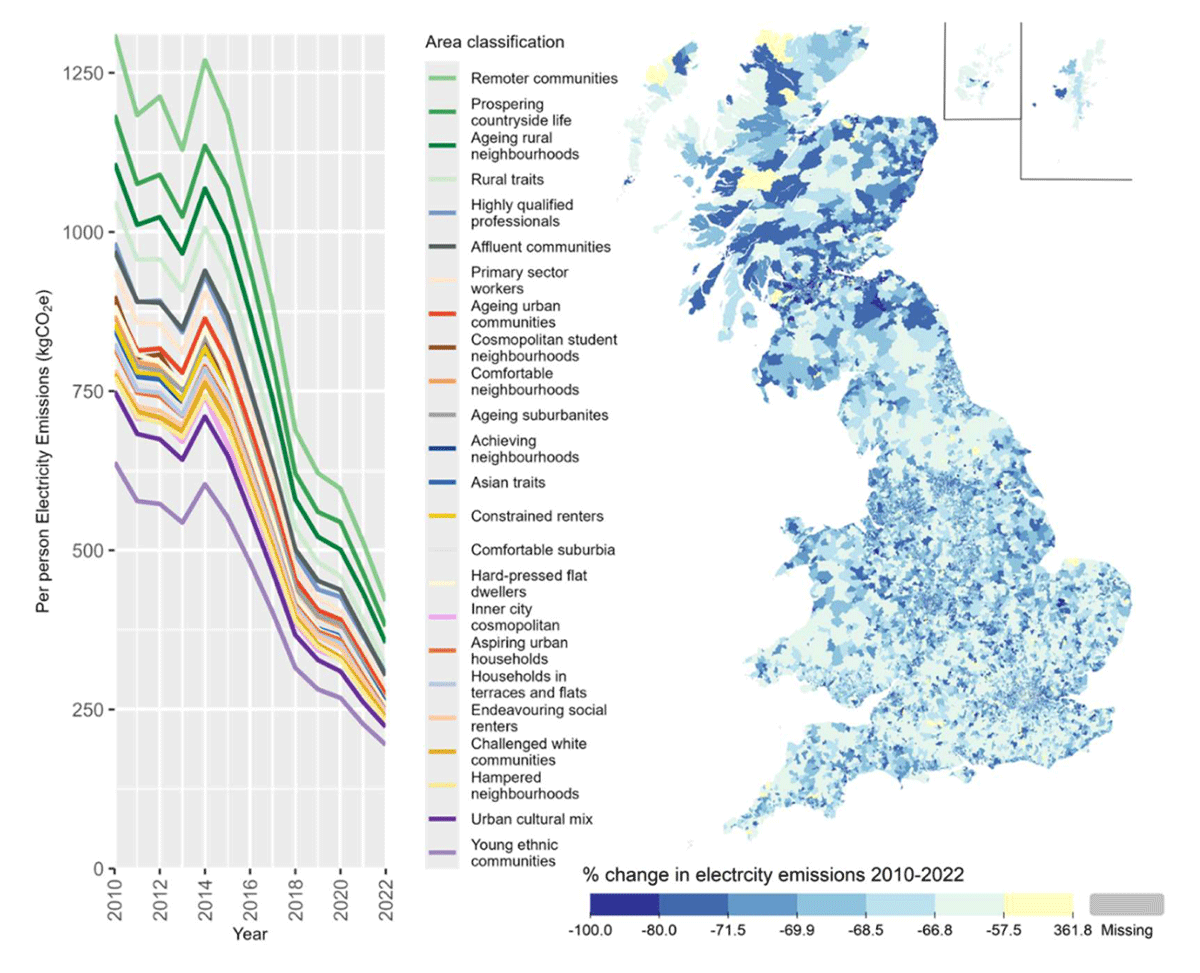
Figure 2
Median electricity emissions per person for different area classifications (left) and percentage change in LSOA emissions between 2010 and 2022 (right).
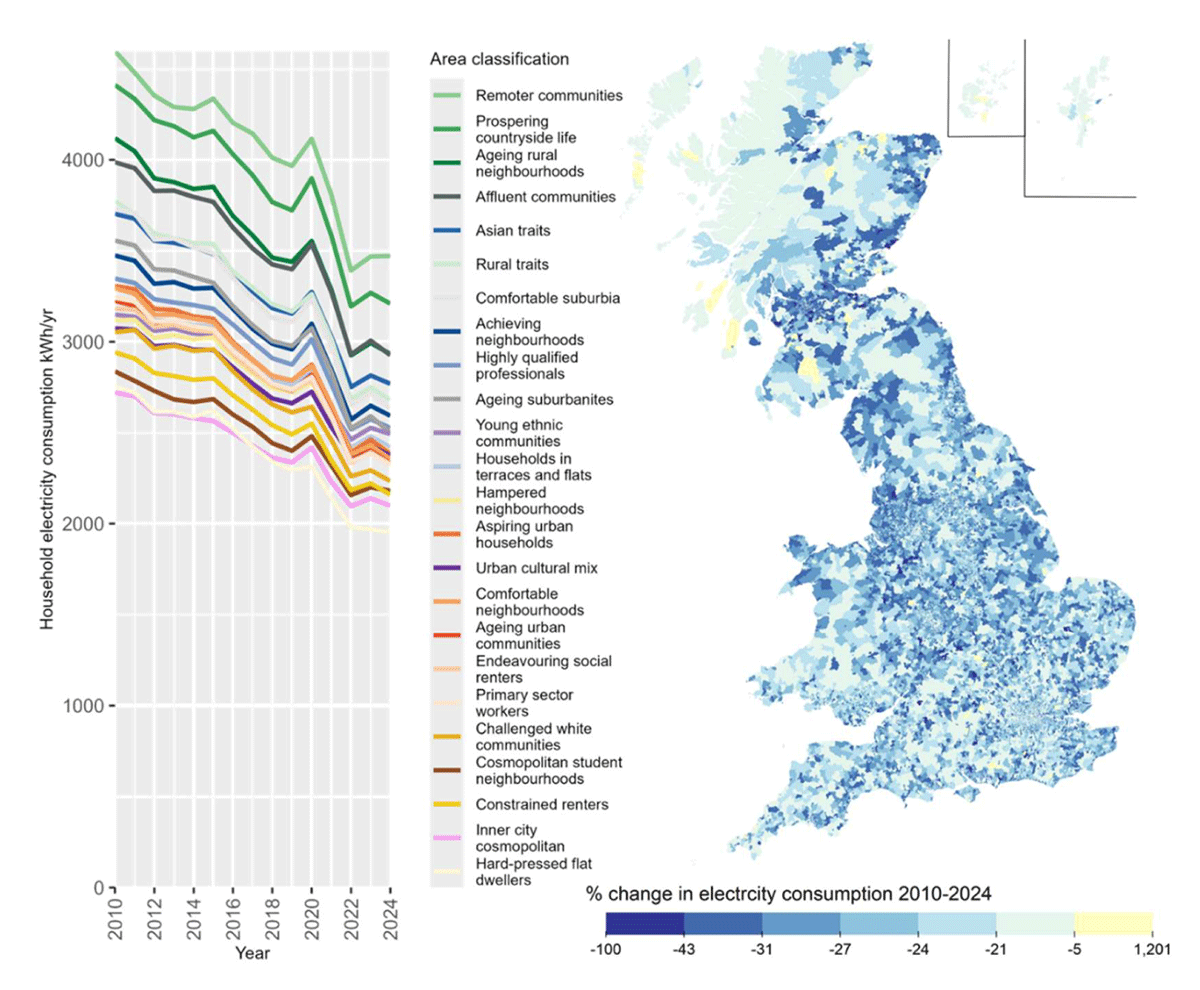
Figure 3
Median household electricity consumption per year for different area classifications (left) and percentage change in LSOA electricity consumption between 2010 and 2024 (right).
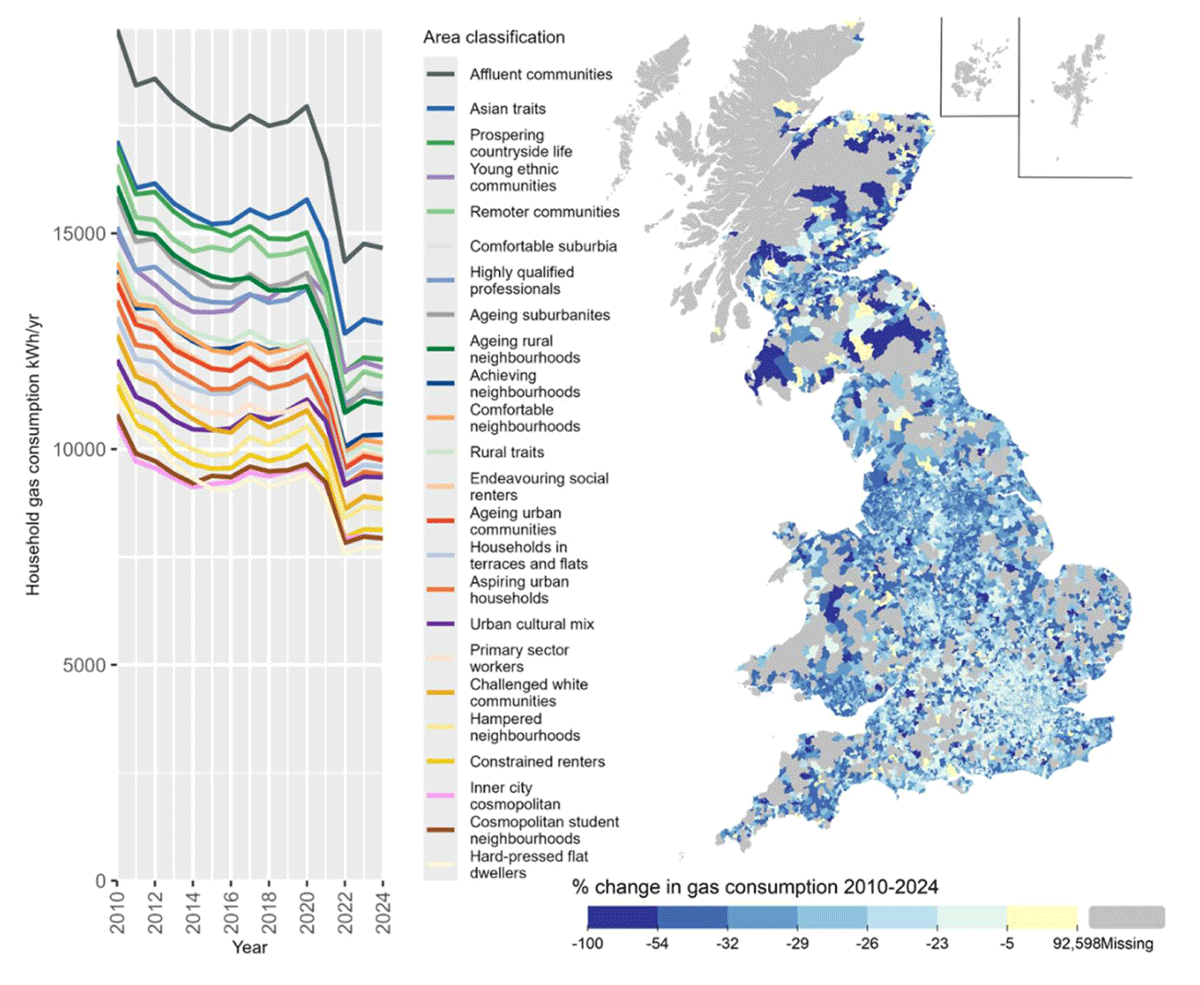
Figure 4
Median per household gas consumption for different area classifications (left) and percentage change in LSOA gas consumption between 2010 and 2024 (right). Note that areas of the map in grey are off the gas grid and so have no data.
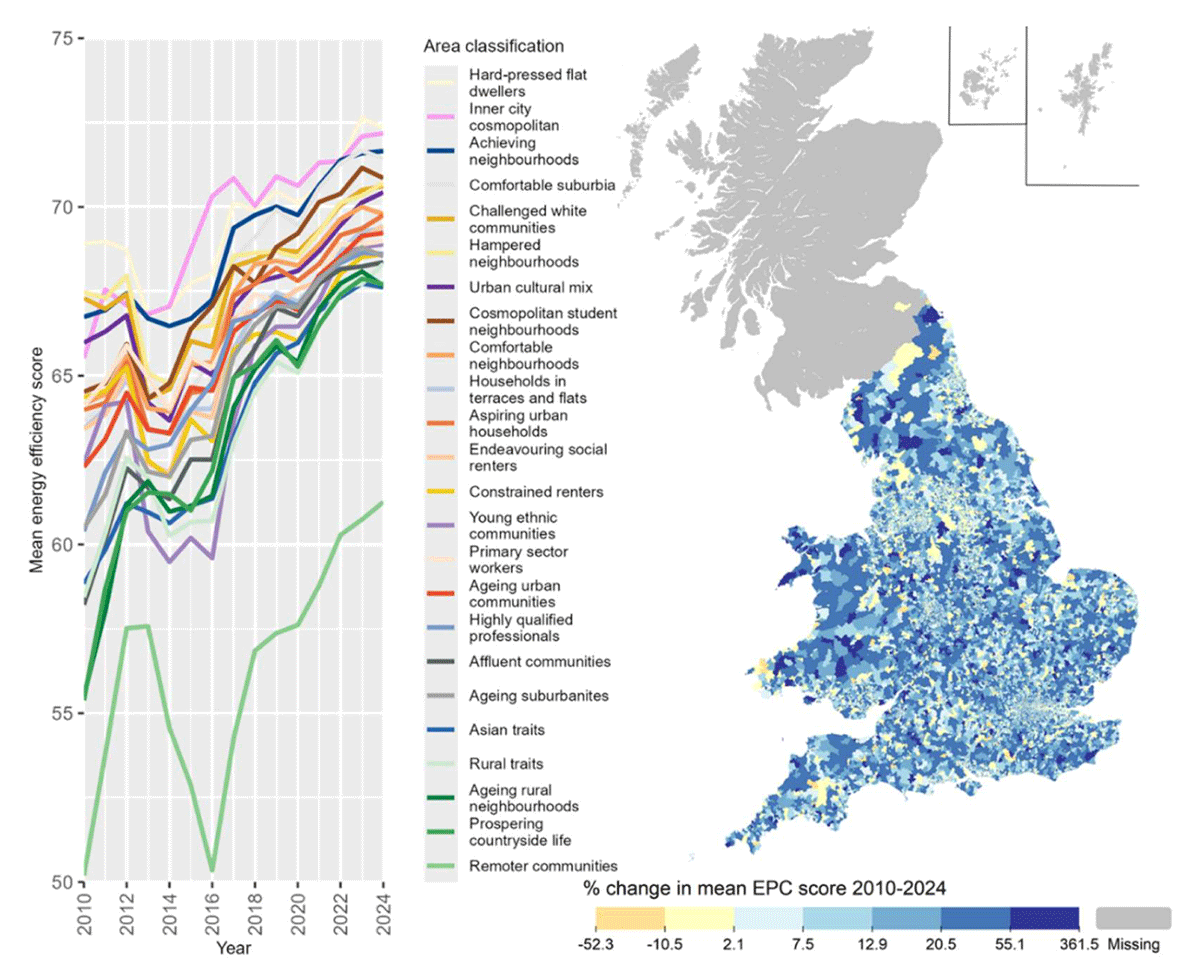
Figure 5
Average SAP energy efficiency rating out of 100 (higher means more efficient) of domestic buildings assessed per year in different area classifications (left) and percentage change in the LSOA average energy efficiency score from 2010 to 2024 (right). Note that historic EPC data is unavailable in Scotland before 2018 and therefore has been excluded from this map.
Slightly higher levels of uncertainty exist for transport use (Figure 6). While the data on total vehicle ownership is detailed and up-to-date, data on use is derived from more aggregate data on the vehicle fleet that must be disaggregated to estimate local km driven per vehicle. Emissions per km are also based on official sources, which can be unreliable (Tietge et al., 2017).
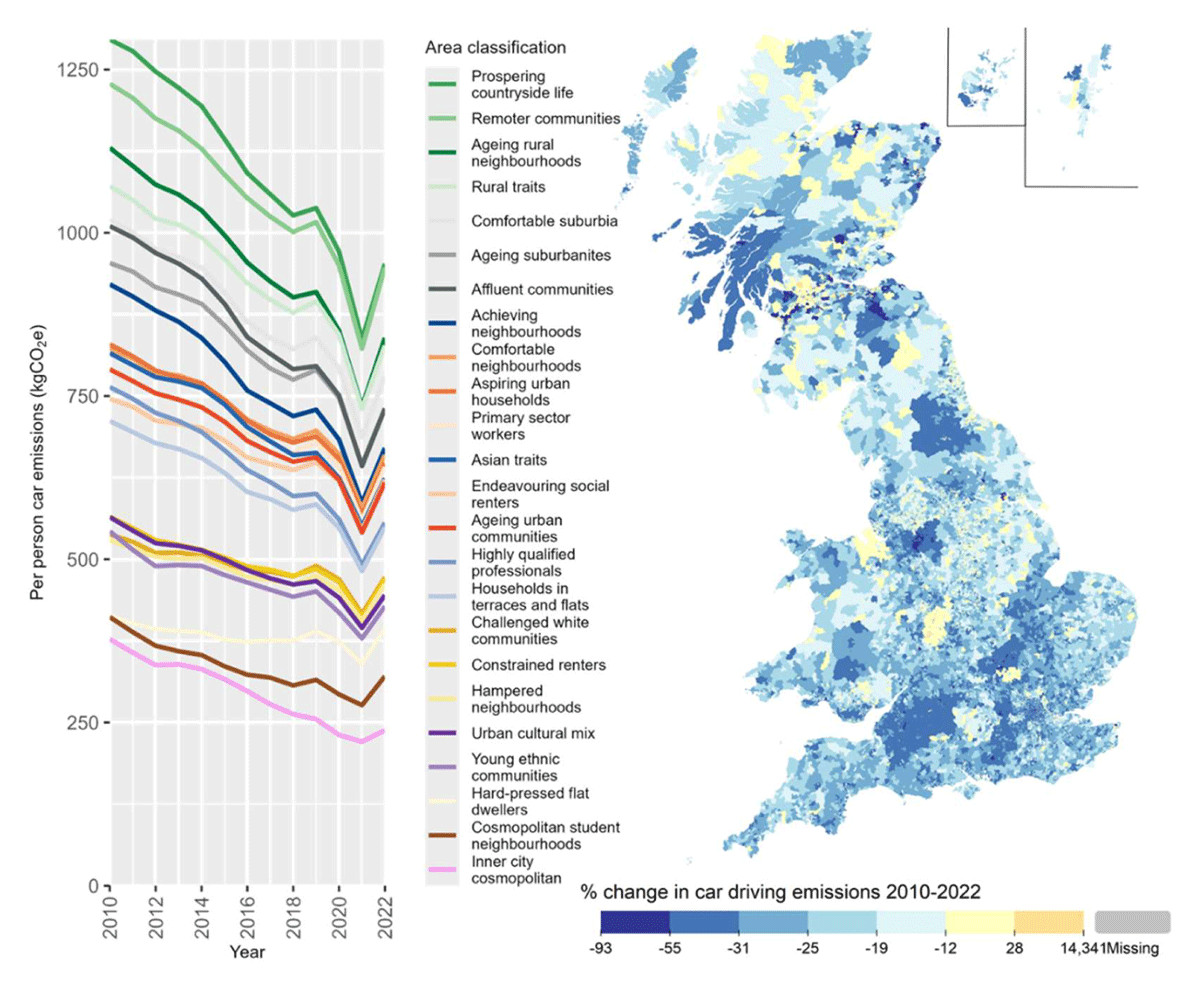
Figure 6
Per person car driving emissions from private cars year in different area classifications (left) and percentage change in the LSOA emissions from 2010 to 2022 (right).
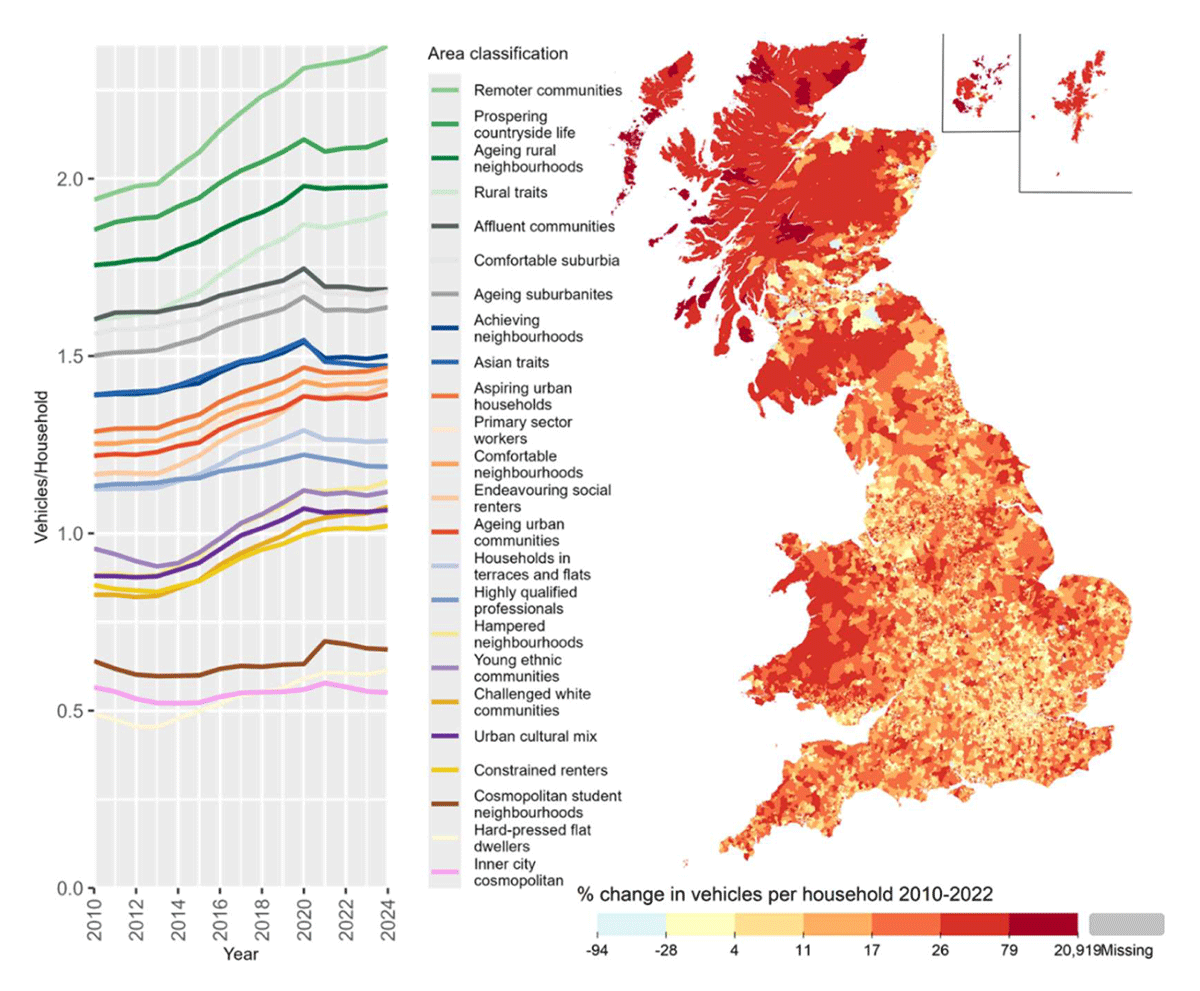
Figure 7
Number of privately registered vehicles per household year in different area classifications (left) and percentage change in the LSOA average vehicle per household from 2010 to 2022 (right). Note that data is missing for Scotland after 2022, so the map and graph show slightly different time periods.
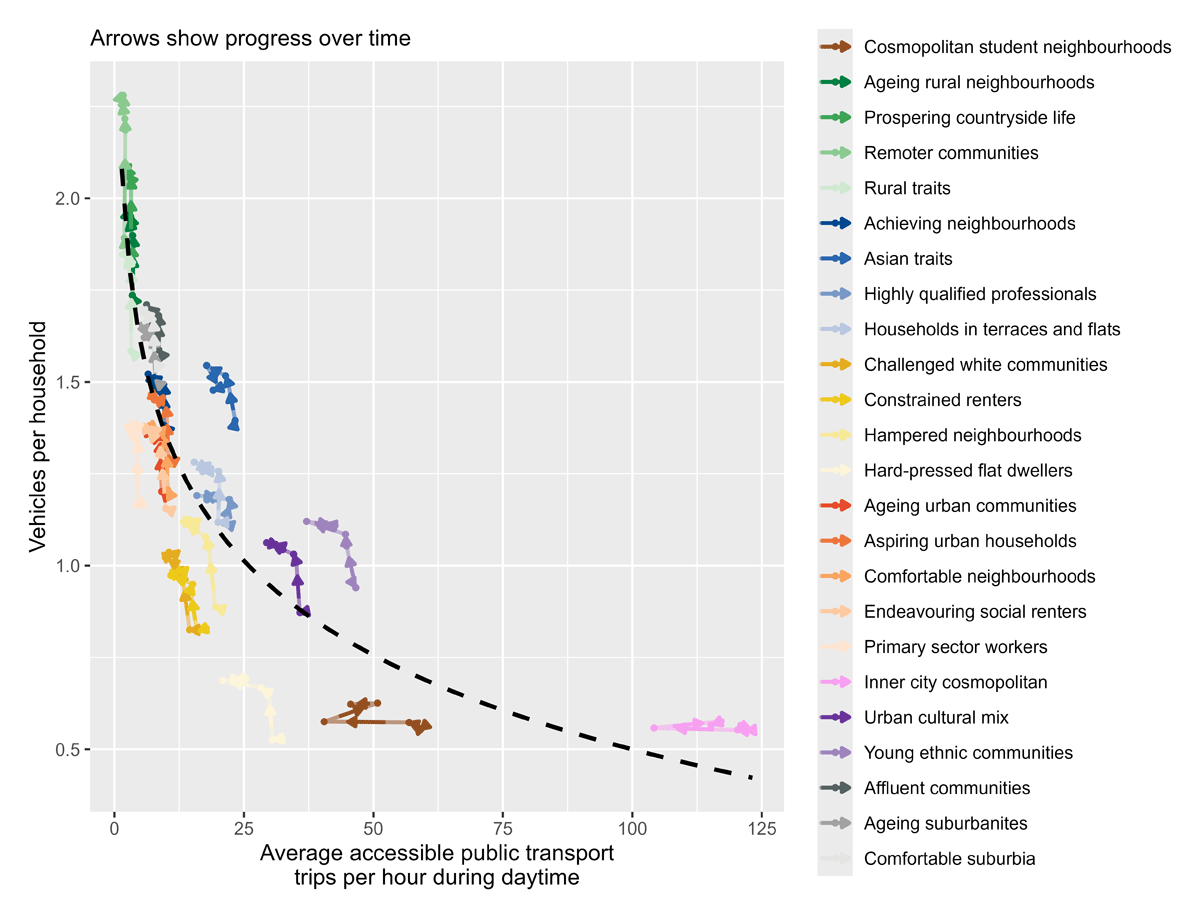
Figure 8
Frequency of public transport (x-axis) and vehicles per household (y-axis) for different area classifications between 2010 and 2023. Arrows on the coloured lines show progression through time. The dashed line shows the overall inverse log relationship between public transport frequency and car ownership across all years and locations. The public transport frequency metric is derived from a one-month timetable snapshot for each year of data and presents the hourly average number of boardable public transport vehicles passing through or close to an LSOA between 6 am and 10 pm.
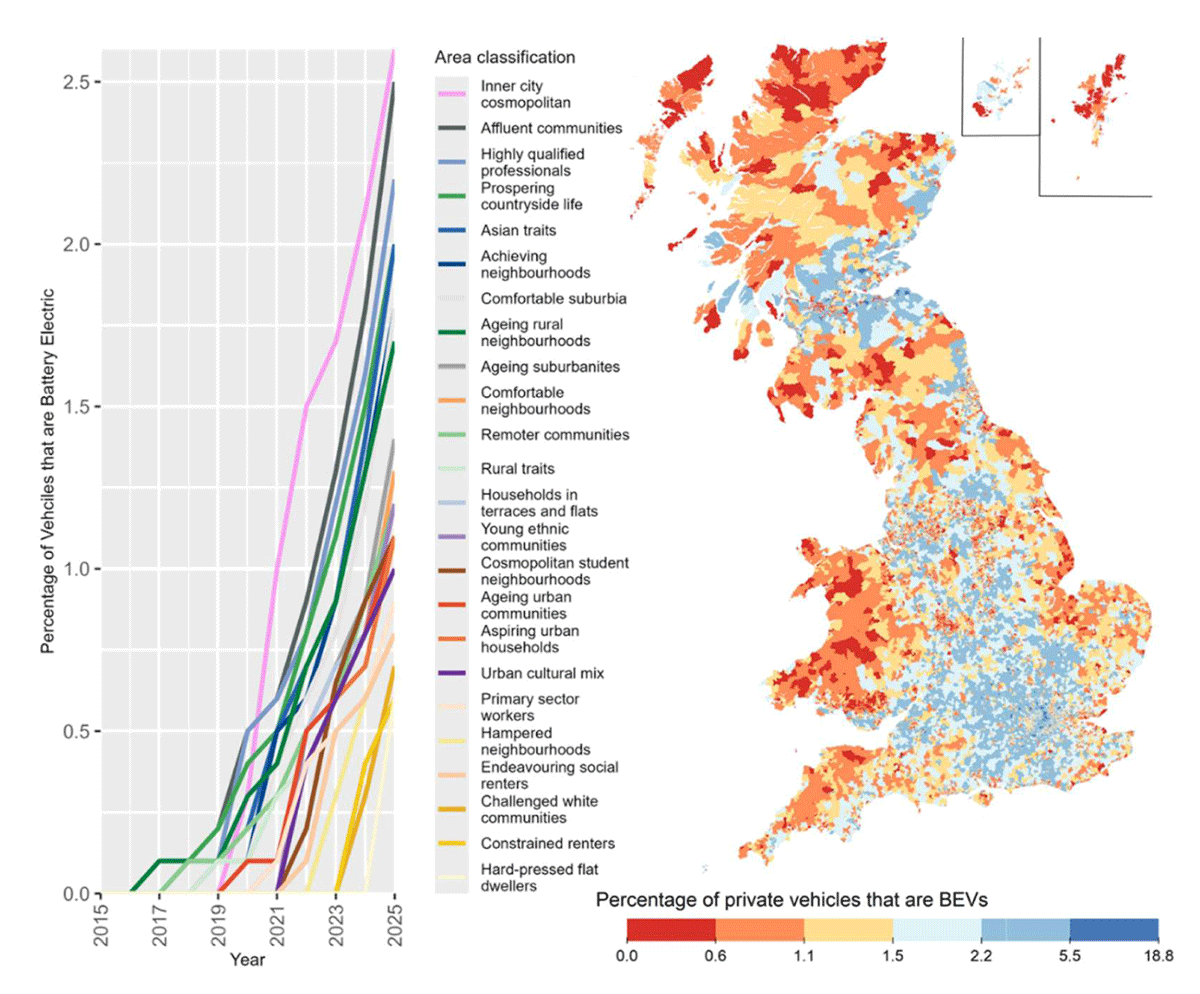
Figure 9
Adoption of Battery Electric Vehicles (BEVs) by area classification (left) and the percentage of private vehicles that are BEVs in 2025 (right).
Greater uncertainty exists for aviation and consumption emissions (Figures 10, 11) because these rely on synthetic population modelling and survey-based estimation (Morgan, 2025). Consequently, the analysis focuses primarily on persistent differences between neighbourhood types and long-term trends rather than short-term year-to-year fluctuations. Where findings rely on modelled variables, interpretations should be considered indicative rather than definitive.
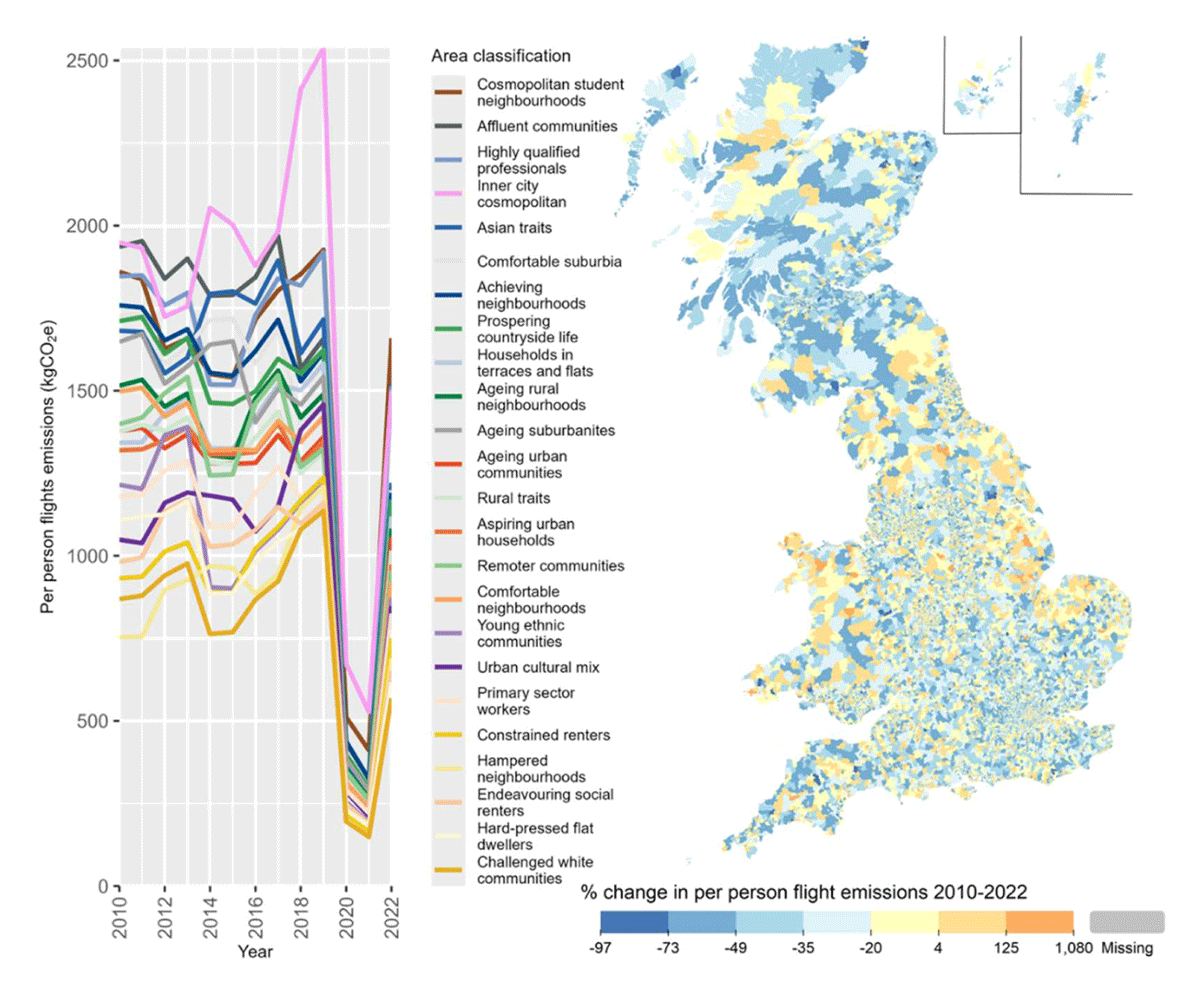
Figure 10
Per person flight emissions in different area classifications (left) and percentage change in the LSOA average flight emissions from 2010 to 2022 (right).
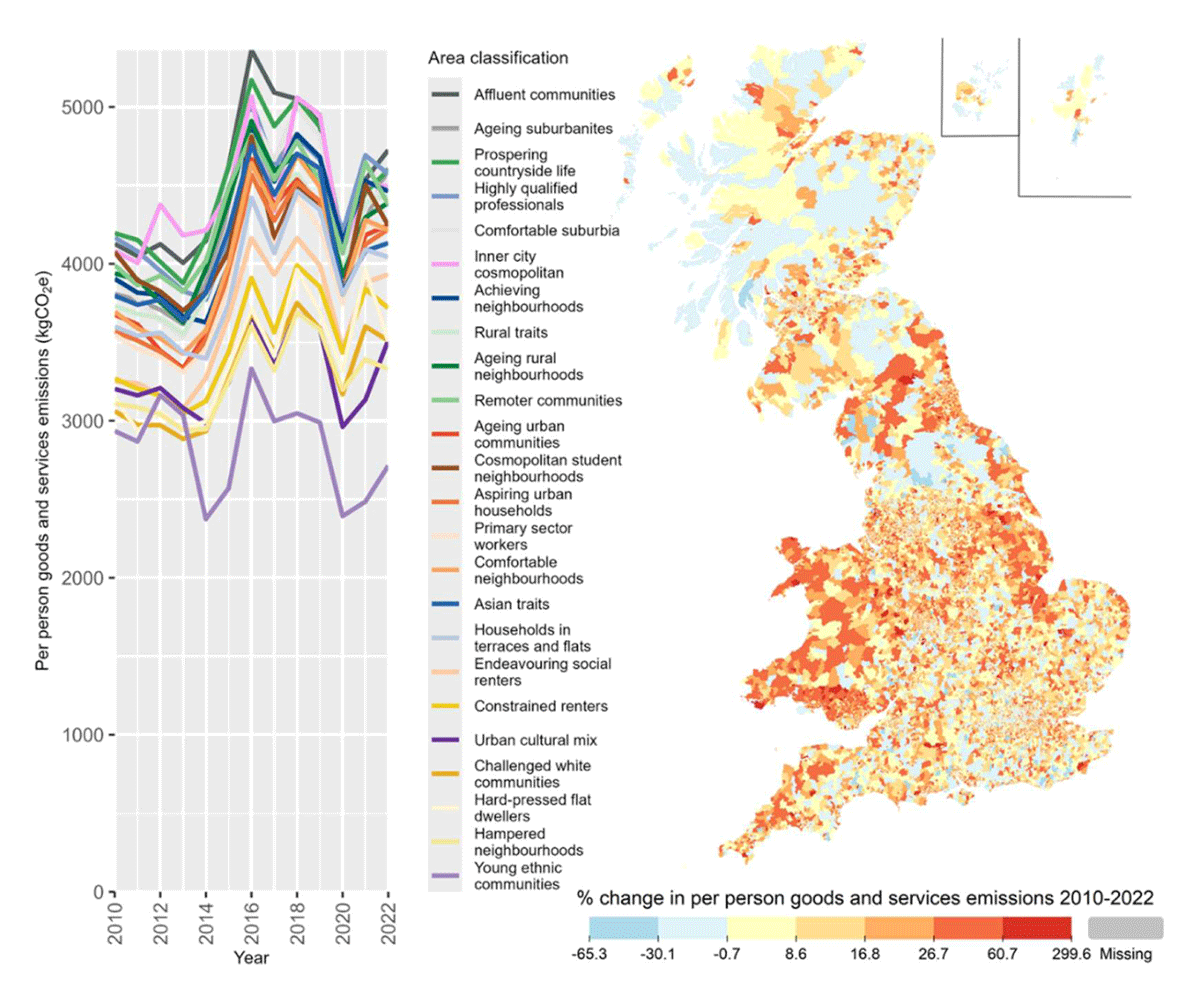
Figure 11
Per-person carbon footprints for the consumption of goods and services in different area classifications (left) and percentage change in the LSOA average goods and services emissions from 2010 to 2022 (right).
Results and analysis
Domestic energy and emissions
Most homes in Great Britain have gas central heating and are connected to the electricity grid. However, there are important exceptions, such as rural areas off the gas grid, which typically use oil, solid fuel, or electric heating. There are also flats in urban areas, which use electric heating.
Electricity
In recent years, the UK has made significant progress in decarbonising the electricity supply through the phase-out of coal and the introduction of renewables. This has resulted in a steady decrease in the carbon intensity of grid electricity (Evans & Viisainen, 2025) and a corresponding decrease in neighbourhood carbon footprints, see Figure 2. However, as Figure 3 shows, there has only been a more gradual reduction in electricity consumption since 2010, emphasising that decarbonisation has largely come from the supply-side, not the demand-side. Some of this is a genuine reduction in demand through energy efficiency (e.g. LED lights), but this will also include an increase in the use of rooftop solar photovoltaics, which shows up in the data as reduced electricity demand. It is also worth noting that since 2021, the UK has had unusually high energy prices due to the surge in gas prices after the invasion of Ukraine. This is visible in the data as an abrupt reduction in domestic energy demand; while some of this may be due to the adoption of energy efficiency measures, many households have likely cut back in the form of reduced energy services. While official statistics record that fuel poverty continues to decline (DESNZ, 2025), the Government’s measure balances energy efficiency of the building and household income and considers a home above an EPC Band C to not be in poverty, regardless of energy bills or income. Therefore, if a household responds to the increase in energy prices by sitting in the cold and the dark, they are not considered to be in energy poverty.
A comparison of Figures 2 and 3 highlights some of the demographic factors involved in energy demand. Figure 2 is on a per-capita basis, while Figure 3 is on a per-household basis. In Figure 2, “young ethnic communities” is consistently the lowest emitting group, while in Figure 3, “inner city cosmopolitans” and “hard-pressed flat dwellers” have the lowest energy demand. This reflects the differences in household composition and housing type, with “inner city cosmopolitans” and “hard-pressed flat dwellers” more often being one- or two-person households in flats, thus having low energy demand. “Young ethnic communities” have a higher prevalence of families in houses, meaning higher energy demand per household, but also spread over more people. This contrasts with an important dynamic between per-household and per-capita analyses and the effect of occupancy ratios on energy demand and emissions. A recurring theme throughout much of the local analysis is that the highest emitting people are often small and affluent households living in large homes in spacious neighbourhoods such as the “prospering countryside life” cluster. This has important policy implications, as some of the most polluting households also have the most capacity to change.
So far, there has not been much evidence in the neighbourhood electricity data of increasing electricity demand due to the adoption of heat pumps and electric vehicles. The adoption of both technologies is still low in most of the UK. However, these trends are likely to cause increasing demand in the future.
Gas
Progress on reducing domestic gas consumption has also been limited until recently. Figure 4 shows the median annual household gas consumption across the clusters. There was only a modest reduction in gas demand from 2010 to 2020, followed by an abrupt reduction during the 2021-22 energy crisis, with demand remaining well below the historical trend. Note that the data in Figure 4 is weather-corrected and so accounts for year-to-year variation in heating demand.
Similar spatial patterns are observable in the gas and electricity data, with dense inner-city areas typically having the lowest demand, often despite being quite affluent. Poorer urban areas have slightly higher demand reflecting the differences between building types (e.g. modern flats vs. Victorian terrace houses). Higher consumption is associated with wealthier and suburban areas, reflecting larger homes and less cost-constrained consumers, especially the “affluent communities” cluster. The rural areas (green lines) are slightly misleading, as many rural LSOAs are off the gas grid or partially off the gas grid. This artificially suppresses the gas consumption, as many homes use alternative and more carbon-intensive forms of heating. While the full Carbon & Place tool includes estimates of non-gas heating, the available data is limited, and so a time-series analysis is not possible.
Building fabric
It is much harder to track the energy efficiency of homes over time, to separate changes in behaviour, building fabric, and heating technology. The best available data on the physical characteristics of domestic buildings in the UK are the Energy Performance Certificates (EPCs). However, the homes only require an EPC when they are sold or rented, and certificates are valid for 10 years. Thus, while we have detailed data on more than half of homes in the UK, it is always outdated. Figure 5 shows a summary of over 30 million EPCs that produce a mean EPC rating for each area in each year. This does show a general improvement in the EPC scores over time. For context, a rating of 55–68 corresponds to a band D, while a rating of 69–80 is band C. While EPC scores are not very good at predicting energy consumption (Few et al., 2023) and actively penalise some low-carbon technologies such as heat pumps (Yorkshire Energy Systems, 2019), they do summarise a broad range of building characteristics into a single metric.
Notably, there does not appear to be a significant increase in EPC scores during or after the 2021–22 energy crisis. This supports the hypothesis that households cut their consumption rather than increased their efficiency in response to the crisis. Instead, Figure 5 suggests areas are converging and plateauing around a score of 70 (Band C). This may reflect Government policy, which has targeted the worst-performing buildings, such as minimum standards for rental properties. But also, the increasing cost and technical challenges of retrofitting buildings to the higher standards as the easiest measures have already been taken.
Taking Figures 4 and 5 together suggests the possibility of rebound effects in the energy efficiency of homes, as there appears to have been little reduction in gas demand between 2014 and 2020 despite the improvements in building energy efficiency.
Transport emissions
Overall, in the UK, there has been almost no progress in decarbonising the transport system (CCC, 2025). The UK Government has pinned much of its decarbonisation targets on the transition of electric vehicles, and while the transport decarbonisation plan also emphasised modal shift to active and public transport (DfT, 2021), in practice, progress has been limited or even gone into reverse in some places.
Car driving
Figure 6 shows a local picture that appears to contradict the national picture, with emissions from car driving falling steadily between 2010 and 2022 except for a sharp drop related to the COVID pandemic. Part of this difference may be methodological, as the local emissions are calculated based on vehicle kilometres driven and CO2/km values based on manufacturer data. While the national accounts are based on the quantity of fuel sold. As manufacturer emissions estimates have been shown to sometimes be over-optimistic (Gohlke & Gimbert, 2025), they may be biasing the results. However, other changes are equally significant, especially that total car-km have been steady over the period despite rising populations, and that there has been significant growth in the van fleet for online deliveries, which is not shown in Figure 6 but does contribute to the national emissions.
Car ownership
Data from the Department for Transport reveals the number of vehicles privately registered (cars, vans, motorbikes, etc.) in each LSOA (DFT, 2024). From this, it is possible to produce a measure of vehicles per household as shown in Figure 7. Vehicle ownership varies significantly across the country, with the rate in inner London being as low as 0.4 vehicles/household, while frequency is above 2.5 in rural areas. There is also a divergence between areas over time, with increasing rates of vehicle ownership in rural areas, while the rate of vehicle ownership remains steady in the most urbanised areas.
The trends observed in Figure 7 supplement but slightly contradict early findings that were found before 2010, vehicle ownership was declining in some urban areas on a per-person basis (Morgan et al., 2022). Figure 7 uses a per-household measure, which is more robust as it is not as sensitive to demographic changes, such as a change in the number of children within households.
Figure 8 shows one explanation for the difference and trend in car ownership across the country. Firstly, there is a negative correlation between public transport provision and the rate of vehicle ownership, and most parts of GB have been moving to the top left of the graph, indicating less public transport and higher rates of car ownership. The only place that bucks this trend is London, where public transport provision has remained largely steady and at much higher levels than the rest of the country (FOE, 2023). This is reflected in the “Inner city cosmopolitan” cluster that heavily dominates inner London.
Figure 8 also highlights socio-economic effects of vehicle ownership, with some of the least affluent areas, such as “hard-pressed flat dwellers” and “constrained renters” exhibiting below-trend vehicle ownership, but also some of the fastest increases in vehicle ownership as public transport has declined.
Adoption of electric vehicles
For journeys that must be driven, the UK government has strongly supported the adoption of Battery Electric Vehicles (BEVs) to replace the existing petrol and diesel fleet (DfT, 2021). This includes the ZEV mandate, a ban on the sale of internal combustion vehicles from 2035, with intermediate annual sales targets from 2024 (DfT, 2024). Figure 9 shows that adoption is increasing across all areas but from a low base, with a mix of more affluent and suburban/rural areas being the fastest to adopt BEVs.
The “inner city cosmopolitan” areas have experienced the most rapid adoption of BEVs, which is heavily represented by inner London. London introduced stricter and earlier pollution controls on cars, and this likely explains the rapid adoption of BEVs in these areas. However, the adoption of BEVs in these areas is somewhat surprising given the challenges of charging BEVs in places where off-street parking is unavailable. Inner city drivers also tend to drive the fewest miles per year (Cairns et al., 2017), and so the cost savings of BEVs are less significant compared to their higher purchase price. Therefore, these vehicles may be adopted by affluent households that seek the social status of having a new and green vehicle.
Other clusters with high adoption rates reflect the affluent suburban and semi-rural areas where off-street parking is abundant and annual mileages are higher. These areas are logical early adopters for BEVs as the barriers to adoption are lower and the benefits are greater. In contrast, the lowest rates of adoption are seen in areas where incomes are low, and residents do not have off-street parking.
It should also be noted that Figure 9 only shows vehicles registered to private households and that BEV adoption is much higher among company vehicles. This reflects a typical dynamic in the UK car market where most new cars are bought by fleet operators and then sold into the second-hand market after 2–4 years. Therefore, it might be expected that many of these company vehicles will start to show up in the private vehicle data over the next few years.
Aviation
Aviation is the sector with the largest growth in emissions in the UK (CCC, 2025); it is also one of the most challenging to account for. Partly due to issues such as the non-CO2 warming effects, including radiative forcing and partly due to the international component of aviation, which makes attributing emissions to countries difficult, let alone neighbourhoods. In Carbon & Place, overall aviation emissions are based on (Morgan et al., 2025) which uses airport passenger data to estimate overall passenger kilometres. This approach gives a higher estimate of UK aviation emissions compared to official statistics, as a British person making a return trip abroad would have all their emissions attributed to the UK, whereas official measures would split emissions equally between origin and destination countries. As the UK is a large net exporter of tourists by this accounting, it imports more aviation emissions than it exports. Indeed, the UK has one of the largest international aviation markets in the world (Dyson & Sutherland, 2021).
To attribute aviation emissions to neighbourhoods, the same survey and synthetic population method is used as for the consumption of goods and services, and it is described in more detail below.
Figure 10 clearly shows the dramatic decline in flying during the COVID-19 pandemic and the return that was beginning in 2022. Unlike many other parts of the carbon footprint, “Inner city cosmopolitans” consistently are among the highest emitting groups. This is partly because this cluster is dominant in the affluent areas of London, which have larger immigrant populations, and it is known that Londoners, immigrants, and the wealthy all fly more than the average Briton (Büchs & Mattioli, 2021). This is a particularly significant trend as the high-flying emissions of these communities significantly undermine their otherwise low-carbon lifestyles. Which contrasts with findings in other countries (Bohmann & Küçük, 2024). Emphasising the need to focus on different types of decarbonisation in different places and communities.
As flying is a largely discretionary leisure activity, it is not surprising to see wealthier clusters such as “Affluent communities” having higher emissions, while the poorer clusters such as “Hampered neighbourhoods” have lower emissions. Between 2014 and 2019, there appears to be a slight convergence in per-person emissions between the lowest and highest emitting clusters. This may be due to cheap flights encouraging more low-income people to fly, and the total number of flights did increase during this period. However, an important methodological detail is that the surveys record the number of flights taken by households but not their destination. As the emissions from a flight are highly dependent on the distance flown, there is a significant difference between a household taking a single long-haul flight and one taking multiple short-haul flights (Morgan et al., 2025). As we are unable to account for this difference, flight emissions are allocated purely on the basis of the number of flights. While this accounts for half of households that do not fly in any given year (Büchs & Mattioli, 2021) it likely penalises the moderately wealthy households that can take multiple short-haul flights per year and benefits the hyper-mobile households that take multiple long-haul flights per year (Cass, 2022). Thus, if there has been an increase in low-income households flying only short-haul, the model could be over-allocating emissions to those clusters and, in turn, benefiting the richer households flying long-haul.
Consumption of goods and services
The consumption of goods and services is the most heavily modelled part of the carbon footprint and thus the most uncertain. Figure 11 shows that there is a much greater variability in the data from year to year. This is likely because the Living Costs and Food Survey, which underpins the methodology, is a cross-sectional survey, and so it is not possible to track the same households over multiple years. Thus, the results for each year are produced from data about different households. So even though the data is weighted to ensure demographic and socio-economic consistency, a certain amount of random variation is to be expected. Therefore, inter-year fluctuations should be dismissed, but longer-term trends and consistent differences between areas may indicate real differences rather than modelling artefacts.
Figure 11 highlights a few interesting trends, firstly that the young (e.g. “young ethnic communities” and “cosmopolitan student neighbourhoods”) and the poor (e.g. “constrained renters” and “hard-pressed flat dwellers”) consume less than the more affluent areas (e.g. “affluent communities”). This is perhaps unsurprising as lower incomes restrict the ability of households to purchase goods and services. The relationship between higher incomes and higher consumption largely holds across all parts of the carbon footprint and reflects the simple fact that those who can consume more usually do, and in doing so, pollute more.
There is a noticeable increase in consumption emissions between 2014 and 2016, and this is mirrored in the national data. Much of this increase has been due to imports from higher carbon-emitting countries such as China, which highlights an important contradiction in the UK’s decarbonisation journey, in that progress in reducing territorial emissions has, in part, come by exporting the problem to other countries. Nationally, the proportion of the UK’s consumption-based carbon footprint coming from goods and services imported into the UK has risen from 43% in 2010 to 55% in 2022 and increased from 351 to 404 MtCO2/year. Conversely, emissions from domestically produced goods and services have fallen from 310 to 211 MtCO2/year over the same period (DEFRA, 2025).
The variation between the highest and lowest consuming areas is not particularly large (~40%), which is in line with the variation in average income across the groups. However, at the neighbourhood level, there is significantly more variation in income, with the high-income neighbourhoods having more than eight times the household income and carbon footprint of the lowest-income neighbourhoods.
Some types of consumption do not scale very much with income, such as food and drink, while other significant expenditures, such as mortgage, rent, savings, and pensions, do not contribute to the carbon footprint calculations. It is also known that poorer households spend a greater proportion of their income. There are significant differences in tenure between the clusters, with some being largely renters or mortgage payers who have less disposable income after housing costs than clusters where most own outright. Finally, some of the spending categories that are mostly found among the richer areas, such as private school fees, are not especially carbon-intensive per pound spent. All these factors would be expected to reduce the differences between households’ carbon footprints despite significant variation in income.
Total emissions
Figures 12 and 13 bring together the component parts of the carbon footprint discussed above to reveal the trends in total emissions. Notice how the ranking of clusters does not match individual parts of the carbon footprint but instead reflects that clusters can be high on one carbon measure and low on another.
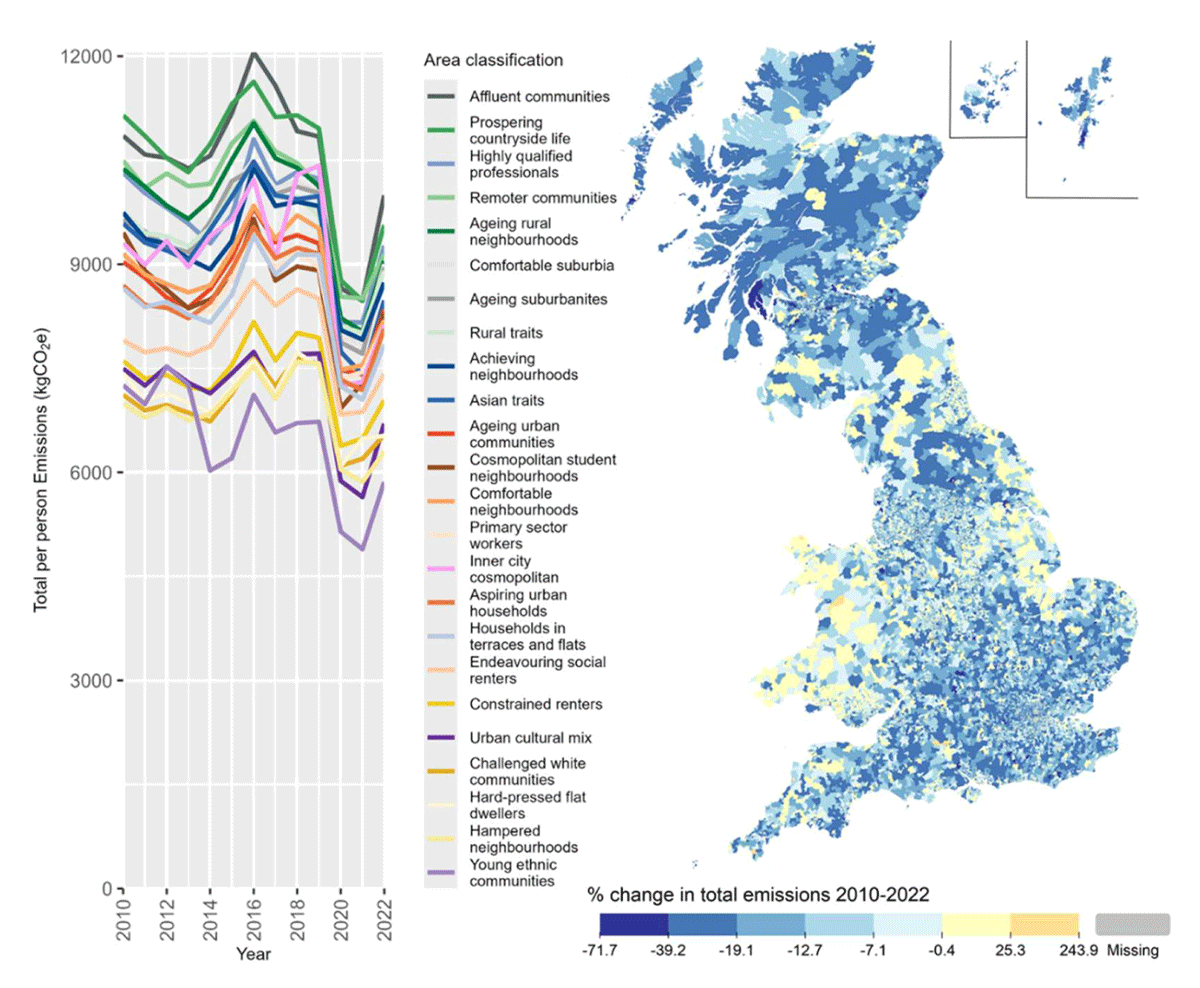
Figure 12
Total per person emissions in different area classifications (left) and percentage change in the LSOA average emissions from 2010 to 2022 (right).
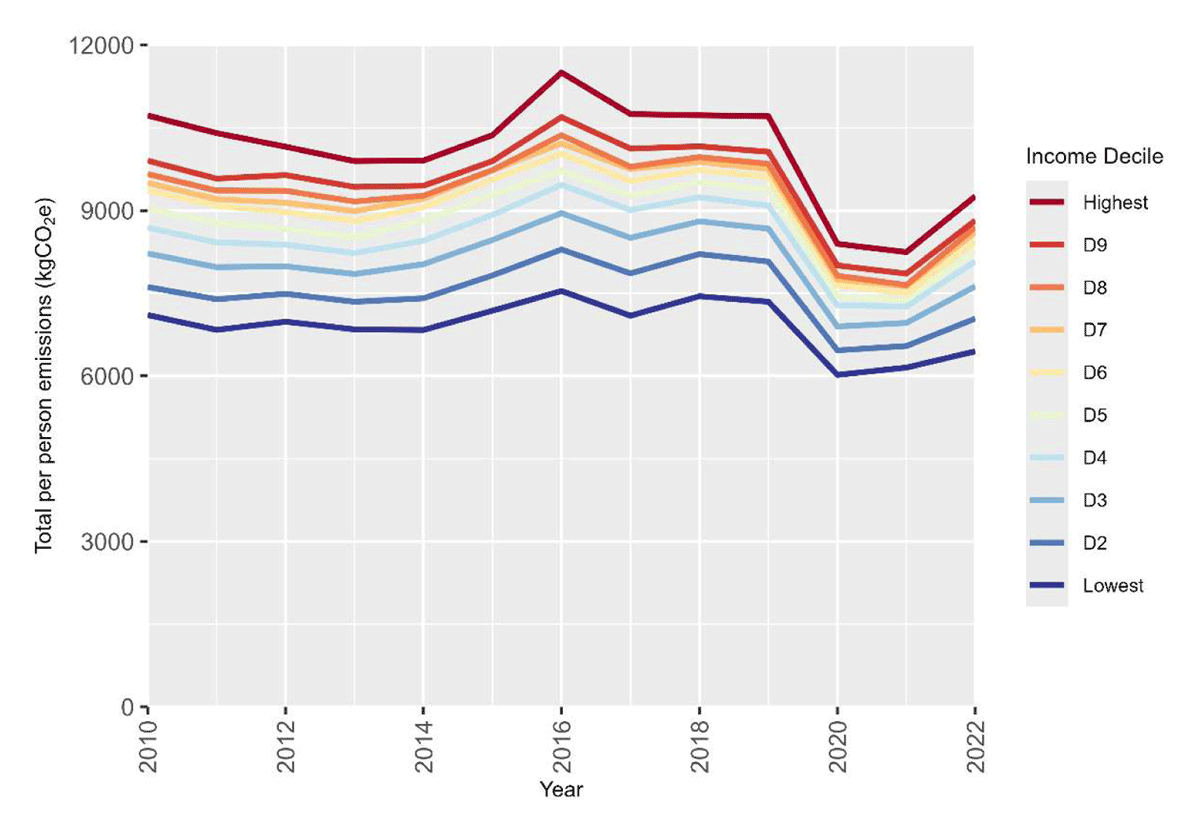
Figure 13
Average total per person emissions for LSOAs by household income decile, based on 2020 income distribution.
Figure 13 reanalyses the data by household income deciles and affirms the relationship between higher income and a higher carbon footprint. However, the variation between highest and lowest income deciles is less than the variation between the geo-demographic clusters. This highlights the benefits of geodemographic clustering of many variables over using a single metric like income. By grouping areas on a broad range of characteristics, it is possible to get a more holistic understanding of a place and its people, which has useful explanatory value. Both rich and poor alike have options to reduce their carbon footprints and can draw lessons from similar places with lower carbon footprints.
Discussion
When considering 13 years of carbon footprints across 43,046 neighbourhoods across Great Britain, several overall narratives emerge.
First, there are clear spatial patterns in carbon footprints that relate to the physical, socio-economic, and demographic makeup of places, such as that, in general, richer households and rural/suburban households consume more than poorer and inner-city households. However, these patterns interact in complex ways, as not everyone in inner-city flats is poor and not everyone in large rural homes is rich. This is why a multi-dimensional clustering is needed to capture the different mix of characteristics in different neighbourhoods rather than relying on any single metric to understand the complexities of people’s lives. A particularly clear example of this is how the “inner city cosmopolitans” are consistently among the lowest emitters across many different parts of the carbon footprint, except for aviation, where they are the highest emitters.
Second, low-income households reliably have lower carbon footprints, but reducing incomes is unlikely to be an attractive policy option. Nevertheless, it does raise questions about climate justice when poorer households are more likely to suffer the consequences of climate change. While higher disposable incomes after housing costs enable higher consumption, and thus emissions, they could also enable additional action on energy efficiency and decarbonisation. For example, many technologies, such as electric vehicles, insulation, and heat pumps, ultimately save money but have high upfront costs that are a barrier to adoption by poorer households. So, it might be expected that richer households may lead the adoption of these new technologies and so be the first to reduce their carbon footprints. Unfortunately, between 2010 and 2022, this does not appear to be the case, as the hierarchy of which clusters are high or low carbon has remained largely static. Wealthier areas do appear to be early adopters of electric vehicles, and so this may start to feed into the carbon footprints in years to come. Policymakers should recognise the missed opportunity for significant carbon reductions from high-polluting households that are rich enough to adopt low-carbon technology but are not early adopters. Policy interventions could include frequent flyer taxes, higher efficiency standards for luxury goods, or taxes on the sale of large energy-inefficient homes that have not been retrofitted. Particularly for technologies that save money in the long term, taxes on inaction that can be avoided by adopting energy efficiency measures would effectively reduce the payback period and provide benefit certainty for households.
Third, the local time-series data reveals several warning signs that undermine what may superficially seem to be a good news story for the UK’s progress towards net-zero. Specifically, while the UK has substantially reduced territorial carbon emissions since 1990, it has done so in a way that is not repeatable and in some cases undesirable. The decarbonisation of the electricity grid lays a strong foundation for the electrification of other parts of the energy system, such as heating and transport. But uptake of heat pumps and electric vehicles is still in the early stages, and without a faster rollout decarbonisation will slow down. The growing proportion of the consumption carbon footprint that comes from imports and aviation highlights a new frontier in the debate about decarbonisation. It is foreseeable that within a decade many households’ day-to-day lives could be reasonably low carbon, but infrequent purchases such as holidays and household electronics make up a sizable portion of their carbon footprints. These kinds of purchases may be challenging to decarbonise as they are often more closely tied to identity and personal preferences than more utilitarian choices about heating and electricity. There is far less research on how to decarbonise these activities and how to engage with the public on these kinds of issues.
Conclusions
For the first time, it has been possible to see how neighbourhood carbon footprint has been changing across Great Britain. This paper has highlighted some of the factors that explain both the progress in decarbonisation and some of the worrying trends that may undermine future progress, particularly in heating and transport. The cluster analysis has revealed that progress in decarbonisation has been mostly uniform across different communities. However, there are significant differences between clusters, and which clusters are the highest or lowest carbon depends on what part of the carbon footprint is considered. There is a missed opportunity to target policy at the highest emitting groups that are typically wealthier and suburban or rural and so have greater potential to decarbonise. However, there is tension between the need to deliver decarbonisation and to deliver the other benefits of energy efficiency such as poverty relief, as there remains strong evidence of rebound effects especially in domestic heating.
This study makes four principal contributions. First, it provides the world’s first longitudinal analyses of neighbourhood carbon footprints covering all of Great Britain over a thirteen-year period. Second, it shows that geodemographic clustering can help in understanding why different places are on different decarbonisation pathways. Third, it helps distinguish between emissions reductions driven by supply-side decarbonisation (such as electricity) and those dependent upon household-level technology adoption and behavioural change. Finally, it highlights opportunities for more targeted place-based net-zero policies that recognise the different circumstances of people and places across the country.
Notes
[1] Readers should be aware of the distinction between the geographical term ‘Great Britain’ (GB) for England, Scotland, and Wales and the nation of the ‘United Kingdom of Great Britain and Northern Ireland’ (UK). This paper mostly focuses on Great Britian as the analysis does not include Northern Ireland, however the paper does refer to the UK when policy or data is for the whole country.
[2] In the case of domestic EPCs coverage is typically over 50% but can be as low as 30% in some areas.
[3] The ONS provides descriptive pen portraits of each of the clusters at https://www.ons.gov.uk/methodology/geography/geographicalproducts/areaclassifications/2011areaclassifications/penportraitsandradialplots see the section labelled “Pen portraits for the 2011 Area Classification for Super Output Areas”.
Data Accessibility Statement
The data used in this paper are available for download from www.carbon.place/data and in an interactive form in the rest of the Carbon & Place website. For the code of the fully reproducible analysis and the raw input data, see code and documentation at github.com/PlaceBasedCarbonCalculator.